Gaming Machine Gambling Statistics and Research Paper - Information for Territorial Authorities - Paper prepared by Jarrod True and Martin Cheer ...
←
→
Page content transcription
If your browser does not render page correctly, please read the page content below
Gaming Machine Gambling Statistics and
    Research Paper – Information for
         Territorial Authorities

_______________________________________________________

Paper prepared by Jarrod True and Martin Cheer

Updated July 2021
Gaming Machine Statistics and Research Paper – Information for
                        Territorial Authorities
Introduction

1.      This paper has been prepared by Jarrod True and Martin Cheer. Jarrod is a barrister
        and solicitor with 25 years’ experience. Jarrod is also the author of the New Zealand
        Gambling Law Guide (www.gamblinglaw.co.nz), and the author of Gambling Law (a
        Thomson Reuters publication). Martin Cheer is the CEO of Pub Charity.

2.      The aim of this paper is to assist territorial authorities with their decision-making
        process by setting out some of the key statistics regarding class 4 gambling and
        problem gambling.

Executive Summary

3.      The Gambling Act 2003 seeks to balance the potential harm from gambling against
        the benefits of using gaming machines as a mechanism for community fundraising. In
        2019, approximately $294m of grant funding was approved across 26,337 grants to
        9,688 different organisations. 1 In addition, over $75m was applied by TAB New
        Zealand ($17m), Youthtown ($8m) and various RSAs and Workingmen’s Clubs ($50m)
        to support their own activities. 52% of the grants distributed in 2019 were sports
        related. The second most popular category was community (19.7%).

4.      New Zealand has a very low problem gambling rate by international standards. The
        New Zealand National Gambling Study: Wave 4 (2015) 2 found the problem gambling
        rate was 0.2% of people aged 18 years and over. The problem gambling rate is for all
        forms of gambling, not just gaming machine gambling.

5.      The reasons for an increase or decrease in problem gambling are complex and multi-
        faceted, not simply the direct by-product of an increase or decrease in machine
        numbers.

6.      The New Zealand problem gambling prevalence rate over time bears no correlation to
        the number of gaming machines operating in New Zealand.

7.      Between 1991 and 1999 the problem gambling rate declined considerably despite
        gaming machine numbers doubling and gaming machine expenditure trebling.
        Between 2006 and 2010 the problem rate increased, despite the number of gaming
        machines in New Zealand falling considerably in the same period. Between 2010 and
        2015 the problem gambling rate stayed the same, despite a continual decline in
        gaming machine numbers.

1
        http://www.gamblinglaw.co.nz/download/Gaming_Machine_Grant_Data_2019.pdf
2
        https://www.health.govt.nz/system/files/documents/publications/national-gambling-study-report-6-aug18.pdf

                                                      2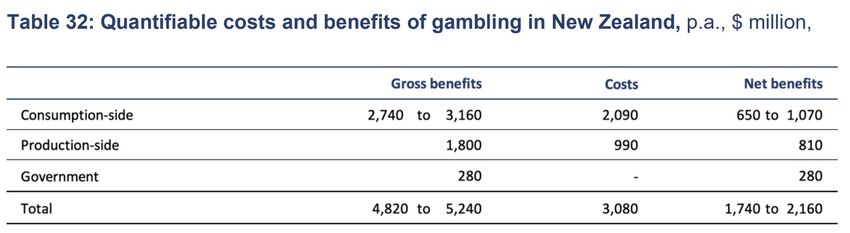
General Class 4 Gambling Facts

Gaming Machines Have Operated in New Zealand for a Considerable Period

8.     Gaming machines have been present in New Zealand communities since the early
       1980s. Initially the machines were operated without a gaming licence. The first
       gaming licence was issued to Pub Charity on 25 March 1988, over 31 years ago.

9.     Gambling is a popular form of entertainment that most New Zealanders participate in.
       The 2018 Health and Lifestyles Survey 3 found that 67.2% of adult New Zealanders
       had participated in some form of gambling in the previous 12 months (estimated to be
       2,650,000.00 adults).

Gambling is an Enjoyable Activity

10.    The majority of people who gamble do so because they find it an enjoyable activity.
       This is observed by Suits (1979, p. 155) 4, who states:

                 Gambling is a recreational activity or a kind of participation sport from which
                 the principal satisfaction derives from the activity itself and from the ebb and
                 flow of wins and losses rather than from ultimate outcome - the net amount
                 won or lost. For most gamblers, the purpose of gambling is not to get rich, but
3
       https://www.hpa.org.nz/research-library/research-publications/2018-health-and-lifestyles-survey-methodology-report

4      Suits, D. (1979). The Elasticity of Demand for Gambling. The Quarterly Journal of Economics, 93(1), 155–162.
       https://doi.org/10.2307/1882605

                                                      3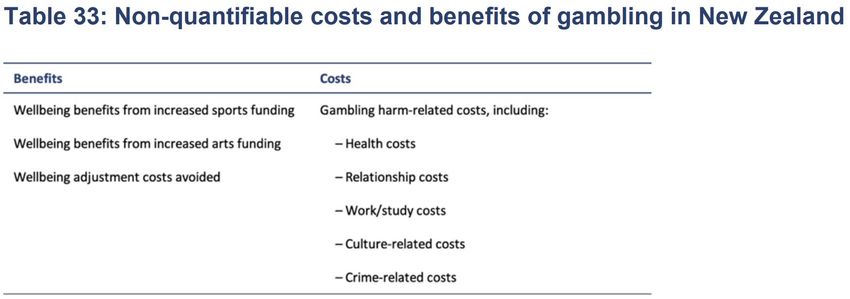
to "have fun," to experience "excitement," or to have "something to look forward
                to," and they view payment for this recreation in the same light as others look
                on outlays for theatre tickets, vacation trips, or a night on the town.

11.   The 7 out of 10 New Zealand adults who gambled recreationally in some form last year
      did so to gain an enjoyment benefit, which can take a number of forms. The nature of
      this enjoyment varies for each individual and often differs between gambling types.
      For example, the average:

      a.        Lotto player may enjoy the thrill of being in the draw and the dream of their
                lifestyle if they win the jackpot;

      b.        Sports better may enjoy accumulating knowledge and testing their ability to
                analyse and predict the winner or may simply enjoy backing their favourite
                team;

      c.        A gaming machine player may enjoy the relaxation or escapism of gaming
                machines; while an average

      d.        Casino gambler may enjoy testing their luck and skill across a range of table
                games.

12.   Gambling for the non-addicted gambler may also be an avenue for socialising, stress
      relief and a way of having fun. Contrary to how it may appear from a non-gambler’s
      perspective, gamblers do not necessarily anticipate they will make money from
      gambling. Parke (2015) 5 states:

                Players mostly realise that they are paying for a leisure experience. They are
                not expecting to be paid, except for a small minority, who are going to earn an
                income as a professional gambler.

Gaming Machine Funding

13.   The Gambling Act 2003 seeks to balance the potential harm from gambling against
      the benefits of using gaming machines as a mechanism for community fundraising.

14.   In 2019, approximately $294m of grant funding was approved across 26,337 grants to
      9,688 different organisations. 6 In addition, over $75m was applied by TAB New
      Zealand ($17m), Youthtown ($8m) and various RSAs and Workingmen’s Clubs ($50m)
      to support their own activities. 52% of the grants distributed in 2019 were sports
      related. The second most popular category was community (19.7%).

5     Parke, J. (2015). Gambling, leisure and pleasure: Exploring psychosocial need satisfaction in gambling. Presentation
      at the KPMG eGaming summit. https://home.kpmg.com/ content/dam/kpmg/pdf/2016/07/im-esummit-report-2015.pdf.

6
      http://www.gamblinglaw.co.nz/download/Gaming_Machine_Grant_Data_2019.pdf

                                                     4
15.   In contrast to the amount of grants made by gaming machine trusts, NZ Lotteries
      transferred $202 million to the Lottery Grants Board for community services and
      projects, TAB New Zealand allocated $142 million, mostly to support racing club

                                      5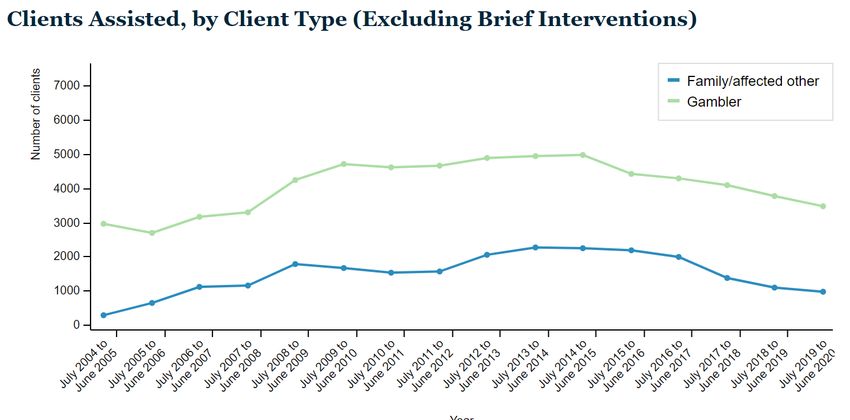
activities and infrastructure, and Casinos paid just over $3 million to their community
      trusts.

16.   In 2012, the Auckland City Council commissioned a community funding survey. The
      survey data is summarised in the report Community Funding: A Focus on Gaming
      Grants. 7 The report confirms how essential gaming machine funding is to a very large
      number of community organisations and how extremely difficult it would be for such
      funding to be obtained from alternative sources. The key findings of the survey are:

      •   Most respondents (75%) indicated that their organisation is moderately or totally
          reliant on gaming machine funding to fund core business activities.

      •   Most respondents (55%) believed that there would be a high to extreme risk to their
          organisation and their core business if they did not receive gaming funding. A
          further one-quarter (26%) said that there would be a moderate risk if they did not
          receive it.

      •   Two-thirds of respondents (68%) said that they thought that they would be unlikely
          to find another source of funding if gaming funding was not available.

17.   The report concluded:

               Gaming Trust funding is a major source of community funding for organisations
               in the Auckland Region. Most respondents believe that the funding for their
               organisations is not particularly secure and are highly dependent on gaming
               funding, not just for discretionary or extra activities, but to fund their core
               business. There is a dependence on this funding with over half the
               respondents believing that their organisations would be at extreme risk if they
               did not receive it. Most felt that if the funding was not available, they would
               struggle to find an alternative source of funding. Some would cut down the
               activities they undertook, others say they would be forced to close down.

Positive Economic Impact From the Gaming Industry

18.   In 2012, Auckland City Council commissioned an economic impact report on the
      impact of the class 4 gambling industry. The Economic Impact Report 8 confirmed that
      the non-casino gaming machine sector makes a positive economic contribution. The
      report at page 22 concluded:

               Overall, the non-casino gaming machine industry has a positive economic
               impact on the Auckland economy.

Positive Wellbeing Impact From Gambling in New Zealand

19.   The 2021 TDB Advisory report, Gambling in New Zealand: A National Wellbeing
      Analysis 9, found that gambling in New Zealand had a net positive wellbeing benefit
      totalling around $1.74b to $2.16b per annum. The costs and benefits are summarised
      in the following two tables which can be found on pages 87 and 88 of the report:

7
      http://www.gamblinglaw.co.nz/download/Research/Auckland_City_Community_Funding_Report.pdf
8
      www.gamblinglaw.co.nz/download/Research/Auckland_City_Economic_Impacts_Report.pdf

9     https://www.gamblinglaw.co.nz/download/Gambling_in_New_Zealand.pdf

                                                6
New Zealand Government Taxes and Return to Player
20. The return to players on a non-casino gaming machine is required to be set between
78% and 92%, with most being set at 91.5%. On average, for every $1.00 gambled,
91.5 cents is returned to the player in winnings. The money retained is typically
allocated as follows:
Typical Distribution of Gaming Machine Profits
GST Inclusive GST Exclusive
Government Duty 20% 23%
GST 13.04% 0
Problem Gambling Levy 0.78% 0.90%
DIA Costs 2.9% 3.33%
Gaming Machine Depreciation 6.95% 8%
Repairs & Maintenance 2.84% 3.27%
Venue Costs 13.9% 16%
Society Costs 1.74% 2%
Donations 37.83% 43.5%
Authorised Purpose Return Amount
21. Gaming societies that mainly make external grants (traditional gaming societies, not
clubs) are required to return a minimum of 40% of their gross proceeds to authorised
purposes. Following the Covid-19 revenue loss, the 40% return minimum was
suspended for the financial years ending 2020 and 2021.
722. The graph below details the amount of gaming machine proceeds distributed in each
region. 10
23. Although societies that mainly apply funds (clubs) are not subject to the 40% minimum
return regulation, it is common practice for such societies to be subject to a licence
condition requiring a minimum of between 25% and 37.12% to be distributed or applied
to authorised purposes.
Non-Casino Gaming Machine Numbers in New Zealand
24. The number of gaming machines in New Zealand is published by the Department at
three monthly intervals. A link to the information can be found at
https://www.dia.govt.nz/gambling-statistics-historical-data-machine-numbers
25. The number of machines peaked in June 2003 (25,221). In December 2020, there
were 14,781 machines.
10 http://www.gamblinglaw.co.nz/download/Gaming_Machine_Grant_Data_2019.pdf
8Source: DIA website https://catalogue.data.govt.nz/dataset/gaming-machine-profits-gmp-
dashboard/resource/60081bcd-f2ae-4b97-8a9f-fe449fa59969
Non-Casino Gaming Machine Proceeds
26. The proceeds from non-casino gaming machines increased 3.1% from $895 million in
2018 to $924 million in 2019. However, after adjusting for both inflation and changes
in the adult population, expenditure on non-casino gaming machines is declining ($242
per person in both 2015/16 and 2016/17 years to $238 in the 2017/18 year). This
coincides with declining numbers of venues and machines.
Primary Gambling Mode of People Help Seeking
27. For the 2019/2020 financial year 46.05% of new clients who sought help cited non-
casino gaming machines as their primary gambling mode. 10.09% cited casino
gaming machines, making the gaming machine total 56.14%.
9Primary Gambling Mode of New People Presenting for
Problem Gambling / Intervention 2019/2020
1.18% Housie
10.91% Other
1.33% Cards
8.50% NZ Racing
Board
46.05% Non-Casino
11.01% Lottteries
Gaming Machines
Commission
Products
10.91% Casino
Table
10.09% Casnio
Gaming Machines
Source: Ministry of Health Website http://www.health.govt.nz/our-work/preventative-
health-wellness/problem-gambling/service-user-data/intervention-client-
data#total_assisted.
Total Problem Gambling Clients Assisted
28. The total number of people assisted for gambling problems (all forms of gambling) is
published by the Ministry of Health and can be found at: http://www.health.govt.nz/our-
work/preventative-health-wellness/problem-gambling/service-user-data/intervention-
client-data#total_assisted
1029. Records are kept of the number of people who seek help for problem gambling in each
territorial authority. 11 The table below shows the number of persons who sought help
in each territorial authority in the period July 2019 to June 2020.
Table 10: Clients Assisted, by Territorial Authority (Ex Brief Intervention Type)
Territorial Authority July 2019 to June 2020
New clients All clients
Assisted assisted
Ashburton District Council 2 7
Auckland City Council 842 1933
Banks Peninsula District Council 0 0
Buller District Council 0 0
Carterton District Council 2 2
Central Hawkes Bay District Council 4 9
Central Otago District Council 2 4
Chatham Islands Council 1 1
Christchurch City Council 253 578
Clutha District Council 1 6
Dunedin City Council 33 100
Far North District Council 15 33
Franklin District Council┼ 0 3
Gisborne District Council 2 4
Gore District Council 0 1
Grey District Council 1 1
Hamilton City Council 123 195
Hastings District Council 52 146
11
http://www.health.govt.nz/our-work/mental-health-and-addictions/problem-gambling/service-user-data/intervention-
client-data#territorial
11Hauraki District Council 1 2
Horowhenua District Council 19 44
Hurunui District Council 0 0
Hutt City Council 17 48
Invercargill City Council 28 95
Kaikoura District Council 1 1
Kaipara District Council 2 5
Kapiti Coast District Council 12 30
Kawerau District Council 6 12
MacKenzie District Council 0 0
Manawatu District Council 9 14
Marlborough District Council 4 22
Masterton District Council 14 26
Matamata - Piako District Council 2 2
Napier City Council 28 91
Nelson City Council 15 57
New Plymouth District Council 13 32
Opotiki District Council 0 0
Otorohonga District Council 1 1
Palmerston North District Council 32 61
Porirua District Council 80 199
Queenstown - Lakes District Council 3 5
Rangitikei District Council 2 3
Rotorua District Council 54 88
Ruapehu District Council 0 0
Selwyn District Council 3 3
South Taranaki District Council 0 3
South Waikato District Council 6 10
South Wairarapa District Council 2 3
Southland District Council 0 0
Stratford District Council 0 1
Tararua District Council 1 2
Tasman District Council 16 28
Taupo District Council 1 5
Tauranga District Council 47 89
Thames - Coromandel District Council 2 4
Timaru District Council 12 34
Upper Hutt City Council 35 53
Waikato District Council 34 45
Waimakariri District Council 4 10
Waimate District Council 1 3
Waipa District Council 3 9
Wairoa District Council 6 9
12Waitaki District Council 1 1
Waitomo District Council 1 1
Wanganui District Council 7 22
Wellington City Council 49 129
Western Bay of Plenty District Council 7 9
Westland District Council 1 2
Whakatane District Council 17 34
Whangarei District Council 17 68
TLA not recorded 0 0
Total 1952 4439
More Help Seeking Does Not Necessarily Mean More Problem Gambling
30. The fact that more people are seeking help does not necessarily mean that problem
gambling is increasing. The increase in help seeking could be due to:
a. A general change in society’s attitude toward counselling services and seeking
help. People are more aware now of the services available and more inclined
to seek help;
b. The general economic decline. The sharp increase in help seeking in the
period from 2008 to 2011 corresponds with the global financial crisis. A
reduction in disposable income tends to bring any gambling loss to the fore;
and
c. A corresponding increase in television, radio and newspaper advertising by
treatment providers.
31. In Professor Max Abbott’s 2006 paper Do EGMs and Problem Gambling Go Together
Like a Horse and Carriage?, 12 Professor Abbott stated:
…help seeking is only partly driven by the number of people with problems…
32. The Gambling Commission in its 2009 Report on the Proposed Problem Gambling
Levy: 2010-2013 13 stated:
In the Ministry’s previous two Service Plans, presentations were seen to be a
fair proxy for harm on the assumption that presentations are about help-
seeking, and help-seeking is about harm. The 90% weighting previously given
to presentations was indicative of the view that presentation data is a highly
reliable indicative proxy for the causation of harm. The Commission did not
share the Ministry’s view.
The Commission … continues to have serious concerns about whether the
number of persons presenting to problem gambling treatment providers is a
fair or accurate proxy for harm.
Based on the submissions made by problem gambling treatment provides and
PwC’s recommendations, the Commission recommends that consideration be
12
http://www.austgamingcouncil.org.au/images/pdf/eLibrary/3049.pdf
13
http://www.gamblingcommission.govt.nz/GCwebsite.nsf/Files/ProblemGamblingReport3/$file/
PGLReport2009.pdf
13given to using prevalence data from surveys rather than presentation data.
The Commission recognises that prevalence studies have tended to produce
a similar picture of the attributed modes of problem gambling so the outcomes
may not diverge very substantially, but the use of that data is capable of
providing a fairer indication of responsibility for harm and, in addition, removes
any perverse incentives.
Low Problem Gambling Rate
33. New Zealand has a very low problem gambling rate by international standards. The
New Zealand National Gambling Study: Wave 4 (2015) 14 found the problem gambling
rate was 0.2% of people aged 18 years and over. The problem gambling rate is for all
forms of gambling, not just gaming machine gambling.
Comparing National Problem Gambling Prevalence Rates
Jurisdiction Year Problem Gambling Rate
New Zealand 2015 0.2%
Canada 2005 2.0%
USA 2015 4.6%
Brazil 2010 1.3%
South Korea 2013 0.5%
Singapore 2015 0.5%
Hong Kong 2012 1.9%
Macau 2005 2.5%
Australia 2015 0.4%
South Africa 2013 3.2%
Cyprus 2012 2.2%
Czech Republic 2014 2.3%
Denmark 2012 0.9%
Finland 2014 0.6%
France 2015 0.5%
Germany 2015 1.7%
Great Britain 2012 0.7%
Hungary 2012 1.9%
Iceland 2015 0.8%
Italy 2010 1.27%
Northern Island 2010 2.2%
Norway 2009 0.4%
Sweden 2014 0.3%
Sources: Calado F, Griffiths MD. Problem gambling worldwide: An update and systematic
review of empirical research (2000–2015). Journal of Behavioral Addictions. 2016;5(4):592-
613. doi:10.1556/2006.5.2016.073.
http://www.gamblinglaw.co.nz/download/world_wide_problem_gambling_rates.pdf
34. In addition to the problem gambling rate, 1.8% of the New Zealand adult population
are moderate-risk gamblers and 4.6% are low-risk gamblers. 15
14
https://www.health.govt.nz/system/files/documents/publications/national-gambling-study-report-6-aug18.pdf
15
https://www.health.govt.nz/system/files/documents/publications/national-gambling-study-report-6-aug18.pdf
14Addressing Problem Gambling Issues
35. Although problem gambling is a serious issue, the evidence suggests that once it is
identified and help is sought, problem gambling can be effectively and promptly
treated.
36. In his 2006 paper Do EGMs and Problem Gambling Go Together Like a Horse and
Carriage? 16 Professor Max Abbott noted:
All [prospective studies] have confirmed the finding that problem gambling, for
many, is a transitional rather than absorbing state.
…
It appears likely that EGM-related problems are labile, typically both developing
and resolving much more rapidly than those linked to track betting and perhaps
some other forms such as card games.
37. The 2011 KPMG report Value for Money review of problem gambling services 17 notes:
The Auckland University of Technology Stage Three Evaluation of Problem
Gambling Intervention Services (2010) found that the vast majority of clients
surveyed reported positive treatment outcomes and high levels of satisfaction
with the treatment experience.
38. The Ministry of Health document, Problem Gambling Intervention Services in New
Zealand 2007 Service-user statistics Public Health Intelligence Monitoring Report No.
18 18 noted that 38.5% of problem gamblers received three hours’ treatment or less via
face to face counselling. The report states on page 16:
Hours of treatment received
The majority of clients (86.4%) received 1.25 hours or more of treatment in
2007, with more than half of the clients in 2007 receiving between 1.25 and
9.745 hours of treatment.
Problem Gambling Screen
39. The Problem Gambling Severity Index (PGSI) contains nine questions that are strong
predictors of gambling harm (e.g., feeling guilty about gambling, having financial
difficulties, betting more than one can afford).
40. Respondents are asked whether they have experienced these signs of harm caused
by gambling and, if so, whether this happened “sometimes, most of the time or almost
always”. They are allocated from one point for “sometimes” to three points for “almost
always”, and can therefore be allocated up to 27 points.
41. Respondents are then classified into the following categories: non-gamblers (those
who did not answer “yes” to any of the questions about participation in gambling in the
last 12 months), non-problem gamblers (those who had gambled, but answered “no”
to all the PGSI questions about experiencing harm), low-risk gamblers (who got 1 or 2
16
http://www.austgamingcouncil.org.au/images/pdf/eLibrary/3049.pdf
17
Value for Money review of problem gambling services
http://www.health.govt.nz/system/files/documents/publications/vfm-report-final_1.pdf
18
http://www.health.govt.nz/system/files/documents/publications/problem-gambling-intervention-2007.pdf
15points according to the PGSI), moderate-risk gamblers (who got 3-7 points) and
problem gamblers (who got 8 or more points).
Area Question
Loss of control How often have you bet more than you could really afford to
lose?
Motivation Have you needed to gamble with larger amounts of money to
get the same feeling of excitement?
Chasing How often have you gone back another day to try to win back
the money you lost?
Borrowing How often have you borrowed money or sold anything to get
money to gamble?
Problem How often have you felt that you might have a problem with
recognition gambling?
Criticism How often have people criticised your betting or told you that
you had a gambling problem, regardless of whether or not you
thought it was true?
Feelings of guilt How often have you felt guilty about the way you gamble or what
happens when you gamble?
Negative effects How often has gambling caused you any health problems,
on health included stress or anxiety?
Financial How often has your gambling caused any financial problems for
problems you or your household?
Scoring the nine-question CPGI/ PGSI
Problem Description CPGI/ PGSI scores
Gambling level
Non-gambler Did not gamble in the last 12 Did not answer
months CPGI/PGSI
Recreational Not experiencing any negative 0
gambler consequences of gambling. May
gamble at low levels, or at social
levels that are not problematic
Low-risk gambler Probably gambling at levels that 1-2
are not leading to negative
consequences
Moderate-risk Gambling at levels that may or may 3-7
gambler not be leading to negative
consequences
Problem gambler Gambling at levels that are leading 8 or more (to a maximum
to negative consequences. They of 27)
may have lost control of their
gambling behaviour
Problem Gambling Prevalence Rates
42. It is difficult to review the trend in problem gambling prevalence rates in New Zealand.
Studies have used different screens and vary vastly in sample size. The different
screens produce different percentages. The different screens also capture different
levels of gambling issues in the overall percentage quoted.
16Survey Year Survey Name Screen Problem Survey Size
Gambling Rate
1991 1991 National SOGS-R 1.2% of people 3,933
Prevalence were current
Survey pathological
gamblers
(SOGRS-R
score of 5)
1999 1999 National SOGS-R 0.5% of people 6,452
Prevalence aged over 18
Survey 19 years had a
SOGS-R score
of 5
2006/2007 2006/07 New PGSI 0.4% of people 12,488
Zealand Health aged 15 years
Survey 20 and over
2010 2010 Health PGSI 0.7% of people 1,740
and Lifestyles aged 15 years
Survey 21 and over
2011/2012 2011/12 New PGSI 0.3% of people 9,821
Zealand Health aged 15 years
Survey 22 and over
2012 (March to 2012 National PGSI 0.7% of people 6,251
October) Gambling aged 18 years
Survey 23 and over
2013 New Zealand PGSI 0.5% of people 6,251
National aged 18 years
Gambling and over
Study: Wave 2
(2013) 24
2014 New Zealand PGSI 0.3% of people 6,251
National aged 18 years
Gambling and over
Study: Wave 3
(2014) 25
2015 New Zealand PGSI 0.2% of people 2,770
National aged 18 years
Gambling and over
Study: Wave 4
(2015) 26
19
http://www.dia.govt.nz/pubforms.nsf/URL/TakingthePulse.pdf/$file/TakingthePulse.pdf
20
http://www.health.govt.nz/system/files/documents/publications/portrait-of-health-june08.pdf
17 Gray, R 2011 New Zealanders’ Participation in Gambling: Results from the 2010 Health and Lifestyles Survey – Health
Sponsorship Council http://www.hsc.org.nz/sites/default/files/publications/Gambling_
Participation_final-web.pdf (page 14)
22
http://www.health.govt.nz/system/files/documents/publications/problem-gambling-preliminary-findings.pdf
23
https://www.health.govt.nz/system/files/documents/publications/national-gambling-study-report-2.docx
24
http://www.health.govt.nz/system/files/documents/pages/report-national-gambling-study-12-month-final-23-10-15.pdf
25
https://www.health.govt.nz/publication/new-zealand-national-gambling-study-wave-3-2014
26
https://www.health.govt.nz/system/files/documents/publications/national-gambling-study-report-6-aug18.pdf
17Does More Machines Mean More Problem Gambling?
43. There is no direct correlation between gaming machine numbers and problem
gambling rates. Over the last ten years, the problem gambling rate has remained
static, despite gaming machine numbers declining rapidly (4,472 gaming machines
have been removed from the market).
44. The reasons for an increase or decrease in problem gambling are complex and multi-
faceted, not simply the direct by-product of an increase or decrease in machine
numbers.
45. The New Zealand National Gambling Study: Wave 4 (2015) 27 noted that problem
gambling had plateaued over the last 20 years and the plateauing harm rates were not
consistent with the hypothesis that more gambling availability leads to more harm. The
report stated:
From 2012 to 2015, overall gambling participation has declined whilst problem
gambling and low-risk and moderate-risk gambling levels have remained
static.
…
Considering findings from all of the New Zealand studies, it appears that
problem gambling prevalence, within the probable pathological, problem and
moderate-risk range, decreased during the 1990s and subsequently
plateaued. As gambling availability increased during the 1990s, the reductions
both in gambling participation and problem gambling prevalence are consistent
with the adaptation hypothesis.
…
The challenge, from a public health perspective, is to identify what factors
explain the persistence of harm in the face of declining gambling participation.
…
Participation has decreased markedly over the past 15 or so years yet harm
has plateaued. To further reduce gambling-related harm, increased attention
will need to be given to other modifiable risk and protective factors.
46. The 2012 National Gambling Survey 28 concluded that the prevalence of problematic
gambling reduced significantly during the 1990s and has since stayed about the same.
The report stated on pages 17 and 18:
Problem gambling and related harms probably reduced significantly during the
1990s but have since remained at about the same level despite reductions in
non-casino EGM numbers and the expansion of regulatory, public health and
treatment measures. Given that gambling availability expanded markedly since
1987 and official expenditure continued to increase until 2004, these findings
are consistent with the adaptation hypothesis. This hypothesis proposes that
while gambling problems increase when high risk forms of gambling are first
introduced and made widely available, over time individual and environmental
adaptations occur that lead to problem reduction.
47. The New Zealand National Gambling Study: Wave 3 (2014) 29 noted that the problem
gambling rate had remained the same over the last 10-15 years despite gaming
machine numbers decreasing. The report stated on page 19:
27
https://www.health.govt.nz/system/files/documents/publications/national-gambling-study-report-6-aug18.pdf
28
https://www.health.govt.nz/system/files/documents/publications/national-gambling-study-report-2.docx
29
https://www.health.govt.nz/publication/new-zealand-national-gambling-study-wave-3-2014
18In contrast to the 1990s, there is no evidence that problem gambling
prevalence decreased with decreasing participation rates during the 2000s.
When methodological differences between studies are taken into account, it
appears that problem gambling prevalence has remained much the same
during the past 10 to 15 years.
…gambling participation has decreased substantially in New Zealand during
the past 20 years, and problem gambling and related harm has probably
plateaued…
48. Professor Max Abbott is New Zealand’s leading expert on problem gambling. In 2006,
Professor Abbott published a paper titled Do EGMs and Problem Gambling Go
Together Like a Horse and Carriage? 30 The paper noted that gaming machine
reductions and the introduction of caps generally appear to have little impact on
problem gambling rates. Professor Abbott noted:
EGM reductions and the introduction of caps generally appear to have little
impact (page 1).
Over time, years rather than decades, adaptation (‘host’ immunity and
protective environmental changes) typically occurs and problem levels reduce,
even in the face of increasing exposure. (page 6).
Contrary to expectation, as indicated previously, although EGM numbers and
expenditure increased substantially in New Zealand from 1991 to 1999, the
percentage of adults who gambled weekly dropped from 48% to 40%. This is
of particular interest because it suggests that greater availability and
expenditure do not necessarily increase high-risk exposure. (page 14).
1991 and 1999 Comparative Studies
49. The Public Health Intelligence section of the Ministry of Health has produced a
document Problem Gambling Research Programme 2005-2010. 31 The document
states on pages 13 and 14:
New Zealand is fortunate in that it is the only jurisdiction in which a nationally
representative survey has been replicated with the same measurement
instrument. 32 The initial survey was conducted in 1991 33 and found that some
48% of respondents (18 years and over) reported gambling in at least one
form, weekly or more often. The lifetime “probable pathological gambling”
prevalence was estimated at 2.7%, with the current (previous six months)
estimate 1.2%. This lifetime estimate was higher than comparable North
American surveys.
A second survey 34 was completed in 1999. It is worth noting that in the eight
years between the initial survey and the 1999 survey, expenditure on gambling
had doubled, electronic gambling machine expenditure had trebled, and
casinos were introduced in Christchurch (1996) and Auckland (1998). Given
these substantial increases in the accessibility and availability of gambling
alternatives, the general expectation was that problem gambling would have
30
http://www.gamblinglaw.co.nz/download/Research/Do_EGMs_and_problem_gambling_go_together.pdf
31
http://www.health.govt.nz/system/files/documents/pages/research-strategy2005-2010.pdf.
32
This instrument was the South Oaks gambling Screen (SOGS, SOGS-R)
33
Abbott & Volberg, 1996
34
Abbott & Volberg, 2000
19increased substantially. However, the results did not support this prediction,
and lifetime prevalence was estimated at 1%, with current prevalence of 0.5%.
Most recently, the 2002/03 New Zealand Health Survey (NZHS) estimated that
69.4% of New Zealanders had participated in gambling activities in the past 12
months, and the estimate for current problem gambling levels (moderate to
severe problems) was 1.2%. 35
There is growing evidence that the prevalence of problem gambling has
levelled out in New Zealand. The methodologies used by Abbott and Volberg
(1996, 2000) and in the NZHS (notwithstanding the concerns over the one-off
screen) were very sound. Internationally, the evidence remains somewhat
confused. Abbott (2001) subsequently reviewed a number of North American
replication studies, and found that seven had higher prevalence estimates on
replication, in keeping with the notion that increased availability and
expenditure would result in increased prevalence. However, eight studies
showed reductions in prevalence. Decreases have also been noted in
Australia. 36
Although a consensus has yet to be reached, when the existing evidence is
considered, methodological and confounding factors notwithstanding, it does
not support the simple notion that at a population level increased availability
and expenditure necessarily results in increases in gambling problems.
Rather, there is likely to be a more complex multi-faceted relationship, or series
of relationships involved.
Abbott et al (2004) have discussed some of this evidence at a more detailed
level and suggest that prevalence rates may tend to level out in mature
markets, even as gambling accessibility continues to increase. However, this
is not necessarily a naturally occurring phenomenon. In more mature markets
such as New Zealand, factors such as a greater awareness of problem
gambling, increased availability of problem gambling services, increased
regulation, improved harm minimisation measures, increased host
responsibility, changing participation patterns, and aging successive cohorts
may all play some role in producing this phenomenon.
South Australia Centre For Economic Studies 2005
50. The 2005 South Australia Centre for Economic Studies paper 37 stated:
We find no evidence that the regional cap policy had any positive influence on
problem gamblers attending counselling, on problem gambler counselling
rates or other help seeking behaviour.
Professor Max Abbott – 2006
51. In 2006 Professor Max Abbott’s paper Situational Factors that Affect Gambling
Behaviour 38 stated at pages 15 and 16:
35
It should be noted that a ‘one-off’ screen was developed and used in this survey and its performance relative to
validated screens has not been empirically established. Therefore, comparisons with prevalence estimates should be
interpreted with a degree of caution.
36
Productivity Commission, 1999
37
The South Australia Centre for Economic Studies, May 2005
38
Abbott, M.W. (2007). Situational factors that affect gambling behavior. In G. Smith, D.C. Hodgins, & R.J. Williams (Eds),
Research and measurement issues in gambling studies. Elsevier, Academic Press Publications.
20New Zealand is the only country where repeat national surveys have been
conducted using comparable methods and measures. During the three years
prior to the 1991 baseline survey (Abbott & Volberg, 1996; Volberg & Abbott,
1994) per capita expenditure more than doubled following introduction of a
national lottery, other lottery products and non-casino EGMs. The initial survey
found 48% of adults gambled weekly or more. The current probable
pathological gambling prevalence estimate was 1.2%. A 1996 survey (North
Health, 1996) obtained an estimate of 0.4%, despite increased availability and
expenditure. A third survey was conducted in 1999 (Abbott & Volberg, 2000),
a few years after casinos were opened in the two major metropolitan areas.
Total gambling expenditure had doubled since 1991. The current prevalence
rate remained low at 0.5%. Frequent participation was also lower than in 1991
(40%), a consequence of fewer people taking part this often in continuous
forms.
Professor Max Abbott – 2009
52. In Storer, Abbott and Stubbs (2009) 39 the authors stated at page 241:
It is likely that both access and adaption forces are at work simultaneously,
with varying implications for policy. First, there is strong support from the
present findings for the access thesis, with strong statistically meaningful
relationships between an increase in problem gambling prevalence and
increasing per capita density of EGMs, at an average increase of 0.8 problem
gamblers for each new EGM. Further, there is no evidence of plateauing of
prevalence with increasing density of EGMs, one of the predictions of the
adaption thesis. These findings indicate that policies related to restricting or
reducing the density of EGMs are likely to play a significant role in containing
or reducing gambling-related harms.
The finding of a decrease in prevalence of problem gamblers, at a rate of
0.09% per annum with EGM density held constant, is partially consistent with
the adaption thesis. It suggests that measures related to public education and
other community and individually based preventative or treatment programs
may be effective in reducing harm over time.
From the perspective of public policy, and particularly harm minimisation,
holding or reducing EGM numbers would appear prudent based on our
findings, and is likely to lead to reduced harm both through reduced availability
and by enabling adaption processes.
Issues with the Storer, Abbott and Stubbs (2009) Paper
53. The Storer, Abbott and Stubbs (2009) paper 40 is not based on any new survey, but is
simply a study of studies. The paper reviewed 34 previous Australian and New Zealand
surveys conducted between 1991 and 2007. Only five of the studies were New
Zealand-based.
54. The Australian data is not directly comparable to the New Zealand data because
Australian machines are operated commercially by the venue operators (i.e. operated
for personal profit).
39
John Storer, Max Abbott & Judith Stubbs (2009): Access or adaptation? A meta-analysis of surveys of problem
gambling prevalence in Australia and New Zealand with respect to concentration of electronic gaming machines,
International Gambling Studies, 9:3, 225-244 http://www.tandfonline.com/doi/pdf/10.1080/14459790903257981
40
John Storer, Max Abbott & Judith Stubbs (2009): Access or adaptation? A meta-analysis of surveys of problem
gambling prevalence in Australia and New Zealand with respect to concentration of electronic gaming machines,
International Gambling Studies, 9:3, 225-244 http://www.tandfonline.com/doi/pdf/10.1080/14459790903257981
2155. When the New Zealand data is looked at in isolation (Figure 4 on page 230) as per the
table below, and compared with the number of gaming machines in New Zealand, the
relationship between harm and machine numbers appears to be inverse.
Gaming Machine Numbers
30,000
25,000
25,221
20,000 23,002 22,231
21,34320,518
20,097 19,739
15,000 17,150
10,000 13,27313,812
12,201
11,031
9,286
5,000 8,160
6,273
0
1991
1992
1993
1994
1995
1996
1997
1998
1999
2000
2001
2002
2003
2004
2005
2006
2007
Gaming Machine Numbers
Allen & Clark 2012
56. In July 2012, Allen and Clark presented a report to the Ministry of Health titled Informing
the 2012 Gambling Harm Needs Assessment. 41 The report concluded that a reduction
in the opportunities to gamble had not resulted in any corresponding reduction in
moderate to high risk problem gambling. The report stated on page 6:
There has been a significant decline in gambling participation rates and
opportunities to gamble, but no change in the prevalence rate of gamblers at
moderate to high risk of problem gambling.
41
http://www.health.govt.nz/system/files/documents/publications/gambling-harm-report-jul2012.pdf
22Burden of Harm Report
57. In May 2017, a report titled Measuring the Burden of Gambling Harm was produced
for the Ministry of Health. In the report, “low risk” gambling such as buying a Lotto
ticket, was claimed to be as bad for a gambler’s health as the untreated amputation of
a leg, while “problem gambling” was claimed to be as bad as suffering from a severe
stroke or terminal cancer.
58. A review of the study’s methodology produced by TDB Advisory 42 concludes that these
outlandish comparisons were made possible by a long line of deliberate selection
biases and errors. The errors revealed by the TDB Advisory review include either
deliberately or by mistake using a biased population sample (participants were not
randomly selected), attributing all harms to gambling and none to associated
behaviours (such as smoking), and treating all harm as running 100% from gambling
rather than calculating for the use of gambling as a coping mechanism or as a symptom
of harms rather than the cause.
59. The Gaming Machine Association has called for the report to be officially withdrawn,
or to be subject to an official warning against its use.
A Concern with How Gamblers Spend their Disposable Income
60. The Salvation Army and Problem Gambling Foundation recently released a report
commissioned from the New Zealand Institute of Economic Research suggesting that
there would be significant economic benefit to the retail sector in both income and job
creation if spending on gambling was halted. The report claims that this extra retail
spending would generate an additional 1,127 full-time equivalent jobs for 1,724
workers, along with an additional $58m of GST revenue and additional income tax of
$7m from the retail spend.
61. The report, however, fails to take into consideration the economic value currently
generated by the gambling sector. The report specifically acknowledges that this was
outside its scope. It is therefore a misrepresentation of the net value of such a move,
given that it takes no account of the value that would be lost. What the Salvation Army
and Problem Gambling Foundation appear to be saying is: let’s take money – and jobs
– away from the charity and not for profit sectors – health and rescue, education,
community and social support services, environment, and arts and heritage – and give
it to the commercial sector.
62. A suggestion is also made that the increased retail spending would then result in the
retail sector channelling its increased profits into things like sports sponsorship. It is,
however, more likely that any increased profits from the retail spending would be
retained by the business owners, many of whom are large corporates, based offshore.
63. The report fails to address the freedom of adult New Zealanders to do what they want
with their discretionary spending. Ministry of Health data indicates that over 1.8 million
adult New Zealanders enjoy spending their money on gaming machines, Lotto, Instant
Kiwi, sports and track betting and other forms of gambling. That spending provides
them with entertainment, relaxation, and social interaction. Those benefits would be
lost if people were not able to spend their money on gambling.
42
http://www.gamblinglaw.co.nz/download/TDB_Advisory_Report.pdf
23The “Costs of the System”
64. The Problem Gambling Foundation have also recently suggested that 60% of the
revenue from gaming machines goes towards the costs of running the system (with
the remaining 40% being the returns to the community). In fact, the community benefit
is much more like 80%, with the approximately 40% share that makes up the various
taxes, duties and GST in effect also being a community contribution, going into the
public purse to contribute to public good. The actual ‘running of the system’ is only
about 20%. This 20% represents money to businesses – local hospitality businesses,
trusts, equipment providers and technicians – and a significant number of jobs in our
cities, towns and communities
Internet Gambling and Mobile Phone Gambling
65. The only organisations that are able to conduct remote interactive gambling (such as
gambling via the internet and mobile phones) within New Zealand are the New Zealand
Racing Board and the New Zealand Lotteries Commission. While it is illegal to
advertise overseas gambling in New Zealand, it is not illegal to participate in gambling
on an overseas-based website or to gamble on overseas competitions and games.
66. It only requires a simple search and a few minutes to download to your computer, tablet
or mobile phone an exact replica of the gaming machine programs currently available
in New Zealand venues.
67. Organisations like Pokerstars, Jackpot City, Spin Palace and GrandReef.TV work
around New Zealand’s prohibition on advertising overseas-based online gambling by
advertising a sister website that uses only play money. However, a Google search of
the brand name, such as a Google search of GrandReef.TV leads you to
grandreefcasino.com, a website that describes itself as Australia & New Zealand’s
#1 online casino. This website allows you to use play money or to gamble using real
money. The inducement to deposit funds and gamble is strong, with up to 100%
matching bonuses for initial deposits. Below is the first result that shows in a Google
search for “GrandReef.TV”
1. Grand Reef Casino - Australia & New Zealand's #1 online casino
www.grandreefcasino.com/
Block all www.grandreefcasino.com results
Play the best online games at Grand Reef. Get a $750 ... Welcome to
Grand Reef Online Casino. We are ... Grand Reef Casino is a partner site
of grandreef.tv.
Free Pokie Games - Getting Started - Games - About us
2468. The prohibition on advertising can also be averted by overseas-based gambling
providers sponsoring overseas sporting teams and sporting venues. The logos of
overseas-based gambling providers are painted on overseas sporting pitches and
appear on side-line billboards. These are visible in New Zealand sporting broadcasts.
69. There is no question that New Zealanders love gambling online. The Lotteries
Commission reported in its 2017/18 Annual Report that online sales accounted for 16
per cent of its total sales ($201.1m), compared with 13 per cent the previous year.
70. The New Zealand Racing Board noted in its latest six-monthly report that online
channels made up 59.2 per cent of its betting turnover, up 2.2 percentage points on
last year. It also said that its online platforms were the fastest-growing channels.
71. SkyCity has launched an offshore-based online casino with a large selection of gaming
machine games.
2572. A September 2018 Cabinet paper 43 on online gambling cites research suggesting that
New Zealanders gambled approximately $300 million with offshore providers in 2017,
with the market growing annually at between 12 and 20 per cent.
73. The Cabinet paper notes that health professionals and gambling harm treatment
providers have expressed concern that online gambling may be more harmful than
some existing forms of gambling. The paper continues by stating “It [online gambling]
has the potential to drive changes in behaviour to a greater, and more harmful, extent
than some land-based gambling.”
74. TAB New Zealand estimates that the total online spend with offshore gambling
websites by New Zealanders for the 12 months to August 2020 was $570-$580m.
75. Offshore-based online gambling poses considerable risks because it:
a. Is highly accessible, being available 24 hours a day from the comfort and
privacy of your home;
b. Has no restrictions on bet sizes;
c. Has no capacity for venue staff to observe and assist people in trouble;
d. Reaches new groups of people who may be vulnerable to the medium;
e. Provides no guaranteed return to players;
f. Is more easily abused by minors;
g. Has reduced protections to prevent fraud, money laundering or unfair gambling
practices; and
h. Is unregulated, so on-line gamblers are often encouraged to gamble more by
being offered inducements or by being offered the opportunity to gamble on
credit. For example, many overseas sites offer sizable cash bonuses to a
customer’s account for each friend that they induce to also open an account
and deposit funds.
76. Offshore-based online gambling does not generate any community funding for New
Zealanders, does not generate any tax revenue for the New Zealand Government and
does not make any contribution to the New Zealand health and treatment services as
no contribution is made to the problem gambling levy.
Problem Gambling Foundation Statement - “40% of EMG Spending is Attributable to
Problem Gamblers”
77. The 2010 Australian Government Productivity Commission Report 44 estimated that
problem gamblers’ share of the total spending on gaming machines was approximately
40%. This was based on Australian research. No New Zealand study supports this
claim. The Australian gambling environment is very different to the New Zealand
gambling environment. The Australian gaming machines provide much larger prizes.
43
http://www.gamblinglaw.co.nz/download/Online_gambling_Cabinet_paper.pdf
44
http://www.pc.gov.au/projects/inquiry/gambling-2009/report
26The Australian machines are also operated by commercial venues for commercial
profit.
78. Further, in the 2011 research paper Gambling away perspective? A review of the
evidence justifying electronic gaming regulations 45 the Productivity Commission’s
findings were questioned. The authors of the research suggested that the spending
by problem gamblers was in fact between 10% and 20%. The paper stated:
The Productivity Commission in 2010 released a report into the gambling
industries, including the prevalence of problem gambling and levels of
expenditure on electronic gaming machines (EGMs) by problem gamblers.
Based on state surveys from 2001 to 2009, the Commission estimated that
between 80,000 and 159,000 Australian adults are afflicted by problem
gambling.
On the basis of the numbers of problem gamblers playing EGMs more than
weekly, the Commission also estimated that 41 per cent of EGM spending was
attributable to problem gamblers.
However the Commission’s estimates appear to have overestimated the
problem gambling profile in Australia.
The published estimates did not appear to adjust the differences in the adult
population between states or the varying number of EGMs available in each
jurisdiction.
Outdated data was used by the Commission to estimate the prevalence of
problem gambling; using the latest data shows a lower figure, about 75,300
problem gamblers in Australia. This is about 35 per cent lower than the
Commission’s average estimate of problem gambler numbers.
Based on Commission’s analysis that between 75 per cent and 80 per cent of
problem gamblers use EGMs, this reduces the numbers of EGM problem
gamblers to between 57,000 and 60,000 people.
Based on total expenditure on EGMs in Australian the implied share of
spending by problem gamblers would in fact appear to be between 10 and 20
per cent, and not the 41 per cent estimated by the Commission.
Problem Gambling Foundation Statement - “One Extra Machine Leads to Nearly One
New Problem Gambler”
79. PGF’s March 2017 fact sheet 46 states that a recent New Zealand study found that there
is an increase of problem gambling by nearly one person per each new machine. The
reference cited is Abbott, Storer & Stubbs (2009). 47
45
http://ipa.org.au/library/publication/1320067559_document_novak_wilson_gamblingaway
perspective.pdf
46
http://www.pgfnz.org.nz/Uploads/Library/01NZGam.pdf
47
John Storer, Max Abbott & Judith Stubbs (2009): Access or adaptation? A meta-analysis of surveys of problem
gambling prevalence in Australia and New Zealand with respect to concentration of electronic gaming machines,
International Gambling Studies, 9:3, 225-244 http://www.tandfonline.com/doi/pdf/
10.1080/14459790903257981
2780. At page 241 of Abbott, Storer & Stubbs (2009) 48 the authors state:
It is likely that both access and adaption forces are at work simultaneously,
with varying implications for policy. First, there is strong support from the
present findings for the access thesis, with strong statistically meaningful
relationships between an increase in problem gambling prevalence and
increasing per capita density of EGMs, at an average increase of 0.8 problem
gamblers for each new EGM. Further, there is no evidence of plateauing of
prevalence with increasing density of EGMs, one of the predictions of the
adaption thesis. These findings indicate that policies related to restricting or
reducing the density of EGMs are likely to play a significant role in containing
or reducing gambling-related harms.
81. As set out above there are concerns with the 2009 study. The study was not a new
survey, but an analysis of the data from previous New Zealand and Australian surveys.
When the New Zealand data is viewed in isolation and compared with the number of
gaming machines in New Zealand, the relationship between harm and machine
numbers appears to be inverse.
82. The only time that one new gaming machine would equate to one new problem
gambler is when a gaming machine is introduced into an area that did not previously
have any machines. Given that gaming machines exist in all parts of New Zealand,
the theory is unlikely to have any practical application.
83. On 18 April 2012 Professor Max Abbott was interviewed by Radio New Zealand.
Professor Abbott said that he could not make a firm prediction about the increase in
harm from new machines, stating:
…the issue of increasing or decreasing machines is actually more complicated
than people might think because you do get adaptation over time, you can get
a saturation effect, and also we have so many machines in this country that
you would probably have to reduce them by quite a large number before you
had an impact…
Can we say and I’m not sure which of you wishes to answer this one, can we
say categorically that an increase in the number of machines say by 350 which
seems to be the common figure people are using, is going to significantly
increase harm, what some of your research seems to be saying, if its 1 person
per machine that you’re going to get the ratio with, is that 350 more problem
gamblers again, is it that simplistic?
Well its difficult, I couldn’t make a firm prediction to be honest, that’s from
studies carried out over a 20 year period, yes that was the average effect over
that time period and the relationship is a stronger one when these machines
were first being introduced and people hadn’t been exposed to them before.
Problem Gambling Foundation Statement “Gaming Machines Are Designed to be
Addictive”
84. The allegation that gaming machines are designed to be addictive was recently tested
in the Australian Federal Court in the case Guy v Crown Melbourne Ltd. 49 The Court
48
John Storer, Max Abbott & Judith Stubbs (2009): Access or adaptation? A meta-analysis of surveys of problem
gambling prevalence in Australia and New Zealand with respect to concentration of electronic gaming machines,
International Gambling Studies, 9:3, 225-244 http://www.tandfonline.com/doi/pdf/
10.1080/14459790903257981
49
Guy v Crown Melbourne Ltd (No2) [2018] FCA 36
28found that there was no evidence that gaming machines are designed to be addictive.
In fact, all aspects of the machines, including items such as how fast the reels may
spin, are highly regulated and controlled.
85. In 2 February 2018, the Federal Court of Australia dismissed claims of misleading and
deceptive conduct and also unconscionable conduct against Crown Casino Melbourne
and Aristocrat (a gaming machine manufacturer). The case related to the design and
use of the Dolphin Treasure gaming machine.
86. The Australian/New Zealand Gaming Machine National Standards set out criteria all
gaming machines must meet in order to be approved to operate in New Zealand. The
standards provide that a game:
• Must not give the player a false expectation of better odds: standard 3.3.
• Must not be misleading, illusory or deceptive – such as a near-miss design:
standard 3.3.
• Must not manipulate or rearrange the reel’s symbols: standard 4.8.
Problem Gambling Services
Problem Gambling Treatment and Research Funding
87. The 2011 KPMG report Value for Money review of problem gambling services 50 states:
The problem gambling levy recognises the gambling industry taking
responsibility. The costs of problem gambling services are recovered through
the problem gambling levy and are not funded by the taxpayer. They are
fiscally neutral to the government. In this way the levy equals the spend on
problem gambling services. The gambling industry viewed the funding model
for problem gambling services as a positive recognition of their corporate social
responsibilities. Collaboration across key stakeholders in this sector is a
foundation to working together to efficiently and effectively help those in need.
88. All gaming machine societies since 2004 have been required to contribute to a problem
gambling fund. This fund provides approximately $18,500,000.00 per annum to the
Ministry of Health to support and treat gambling addiction and to increase public
awareness. The funding is ring-fenced and cannot be redirected to other health areas.
Problem Gambling Treatment Services are Extensive
89. A 24 hour, 365 day per year problem gambling helpline is available. Free, confidential
help is available in 40 languages including: Amharic, Arabic, Assyrian, Bengali,
Bosnian, Cantonese, Cook Island Maori, Croatian, Dari, Farsi, French, Gujarati, Hindi,
Japanese, Khmer, Korean, Kurdish, Lao, Mandarin, Maori, Myanmar, Nepali, Niuean,
Pashto, Portuguese, Punjabi, Russian, Samoan, Serbian, Sinhalese, Somali, Spanish,
Taiwanese, Tamil, Thai, Tokelauan, Tongan, Tuvaluan, Ukrainian, Urdu, and
Vietnamese.
90. Free face-to-face counselling is also available and specialist counselling is available
for Maori, Pacifica and Asian clients. An anonymous, free text service (8006) is
available. Support via email is also available (help@pgfnz.org.nz).
50
Value for Money review of problem gambling services
http://www.health.govt.nz/system/files/documents/publications/vfm-report-final_1.pdf
29You can also read