Eastern Waikato Draft Waste Management and Minimisation Plan - CONSULTATION DRAFT Hauraki District Council Matamata-Piako District Council ...
←
→
Page content transcription
If your browser does not render page correctly, please read the page content below
Eastern Waikato Draft
Waste Management and
Minimisation Plan

Hauraki District Council
Matamata-Piako District Council
Thames-Coromandel District Council

CONSULTATION DRAFT

October 2011
Eastern Waikato Draft Waste Management and Minimisation Plan 2011
                                             ii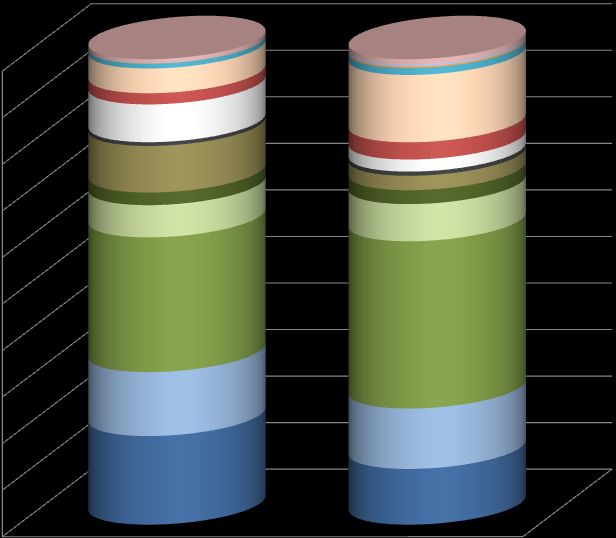
Foreword
This document is the draft Waste Management and Minimisation Plan. It has been
prepared in discussion with the Eastern Waikato communities, and has now been
released for general consultation and feedback.
Managing waste within our districts is an important Council responsibility. In recent
years there have been a number of developments at the national level and within the
industry that mean we need to think more carefully than ever about how we manage
our waste and resources. National legislation, including the Waste Minimisation Act
and the NZ Emissions Trading Scheme mean that the cost of landfilling our waste is
likely to increase in the future. In addition, the waste industry is increasingly able to
offer new and better ways of reclaiming our wasted resources, meaning we have
more options as to how we manage our waste.
While we have been recycling and recovering more and more of our waste, there is
more we can still do, and it will be important to make sure we do this in ways that are
efficient and that benefit our communities as well as the environment.
Each Council is required under the Waste Minimisation Act to produce a Waste
Management and Minimisation Plan, which shows how they plan to manage their
waste. The Act also allows Councils to join together in waste planning. The three East
Waikato Councils, Hauraki, Matamata-Piako and Thames-Coromandel, believe there
are likely to be some real benefits in working together and have agreed to produce a
Draft Joint Waste Management and Minimisation Plan.
This Plan describes how we currently manage our waste in each of the three districts ,
how the Councils suggest our communities should manage our waste in the future,
and what we can all do to make this happen. Council wants to hear what you think of
the draft Plan, and whether you agree with our ideas and proposals.
Once the Councils have heard the community‟s views on this draft, any changes
necessary will be made and the final Plan will be confirmed by Council. We will all
then begin the task of implementing the various actions that have been agreed. In
some cases, this will mean the community will be heavily involved; in other cases
actions may be the sole responsibility of Council.
As you read through this document, questions will prompt you to consider certain
issues. Council would like to hear your views on these questions, and any other
issues you wish to raise. Your views can be submitted in writing, and you will also
have the opportunity to discuss your views with Council following the close of the
submission period.
                                                          Signed – mayors/chief execs?

                                          iii
Contents
Part A – Strategy ............................................................................................................ 1
Introduction .................................................................................................................... 1
Why Work Together?........................................................................................................ 1
What Does the Plan Have to Contain? ........................................................................... 1
Structure of the Plan ....................................................................................................... 2
Timeframes and Review of Plan ..................................................................................... 2
Community Input ............................................................................................................. 2
What is Waste? ................................................................................................................ 3
The Waste Hierarchy ....................................................................................................... 4
Vision, Goals, Objectives and Targets ............................................................................ 5
Vision ................................................................................................................................ 5
Our Goals and Objectives ................................................................................................ 5
Our Targets ....................................................................................................................... 6
Waste Minimisation ..................................................................................................... 6
Other Targets ................................................................................................................ 8
Councils‟ Role .................................................................................................................. 9
Other Policies and Plans .............................................................................................. 11
The New Zealand Waste Strategy................................................................................ 11
Waikato Regional Policy Statement ............................................................................. 11
Regional Waste Management Plan .............................................................................. 11
Local Plans and Goals .................................................................................................. 11
Other National Legislation ............................................................................................ 11
The Waste Problem ...................................................................................................... 13
Existing Services and Facilities .................................................................................... 17
Funding of Solid Waste Services ................................................................................. 19
Seasonal Issues ............................................................................................................ 19
Forecasts of Future Demand ....................................................................................... 20
The Waste Minimisation Act 2008 .......................................................................... 21
Increased Costs of Disposal ..................................................................................... 21
Population and Household Growth .......................................................................... 21
Markets ...................................................................................................................... 21
Public Health ................................................................................................................. 22
Management of Public Health Issues ...................................................................... 22
Grants ............................................................................................................................ 23
The Key Issues ............................................................................................................. 23
Means of Implementation and Funding ...................................................................... 24
Part B – Action Plans .................................................................................................... 25
Introduction .................................................................................................................. 25
Eastern Waikato Draft Waste Management and Minimisation Plan 2011
ivSummary of Proposed Actions ..................................................................................... 26
C: Cross-Service Joint Actions ...................................................................................... 28
C.1 Waste Policy, Planning and Coordination ......................................................... 28
C.2 Procurement and Contract Administration ....................................................... 28
C.3 Liaison, Communication, Education and Consultation .................................... 29
C.4 Development and Enforcement of Solid Waste Bylaws ................................... 30
C.5 Monitoring and Reporting .................................................................................. 31
S: Shared Services ........................................................................................................ 33
S.1 Kerbside Services ............................................................................................... 33
S.2 Drop off Services ................................................................................................. 36
S.3 Transfer Stations................................................................................................. 37
S.4. Processing and Treatment ................................................................................ 39
S.5 Transport ............................................................................................................. 40
S.6 Disposal ............................................................................................................... 40
I: Independent Services ................................................................................................ 41
I.1 Hauraki District Council ....................................................................................... 41
I.2 Matamata-Piako District Council......................................................................... 43
I.3 Thames-Coromandel District Council ................................................................. 44
Summary Tables: .......................................................................................................... 46
Strategic Goals .......................................................................................................... 46
Hierarchy .................................................................................................................... 49
Waste Streams .......................................................................................................... 52
Part C – Supporting Information .................................................................................. 57
Introduction ................................................................................................................... 57
A.1.0 Statement of Funding Policy............................................................................ 58
How the Implementation of the Plan is to be Funded ................................................ 58
Waste Minimisation Levy Funding Expenditure .......................................................... 59
Grants ............................................................................................................................ 59
A.2.0 Targets ............................................................................................................. 60
Overall Targets for East Waikato by Year (tonnes) ..................................................... 60
Hauraki District Targets by Year (tonnes) .................................................................... 60
Matamata-Piako District Targets by Year (tonnes) ..................................................... 61
Thames-Coromandel District Targets by Year (tonnes) .............................................. 61
Per Capita versus Per Household Measurements ...................................................... 61
A.3.0 Legislation ....................................................................................................... 63
Waste Minimisation Act ............................................................................................ 63
Climate Change (Emissions Trading) Amendment Act 2008 (ETS) ....................... 64
Health Act 1956 ........................................................................................................ 65
The Resource Management Act 1991 (RMA) ......................................................... 65
The Hazardous Substances and New Organisms Act 1996 (the HSNO Act) ........ 66
A.4.0 Local Plans and Goals ..................................................................................... 67
Hauraki District Council ................................................................................................ 67
Waste Management Plan 2002 ............................................................................... 67
vHauraki Community Plan .......................................................................................... 67
Hauraki District Council Solid Waste Asset Management Plan (September 2009)
.................................................................................................................................... 67
Hauraki District Council District Plan ....................................................................... 67
Matamata-Piako District Council ................................................................................. 68
Waste Minimisation Strategy ................................................................................... 68
Matamata-Piako District Council District Plan ........................................................ 68
Thames-Coromandel District Council .......................................................................... 68
Solid Waste Asset Management Plan for the Thames-Coromandel District Council
(April 2006)................................................................................................................ 68
Thames-Coromandel District Council 2009-2019 Ten Year Plan ......................... 69
Thames-Coromandel District Council 2010/2011 Annual Plan ........................... 69
Thames-Coromandel District Council District Plan ................................................. 70
A.5.0 Definitions and Abbreviations ......................................................................... 71
Waste Hierarchy: ........................................................................................................... 71
Other Definitions and Abbreviations ........................................................................... 71
A.6.0 Waste Assessment .......................................................................................... 73
Eastern Waikato Draft Waste Management and Minimisation Plan 2011
viPart A – Strategy
Introduction
Why Work Together?
Each of our Councils is required to produce a Waste Management and Minimisation
Plan (WMMP) under the Waste Minimisation Act (2008). The Act also allows councils
to work together to produce a „Joint Waste Management and Minimisation Plan‟.
Currently the East Waikato Councils all share the same service provider for our refuse
and recycling collections and offer similar services to residents and visitors to the
districts. The Councils have agreed that there are likely to be a number of benefits in
working together more closely on waste issues and preparing a Joint Waste
Management and Minimisation Plan. These include:
Potential efficiencies and cost savings from sharing collection services,
including improved ability to optimise fleets, depot locations and collection
rounds
Potential efficiencies and cost savings from sharing administration,
communications and support services
Encouraging more competitive bids from the private sector contractors for
supply of collection, transfer station operation, haulage and disposal services
across the three districts
More consistent standards and service levels across the districts.
If we plan well, joint working should lead to higher quality and more efficient services
for waste and recycling, including increased waste minimisation.
What Does the Plan Have to Contain?
The WMMP must meet requirements set out in the Waste Minimisation Act, including:
Consider the „Waste Hierarchy‟
Ensure waste does not create a „nuisance‟
“Have regard to” the New Zealand Waste Strategy and other key government
policies
Consider the outcomes of the „Waste Assessment‟ (this is a review of all
information that we have about the current waste situation in East Waikato,
including rubbish from households and businesses)
Follow the Special Consultative Procedure set out in the Local Government Act
(2002).
1Structure of the Plan
This plan is in three parts
Part A: Strategy: This contains the core elements of the strategy including vision,
goals, objectives, policies and targets. It essentially sets out what we are aiming to
achieve, and the broad framework for working towards the vision.
Part B: Action Plans. The action plans set out the proposed specific actions to be
taken by the three Councils to achieve the goals, objectives, and targets set out in
Part A. Most of the actions identified will be undertaken jointly across the three
Councils. Specific actions that do not apply to all three Councils are identified in
separate action plans for each Council.
Part C: Background Information. This part contains the background information that
has informed the development of the WMMP. Most of this information is contained in
the Waste Assessment, which is included in Part C.
Timeframes and Review of Plan
This plan considers the waste management requirements of the region for the next
10 years. This time horizon is consistent with the Councils‟ Long Term Plans (formerly
Long Term Council Community Plan), which have a 10 year timeframe.
In line with the requirement of section 50 of the Act, this Plan will be reviewed at least
every six years after its adoption. The Councils may elect to review any or all aspects
of the Plan at any time prior to 2018, if they consider circumstances justify such a
review.
Any review will be preceded by a waste assessment under section 51 of the Act. A
review may not necessarily lead to changes in the WMMP. Under the Act, any
proposed course of action following a review must be subject to consultation using
the special consultative procedure set out in section 83 of the Local Government Act.
Community Input
As this draft WMMP was written, previous Council Plans were reviewed, and these
have been taken into account in developing the new Plan.
Also, as part of putting together the Waste Assessment the Councils ran a number of
workshops to hear what key groups in the community, such as resident and
ratepayers groups, iwi, environmental groups, waste and recycling companies, and
council and community board representatives, thought. We have tried to reflect those
views in developing this draft WMMP.
This Draft Plan is now being presented to the community to hear your views. You can
make submissions at any time during the consultation process and, if you want to
speak to your submission, hearings will be held following the close of the submission
period. Once the Councils have heard the community‟s views on this draft WMMP, any
changes necessary will be made and our final WMMP will be confirmed by the
Councils in early 2012. We will all then begin the task of implementing the various
actions that have been agreed. In some cases, this will mean the community will be
heavily involved; in other cases actions may be the sole responsibility of Council.
Eastern Waikato Draft Waste Management and Minimisation Plan 2011
2What is Waste?
The Waste Minimisation Act defines waste as:
”material that has no further use and is disposed of or discarded”
The Act also describes „waste minimisation‟ as reducing waste and increasing the
reuse, recycling, and recovery of waste and diverted material. „Diverted material‟ is
anything that is no longer required for its original purpose, but still has value through
reuse or recycling. For example – your empty drink can is waste to you, but is worth
money to metal recycling companies and so becomes „diverted material‟ if it is
recycled.
In this WMMP, terms will be used like „rubbish‟, „recycling‟, and „waste‟ that may not
be familiar to you or may mean something different to the intended definition for this
document. Definitions for the various terms that have been used here are provided
at the back of this draft WMMP in Part C, section A.5.0.
Our Draft WMMP covers all solid waste and diverted material in the districts, whether
they are managed by the Councils or not. Liquid and gaseous wastes are not
included except where they interact with solid waste systems. This includes
hazardous wastes like chemicals and the outputs from wastewater treatment plants.
This does not necessarily mean that the Councils are going to have direct involvement
in the management of all waste – but there is a responsibility for the Councils to at
least consider all waste in their Districts, and to suggest areas where other groups,
such as businesses or householders, could take action themselves.
Question:
Do you agree with the Councils‟ suggestion for what will be included in this Plan and
what will be managed through other policies?
3The Waste Hierarchy
For many reasons, it is important that we, the East Waikato communities, reduce the
amount of waste we are sending to landfill. The Waste Minimisation Act requires that
in preparing this plan we consider the „Waste Hierarchy‟. The „waste hierarchy‟ says
that we should first of all avoid creating waste (reduction), then, if waste is created,
we should reuse it, recycle it, recover it, or treat it (in descending order of preference).
If none of these can be done the final option is disposal. Definitions of these terms
are included in Part C section A.5.0.
The way waste is managed in East Waikato at the moment tends to look like this:
Figure 1: The Waste Hierarchy
Increasing
REDUCE amounts
of waste
REUSE
RECYCLE Increasing
economic, social
RECOVER and
(e.g. Composting) environmental
costs
TREATMENT
DISPOSAL
For us to improve our waste management practices, and reduce the amount we are
spending on managing waste, we need to „move up the hierarchy‟ and reverse this
situation so that it looks like this:
Figure 2: Revised Waste Hierarchy
REDUCE
Increasing
REUSE amounts
of waste
RECYCLE
Decreasing
RECOVER economic,
social and
environmental
TREATMENT
costs
DISPOSAL
This draft WMMP, and particularly the Action Plans, set out how we will move towards
this from the current situation.
Eastern Waikato Draft Waste Management and Minimisation Plan 2011
4Vision, Goals, Objectives and Targets
Vision
The vision represents what our overall aspirations are in respect of waste. The
proposed vision is simply:
“Minimise waste to landfill and maximise community benefit”
We believe this vision is clear, simple to understand and represents what we want to
try and achieve.
By focusing on minimising waste to landfill the vision encompasses the intent of the
waste hierarchy and the national goal of reducing harm. Similarly, by emphasising
community benefit the vision implies taking actions that will reduce cost, improve
resource efficiency, encourage local economic development and take care of human
and environmental health. This accounts for the national goal of resource efficiency,
and well as the requirements to protect human health.
These elements are developed further in the Proposed Goals and Objectives set by
the Councils:
Our Goals and Objectives
The joint Councils suggest in this draft WMMP some goals and objectives that the
East Waikato communities should be working towards. We have developed these
goals by thinking about what our local issues are, what the priorities are nationally
and for the districts together and what you have said previously about what you would
like the community to look like through the stakeholder consultation processes.
Goal: To actively promote waste reduction
Objective: To work at a national level with other organisations, including
territorial and regional councils, to actively promote waste reduction
Objective: To work with local businesses and organisations to actively promote
waste reduction at a local level
Goal: Work together to optimise opportunities
Objective: To investigate and develop joint working and co-operation across
territorial and regional councils including shared services
Objective: To investigate and develop private and community sector
partnerships and arrangements which contribute positively to the WMMP‟s
vision and goals
Goal: To manage waste services in the most cost-effective manner
Objective: To work with service providers to identify efficiencies while
maintaining or improving service levels
Objective: To consider both short and long term cost impacts of all actions
5Goal: To increase economic benefit by using materials more efficiently
Objective: To identify opportunities to reduce waste generation and recover
materials from the waste stream
Objective: To look for opportunities to recover the value of waste materials
locally
Goal: To minimise harm to the environment
Objective: Consider the environmental impact of all options and ensure that
the overall environmental impact is taken into account in decision making
Goal: To protect public health
Objective: To consider the public health impacts of all waste management
options and seek to choose options which effectively protect human health
Goal: To collect information to enable informed decision making
Objective: To take actions that will improve information on waste and
recovered material activities in the districts, including both Council-contracted
and private sector activities
Objective: To align data collection and reporting systems across the three
districts
Our Targets
Waste Minimisation
There are a number of targets that are important in measuring our performance. The
key targets that relate to achieving our vision of minimising waste to landfill are waste
reduction targets.
The Councils have agreed a method for setting targets based on the expected
performance of specific initiatives that are planned as part of this WMMP.
Using this method we can accurately plan for how much diversion we expect based on
the actions we plan to take. For example if we plan to improve our recycling systems,
we can make estimates of the amount of material we will take out of the rubbish and
when we expect that to happen. These estimates then become part of the target for
what we want to achieve for that year.
Because this plan is in draft form, and we have not agreed all the actions that we
want to take yet, the targets we have set out here are indicative only and will change
if, based on the outcomes of the consultation, we decide to do different things to
those that have been proposed.
We have decided to set targets on the basis of all waste that goes to landfill –
whether it is collected by the council or by the private sector and including all waste
from households, businesses, and other organisations. This gives us the best overall
picture of what is happening with waste in our districts, and will help us be sure we
really are minimising waste to landfill, and that it is not just being collected and
landfilled by someone else.
Eastern Waikato Draft Waste Management and Minimisation Plan 2011
6The targets are expressed as the amount of waste we send to landfill per household
or per capita1. Expressing the target in this way, instead of, for example, a recycling
rate, means we can take proper account of waste reduction (such as people using
less packaging or doing more home composting), and the target is easy to measure
over time as it takes account of growth over time.
At present the quantities of all waste we send to landfill per household and per
person each year are shown in the following table:
Table 1: Per Household and Per Capita Waste to Landfill by District
Per Household Per Capita
Hauraki 611 kg 351 kg
Matamata-Piako 933 kg 420 kg
Thames-Coromandel 757 kg 695 kg
Combined 778 kg 499 kg
Over the next 10 years we estimate we can take actions that will reduce the amount
each person and household sends to landfill to the following:
*Remember these figures are not just what each household or individual throws out, but also
includes waste from businesses, farms, and Council activities such as parks and waste water
treatment.
Table 2: Targets for Per Household and Per Capita Waste to Landfill by District
Per Household Per Capita
Hauraki 333 kg 191 kg
Matamata-Piako 541 kg 243 kg
Thames-Coromandel 399 kg 349 kg
Combined 418 kg 268 kg
These are our proposed overall targets for the WMMP.
The planned initiatives result in us almost halving the amount of waste we send to
landfill compared to current levels.
1Refer to Part C, section A.2.0 for a discussion of the differences between per capita and per
household targets.
7The table below shows the key initiatives that we plan to consider over the next 10
years and how they contribute to achieving the targets.
Table 3: Contribution of Key Initiatives to Targets
Estimated Kg diverted per Kg diverted per
tonnes diverted household person
per year
Total current waste to landfill 37,467 778 499
Improved kerbside recycling 2,852 59 38
Garden waste collection 1,837 38 24
Biosolids composting 1,590 33 21
Food waste collection 3,831 80 51
Commercial recycling 1,821 38 24
Construction & Demolition
waste recycling 3,457 72 46
Reuse stores 1,381 29 18
Plastic bag recycling 303 6 4
Nappy composting 282 6 4
Other 2 0 0
Total Diverted 17,358 361 231
Remaining waste to landfill 20,109 418 268
It should be noted that, in addition to the actions set out in the table, there are other
initiatives that are planned that do not directly result in waste reduction but that are
critical and that support the key initiatives. These include, for example, promoting
waste reduction, communication and education, bylaws, and monitoring and
enforcement. Part B of the WMMP sets out the actions that are planned.
Part C section A.5.0 sets out the proposed specific targets in more detail including
overall targets and targets for each Council each year
Other Targets
Council may set other targets to monitor the effectiveness of this plan. These could
include:
Service level targets (e.g. frequency of collections)
Ratepayer satisfaction
Service delivery targets (e.g. missed collections etc)
It is expected that these targets will be set and monitored through the contract
process.
Eastern Waikato Draft Waste Management and Minimisation Plan 2011
8Councils‟ Role
The Councils currently play a key role in waste management, both by providing
collection services and by providing facilities for transferring and transporting waste
to landfill disposal.
Therefore we propose that, in general, our involvement in delivering most of the goals,
objectives and targets is going to be fairly high – either the Councils will be the „lead
agency‟ in delivering actions and achieving targets, or the Councils will be a joint lead
or key supporting agency in working with the community.
The Councils cannot achieve the goals and targets set out here alone. Succeeding
will mean Council and the community working together, and everyone in the
community taking responsibility and doing their bit to manage waste better. The
Councils‟ specific proposed roles are explained for each action in Part B – Action Plan.
In terms of the Councils‟ specific role, we intend to put in place a range of activities to
achieve effective and efficient waste management and minimisation across the three
districts. The most important means through which the Councils‟ role will be carried
out will be through joint contracting of waste management and recycling services.
Exactly which services we will procure together has not yet been determined; however
the following services are likely to be included:
Kerbside collection of household refuse
Kerbside collection of household recyclables
Transfer station operation
Servicing of rubbish and recycling drop off points
Transport of waste to disposal
Transport of recyclables to processing
Monitoring and reporting of waste data
Disposal of waste to landfill
In addition the following elements may be included in a joint procurement:
Sorting and processing of recyclables
Kerbside collection of food waste
User pays kerbside collection of garden waste
Composting of organic wastes
Separation and resale of reusable items
Education and communication
Bylaw enforcement
Joint working arrangements are also expected to cover a range of activities including:
Waste policy and planning
Procurement
Contract administration
9 Communication and education
Development and enforcement of solid waste bylaws
Monitoring and reporting of performance against waste management and
minimisation objectives
It is expected that the Councils will do this through the development of appropriate
joint structures with delegated authorities for waste management. The joint working
arrangements will be responsible for a range of contracts and programmes to provide
waste management and minimisation services to the residents and ratepayers of the
three districts. Once the objectives of the joint working have been agreed, the mix of
services to be jointly procured may change from that shown above.
In addition individual Councils may make their own arrangements for services not
covered by the joint arrangements. These services may include:
Servicing of litter bins
Servicing of public place recycling bins
Clearance of illegal dumping
Street litter
Transport and treatment/disposal of sewage sludge
Questions:
Do you agree with the proposed Vision and understand it?
Do you agree with the proposed Goals and Objectives? Is anything missing?
Do you agree with the proposed Targets?
Do you agree with Council‟s suggested role in waste management?
Eastern Waikato Draft Waste Management and Minimisation Plan 2011
10Other Policies and Plans
When preparing our WMMP, Councils must consider other policies, plans, and
legislation that might affect how we manage our waste. We have considered the
following when preparing this draft WMMP:
The New Zealand Waste Strategy
The revised New Zealand Waste Strategy was released in October 2010. The strategy
puts forward two overarching goals. These are:
1. Reducing the harmful effects of waste
2. Improving the efficiency of resource use
The intent of the 2010 strategy is to enable a flexible approach to waste
management, encourage development of locally-appropriate targets and solutions,
and to efficiently allocate waste management and minimisation effort and resources.
The promotion of these two overarching goals provides a useful measure against
which to evaluate the objectives of a Waste Management and Minimisation Plan – in
other words: to what extent do the proposed initiatives in the plan reduce the harmful
effects of waste and improve the efficiency of resource use?
The harmful effects of waste can be managed by reducing the quantities of waste and
by improving management of potentially hazardous wastes.
Similarly the efficiency of resource use can be improved through waste prevention
and through reuse, recycling and recovery of materials.
Waikato Regional Policy Statement
The Waikato Regional Policy Statement contains the following objective in respect of
waste:
“The efficient use of resources and a reduction in the quantities of wastes
requiring disposal in the Waikato region, and the adverse effects associated
with their generation and disposal.”
Regional Waste Management Plan
The Waikato Regional Council is currently revising its Waste Management Plan.
Local Plans and Goals
In addition we have also considered the goals and objectives of each of the three
Councils‟ existing waste management plans and Long Term Plans. These are
contained in Part C, section A.4.0.
Other National Legislation
In addition to the Waste Minimisation Act and New Zealand Waste Strategy (which are
discussed above), other key legislation that has been considered in the preparation of
this plan includes:
11 Local Government Act 2002 (LGA);
Hazardous Substances and New Organisms Act 1996 (HSNO);
Resource Management Act 1991 (RMA);
Health Act 1956; and
Climate Change (Emissions Trading) Amendment Act 2008.
Taken together, these provide the legislative imperative and tools for managing and
minimising waste in New Zealand. Part C, section A.3.0 provides a summary of these
key Acts, and their relevance to the WMMP
Question:
Are there other plans, policies, or legislation that you believe should be considered in
this Plan?
Eastern Waikato Draft Waste Management and Minimisation Plan 2011
12The Waste Problem
The three districts together send approximately 37,500 tonnes of rubbish to landfill
each year, while we recycle and compost about half as much – nearly 17,000 tonnes.
The table below shows how much each of the districts sends to landfill and recycle.
Table 4: Tonnes of Rubbish and Recycling by Council
TCDC HDC MPDC Combined
Total rubbish 18,028 6,202 13,234 37,464
Total recycling 11,366 2,230 3,111 16,707
Total 29,394 8432 16345 54,171
Percent recycled/composted 39% 26% 19% 31%
The waste and recycling is managed in different ways – some comes from households
and is picked up as part of the Council collections, other waste is taken to transfer
stations or direct to landfill. The chart below shows some of the key waste flows for
each of the districts.
Figure 3: Waste Streams by Council
100%
90%
80%
70%
60%
50%
40%
30%
20%
10%
0%
TCDC HDC MPDC
Transfer station greenwaste 3,300 241 822
Transfer station & drop off recycling 5,294 1,129 430
Kerbside recycling 2,772 860 1,859
Waste direct to landfill 4,467 1,758 3,929
Landfill waste from transfer stations 9,404 1,958 4,134
Private kerbside rubbish 800 1224 4093
Council kerbside rubbish 3357 1262 1078
The key points from the above chart show that Thames-Coromandel has a high
proportion of its waste and recycling passing through transfer stations, and that the
13majority of the kerbside collections are Council, not private, collections. By contrast,
Hauraki and, in particular, Matamata-Piako have a high proportion of their waste
coming from private kerbside collections and much less is managed through transfer
stations.
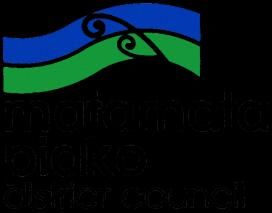
What are we throwing away?
Matamata-Piako and Hauraki District Councils have carried out surveys of the waste
to see what is being thrown out that could be recycled or recovered. The results are
shown in the charts below:
Figure 4: Hauraki District Council Waste Composition (All Waste Streams)
Rubber Potentially
1% hazardous
1%
Timber Paper
12% 15%
Rubble, concrete,
etc.
7%
Plastics
Nappies & 13%
sanitary Textiles
4% 4%
Glass
5%
Organics (food and
greenwaste)
Non-ferrous 29%
metals
1%
Ferrous metals
8%
Note: Waste audit data is from 2006. Kerbside and transfer station recycling has been implemented
since, which means the current composition is likely to be different to that shown.
Eastern Waikato Draft Waste Management and Minimisation Plan 2011
14Figure 5: Matamata-Piako District Council Waste Composition (All Waste Streams)
Rubber Potentially
1% hazardous
2%
Paper
Timber 13%
13%
Rubble, Plastics
concrete, etc. 11%
10%
Nappies & Organics (food and
sanitary greenwaste)
5% 30%
Textiles
5%
Glass
5% Non-ferrous
metals Ferrous metals
1% 4%
What is apparent from the above charts is that, although there are some small
differences, the two district‟s waste compositions are very similar. The largest
components of the rubbish in each are organic waste (food and garden waste), paper
(including cardboard), timber, and plastics.
These are all types of waste where most of what we are throwing away could be
recovered for recycling or composting. It is clear that, while we are doing a lot of
recycling, we could be doing more.
If we can find ways to get this recycling and compostable material out of the rubbish
collection, then we can save costs on the amount we send to landfill, and reduce our
environmental impact by recycling or composting these materials instead.
Nearly a third of the waste we send to landfill comes from kerbside collections.
Surveys of this waste stream show that much of this could be recycled or composted.
This is shown in the chart below:
15Figure 6: Kerbside Waste Composition
Potentially hazardous
100%
Rubber
90% Timber
80% Rubble, concrete, etc.
Nappies & sanitary
70%
Textiles
60%
Glass
50% Non-ferrous metals
40% Ferrous metals
Other organic
30%
Garden
20%
Food waste
10% Plastics
0% Paper
HDC MPDC
The chart shows that about a third of the waste that households put out for collection
in the Hauraki and Matamata-Piako districts is food waste. This is the biggest single
part of the waste stream that we could target to reduce our waste. Food waste can
be composted or digested to create valuable soil amendment products or even
generate energy. Other key household wastes that we could recycle more of include
paper, glass, plastics and cans.
Eastern Waikato Draft Waste Management and Minimisation Plan 2011
16Existing Services and Facilities
The Councils currently provide the following services:
Kerbside collection of household refuse
Kerbside collection of household recyclables
Transfer station operation
Servicing of litter bins
Servicing of rubbish and recycling drop off points
Servicing of public place recycling bins
Transport of waste to disposal
Transport of recyclables to processing
Monitoring and reporting of waste data
Disposal of waste to landfill
Removal of illegal dumping
Communication and education
Detail on the different kerbside and transfer station services provided by each of the
Councils is shown in the following tables.
More detailed information on waste facilities and services, and a more detailed
analysis of waste composition and data, is contained in the completed Waste
Assessment in Part C, section A.6.0.
Table 5: Council Kerbside Services
COUNCIL TCDC MPDC HDC
KERBSIDE
SERVICES
Recyclables Glass, paper, Glass, paper, Glass, paper,
cardboard, Al & Steel cardboard, Al & Steel cardboard, Al & Steel
cans, plastics (1-7) cans, plastics (1-7) cans, plastics (1-7)
Weekly in crates (1- Weekly in crates Weekly in crates
3x week in peak)
Residual Official 60 L pre-paid Official 60 L bags 52 Official 60 L pre-paid
Waste bags $2.05 each (30 provided through bags $1.90 each
Litre bags: $1.23 targeted rates then Weekly
each) $3.50 each
Weekly (1-3x week in Weekly
peak)
% of 89% 64% 62%
Households
served
17Table 6: Transfer Station Waste Streams and Charges by Council
TRANSFER STATIONS HDC MPDC TCDC
Number of Transfer Stations 2 3 7
Recyclables (free) Glass, paper, cardboard, Al & Steel Glass, paper, cardboard, Al & Steel Glass, paper, cardboard, Al & Steel
cans, plastics (1-2) cans, plastics (1-7) cans, plastics (1-7)
Metal Free $50/tonne Free
Oil & Chemicals Free Free (household quantities) Free (household quantities)
Car batteries Free Free Free
Timber Free - -
Green waste $105/tonne $62/tonne $73.50/tonne
Car bodies Stripped –free Stripped $26 Free
Not stripped $26 Not stripped $52
Tyres $3-21 each $3-22 each -
Furniture & Whiteware - No reuse/$10 per whiteware item Free
Residual Waste $150 tonne $137 tonne $147 tonne
Eastern Waikato Draft Waste Management and Minimisation Plan 2011
18Funding of Solid Waste Services
All three Councils recover a proportion of the costs of the services through user
charges as detailed in the tables above. The charges do not cover all the costs of
service provision, however, and a portion of the cost is met through targeted rates.
The targeted rates applied by each of the Councils are as follows:
HDC: $44.35 per annum per household
MPDC: $163 per property (budget for 2011/12 Annual Plan)
TCDC: $0.99 per $10,000 of land value per annum
Seasonal Issues
There can be big seasonal variations in the amount of waste we have to deal with. In
most parts of New Zealand, waste disposal reaches an annual peak in December,
declines towards the middle of winter, and then increases again towards the end of
the year. This pattern primarily relates to the annual cycles of commercial and
manufacturing activity.
In the chart below, the monthly tonnages of waste to landfill from each district are
compared. The datasets that have been used for the comparison are not consistent,
with the Matamata-Piako data being from a slightly different time period than the
other two districts.
Figure 7: Comparison of Monthly Landfill Tonnages
2500
Thames-Coromandel
2000 Hauraki
Matamata-Piako
1500
1000
500
0
r
r
y
ry
r
er
t
ch
be
be
ly
ne
be
ay
s
ril
ar
ua
gu
ob
Ju
Ap
ar
m
nu
m
M
Ju
m
br
Au
ct
e
M
e
e
Ja
pt
ov
Fe
O
ec
Se
N
D
While Hauraki and Matamata-Piako display a similar disposal pattern to most other
parts of New Zealand, with waste disposal in December being the highest of any
month of the year. Thames-Coromandel, on the other hand, peaks in January, when
visitor numbers are the greatest. The large number of visitors in the district in
19January results in increased commercial and residential waste activity, and therefore
more waste from these sources.
This January peak in waste and recycling caused by visitor numbers is illustrated by
the chart below which shows the monthly tonnage of Council‟s kerbside collections in
Whangamata.
Figure 8: TCDC Kerbside Collection in Whangamata (March 2009 – February 2010)
120000
Waste to Landfill
100000 Recycling
80000
Kgs
60000
40000
20000
0
Jun
Nov
Jan
Jul
Aug
Dec
Feb
Apr
Mar
Ma
Sep
Oct
The January peak is similar in other areas with large number of summer visitors, such
as Pauanui and Whitianga, but is absent in areas such as Thames.
These seasonal peaks create some significant challenges for managing waste flows
and servicing residents and visitors to the districts.
Forecasts of Future Demand
There are a range of factors that are likely to influence how much waste is produced,
and how it is managed. Key factors include the following:
Population growth. This includes both usual and temporary residents.
Household growth
Economic growth (Levels of waste generation have historically been linked to
level of economic growth, which leads to greater levels of production waste,
consumption and construction.)
Recycling markets/commodity prices
Local and Central Government Policy
Changes in lifestyles and consumption
Community expectations
Some of the key factors that we think are likely to influence the demand for waste
services in our districts in the future are discussed in the following subsections.
Eastern Waikato Draft Waste Management and Minimisation Plan 2011
20The Waste Minimisation Act 2008
The legislation has already been widely noted in this draft WMMP in terms of the
requirements around planning for waste. Other elements of the legislation that could
be significant include the Product Stewardship requirements, which will drive
increasing responsibility to be taken by manufacturers for their products through their
life cycle. The Waste Minimisation Fund is already re-investing significant sums
collected through the landfill levy into initiatives and technologies that minimise
waste.
Increased Costs of Disposal
Disposal costs are likely to rise over the next ten years. Key drivers for the increase in
costs will come from potential increases in the landfill levy and the introduction of the
Emissions Trading Scheme in 2013. The government currently imposes a levy of $10
a tonne on all waste sent to landfill. The rate of the levy is not expected to change in
the next three years but the Government must review it again in 2014 and it could
increase following the review. Of more immediate impact is likely to be the effect of
the NZ Emissions Trading Scheme. The scheme will mean that, in some landfills,
costs of disposal could rise by as much as $55 a tonne (depending on the price of
carbon). Our expectation is that our landfill costs will increase by approximately $10-
15 per tonne from 2013 and may rise further after that.
Population and Household Growth
This is expected to be one of the key drivers for growth in the generation of waste
over the life of the WMMP. The expectations for each of the districts are as follows:
Hauraki: Waste growth is expected to be driven by population growth. Forecasts set
this at 4% over next 10 years
Matamata-Piako: The Matamata-Piako population is expected to remain stable but
will become more urbanised over time. This will lead to a small waste increase due to
smaller household sizes (small households produce more waste per person than
larger households) and increased consumerism
Thames-Coromandel: There is expected to be a continuing increase in the numbers
of dwelling units (driven by more holiday homes). Waste service growth is predicted
to be in line with this at the rate of 1.8% each year, which equates to a 20% increase
over 10 years.
Markets
When we recover materials from the waste stream for recycling and reuse it is critical
that that there are viable markets that will make use of the material. For the main
materials we recycle the price that is paid for these materials is crucial for recycling
making financial as well as environmental sense. This particularly holds true for
recovery of materials in the private sector.
Recycling markets, like all markets, can go up and down significantly. In the latter
part of 2008, after the global financial crisis, international markets for recycled
commodities fell sharply.
21The fall in the markets led to stockpiling of materials by recyclers, and put strain on
the industry. Continued global economic instability means that there is a chance
prices could fall sharply again, and this could affect the viability of the recycling we
do. We therefore need to monitor recycling markets and ensure our arrangements
with recyclers enable their long term viability, while protecting our communities‟
interests.
Public Health
Protecting public health is one of the original reasons for local authority involvement
in waste management. This was set out in the Health Act 1956 - although these
requirements have now been repealed2. The NZ Waste Strategy contains the twin
high level goals of “Reducing the harmful effects of waste”, and “Improving the
efficiency of resource use”. In terms of addressing waste management in a strategic
context, protection of public health can be considered one of the components
entailed in „reducing harm‟.
Key issues that are likely to be of concern in terms of public health include the
following:
Management of putrescible wastes
Management of nappy and sanitary wastes
Potential for dog/seagull/ vermin strike
Timely collection of material
Management of spillage
Litter and illegal dumping
Medical waste from households and healthcare operators
Storage of wastes
Management of hazardous wastes
Private on-site management of wastes (burning, burying, rural waste
management etc)
Safe treatment and disposal of wastes
Management of Public Health Issues
Broadly speaking, waste management-related public health issues are likely to relate
as much to how well systems are managed as to the types of systems. The above
public health issues are likely to apply to a greater or lesser extent to virtually all
options under consideration. For example, illegal dumping tends to take place no
matter what waste collection and transfer station systems are in place. Some
systems may make the problem worse (infrequent collection, user charges,
inconveniently located facilities etc.), but by the same token problems can be reduced
through methods such as enforcement, education, and providing convenient facilities.
2Refer: MfE 2009: Waste Management and Minimisation Planning, Guidance for Territorial
Authorities.
Eastern Waikato Draft Waste Management and Minimisation Plan 2011
22In considering how public health issues should be addressed in the context of this
draft WMMP, the view is taken that public health issues are likely to present at least
some level of risk across all options. Public health issues should not, therefore, drive
strategic decisions but should be evaluated across all options, and issues flagged
where the level of risk is likely to require specific management controls or
interventions.
In most cases, public health issues will be able to be addressed through setting
appropriate performance standards for waste service contracts and ensuring
performance is monitored and reported on, and that there are appropriate structures
within the contracts for addressing issues that arise.
Grants
The Councils have the ability under the Act (s47) to make grants and advances of
money to any person, organisation or group for the purposes of promoting or
achieving waste management and minimisation, as long as this is authorised by the
WMMP. Each Council will use its own grants policy framework.
The Key Issues
Based on the work we have undertaken, including the Waste Assessment, the
Councils believe that the key issues for the districts are:
Landfill disposal costs will rise
We need to produce less waste in the first place, and encourage those who do
produce waste to take greater responsibility for reducing it
Recycling still being thrown in to rubbish bins even with a recycling collection
available
We need to be aware of markets for recycled materials and how this may
affect the affordability of recycling services
A large proportion of waste going to landfill is organic waste – this is a
particular problem due to the negative environmental impacts
A need for more/improved facilities for managing waste within the region
Varying demand through the region – summer visitors, rural customers,
businesses
A lack of data on waste flows and composition in the districts – particularly in
respect of waste and recovered materials managed by the private sector
There are opportunities to target materials for recovery and reuse including e-
waste, construction and demolition waste, and re-usable items like furniture
Questions:
Do you understand these key issues, and do you agree that these are the key issues
for the District?
Are there other key issues relating to waste management that you think have been
missed?
23Means of Implementation and Funding
Section 43 of the Waste Minimisation Act requires that the Councils include
information about the implementation and funding of the actions of this Plan, as well
as information about any grants made and expenditure of levy funds. Part C, section
A.1.0 outlines how the Councils propose to meet this requirement.
Eastern Waikato Draft Waste Management and Minimisation Plan 2011
24Part B – Action Plans
Introduction
The following Action Plans set out how the Eastern Waikato districts intend to work
towards the vision, goals, and objectives outlined in Part A of the WMMP.
The Action Plans are intended to establish clear practical initiatives that the councils
will implement, either jointly or on their own. While the action plans form part of the
WMMP they are intended to be useful „living‟ documents that can be regularly
updated to reflect current plans and progress. Under the WMA the plans can be
updated without triggering the need for a formal review of the WMMP, as long as the
changes are not significant and do not alter the direction and intent of the strategy as
set out in Part A.
It should be noted that all of the proposed actions set out in the plans will necessarily
be contingent on their feasibility being established and being achievable within the
councils‟ waste budget envelopes. It is a requirement to state how the actions in the
WMMP are to be funded, but the guidance recognises that it is beyond the scope of
the WMMP to cost each of the initiatives in detail.
It is also worth re-stating that in carrying out our role, the councils‟ main avenue for
action will be through the contracting out of waste services. This means that the
delivery of the actions set out here will depend in large part on their inclusion in a
contracting arrangement and this being able to be done within council budgets.
It is anticipated that joint working and joint procurement of waste services will lead to
some efficiencies and that this will allow us to do more within our budgets. However
exactly what services are delivered will ultimately depend on the outcomes of the
procurement process.
The collection, transfer station and disposal contracts for the three councils have
been aligned so that they all expire on 30 June 2013. This gives us the opportunity to
seek providers for all of our key waste services together. This will allow us to
determine the best and most efficient and effective way to procure and manage the
services. For example; we may seek a single contractor for all of the services across
the districts, or we may appoint different providers for different services (such as
collection or transfer station operation).
There are three Action Plans set out in this section:
1. Cross-Service Actions: This covers joint actions the councils will take that are
not contracted out. These actions support the shared service and
independent atctions.
2. Shared Services: This covers all the services we may seek to deliver through a
joint procurement
3. Independent Actions: This covers services that each council are likely to
manage on their own
25You can also read