G20 CLIMATE RISK ATLAS - Impacts, policy, economics - CMCC Foundation
←
→
Page content transcription
If your browser does not render page correctly, please read the page content below
G20 CLIMATE RISK ATLAS
Impacts, policy, economics

SOUTH AFRICA                                                                                                                      With the scientific
                                                                                                                                   contribution of
                                                                                                                                   Enel Foundation

How to read the Atlas: graphs, colours and scenarios.
The maps used in this Atlas are taken from The World Bank Official Boundaries -
(accessed on May 28, 2021). For the section Energy, the maps are based on Panoply Data Viewer
Each sector of this Atlas contains data and information on various climate scenarios.
When reported in graphs, the colour black indicates data and information referring to the current state, the past or the baseline.
When the authors refer to RCP (Representative Concentration Pathways), the 3 colours used across the factsheet refer to 3 scenarios, which are 3
different development options with different levels of greenhouse gas emissions, respectively low emissions (green), medium emissions (orange), and
high emissions (red). The same colour code is used when RCPs are associated with Shared Socioeconomic Pathways (SSP).
In some cases, the authors refer to global warming scenarios. In these cases, the 3 colours used refer to a temperature rise of 1.5°C (green), 2°C (dark
green), and 4°C (red).
When the authors refer exclusively to Shared Socioeconomic Pathways - SSPs (Population affected by river floods in the section: “Water"), data related to
SSP3 - that encompasses, among other things, slow economic growth, material-intensive consumption, and persisting or worsening inequalities – are
reported in a lighter shade; SSP5 – which refers to social and economic development that is coupled with an energy-intensive lifestyle and the abundant
exploitation of fossil fuel resources – is shown using a middle shade of the colour, whereas data related to the present conditions are represented in a
dark shade.
Further details on scenarios, methodologies, and the full list of references are available at: www.g20climaterisks.org
                                                                                                                      Concept and graphic design by element6.eu
SOUTH AFRICA

CLIMATE
OVERVIEW                                                                  TEMPERATURE PROJECTIONS
The climate in South Africa is more variable than other                   Under a low emissions scenario projected temperature variations will
countries in sub-Saharan Africa due to its subtropical                    remain contained under 1.5°C, both by 2050 and 2100.
                                                                          Under a high emissions scenario, with no reduction in GHG emissions,
location and the presence of oceans on three sides of                     much greater temperature anomalies are expected by both 2050 and
the country. In general, it is a warm temperate climate                   2100.
with some differences between west and east coasts,
which are related to cold and warm coastal currents
and in part influenced by the El Niño–Southern Oscil-                                                                                   +5.7°C
lation. A singularity is the Western Cape which features                          TEMPERATURE                                          +2.8°C
a Mediterranean climate.                                                          ANOMALY                                               +1.1°C

TEMPERATURE                                                                                                         +2.1°C
South Africa experiences average annual temperatures of 17°C. The                                                   +1.9°C
southern and eastern areas are the regions with the lowest tempera-                                                 +1.4°C
tures due to their altitude. The warmest areas are the coastal ones and
inland areas of the northern Cape.
                                                                                              +0.4°C

MEAN                         +9                                   23
                                                                           -0.2°C
TEMPERATURE                        Celsius degrees / Over 1991-2020

                                                                           1985               2014                  2050                  2100

                                                                          Historical Period

                                                                          EXPECTED VARIATION
                                                                          FOR TEMPERATURE AT 2050
                                                                          The indicators show variations in selected temperature characteristi-
                                                                          cs for a thirty-year period centred on 2050 (2036-2065) with respect
                                                                          to the reference period 1985-2014.

TEMPERATURE TREND                                                                     +2.1°C                  +2.4°C                     +1.9°C
Temperature anomalies over the last 60                           max
years with respect to the annual mean of                       1.7 °C                   +1.6°C                  +1.8°C                        +1.5°C
17°C in South Africa during the
1961-1990 period                                                                      +1.2°C                  +1.5°C                     +1.1°C
 1961                                                                     Annual Mean            Max Temperature           Min Temperature
                                                                          Temperature            of warmest month          of coldest month

                                                                2020
 -0.8 °C
 min
PRECIPITATION                                                                  PRECIPITATION PROJECTIONS
The precipitation regime in South Africa exhibits changes depending            Precipitation trend shows a slight decrease in precipi-
on time of the year and location. Generally speaking, South Africa is a        tation during the last part of 21st century: such a
relatively dry country: the Western Cape gets most of its rainfall in          decrease in appreciable especially under a high
winter, whereas the rest of the country is generally a summer-rainfall         emissions scenario. The variability is quite large both              -18.0%
region.                                                                        for the historical period and the                                    -10.4%
Rainfall concentrations vary across seasons and, at an annual timesca-         projections considering all the                                        -1.2%
le, it is highly irregular in most parts of the country. Changes in South      scenarios.
Africa’s rainfall seasons could affect farming and water resources. In
terms of geographical distribution, there is more precipitation in the                  PRECIPITATION                            -7.1%
coastal areas of the Indian Ocean compared to other parts of the                        ANOMALY                                  -7.7%
country.
                                                                                                                                 -4.7%

MEAN                         61                                   2,273         -1.0%                  -3.0%
PRECIPITATION                              mm/year / Over 1991-2020

                                                                                1985                   2014                      2050                   2100

                                                                              Historical Period

                                                                               EXPECTED VARIATION
                                                                               FOR PRECIPITATION AT 2050
                                                                               The indicators show variations in selected precipitation characteristi-
PRECIPITATION TREND                                                            cs for a thirty-year period centred on 2050 (2036-2065) with respect
Precipiation anomalies over the last 60                                        to the reference period 1985-2014.
years with respect to the annual mean of                              max
478 mm/year in South Africa during the                             +48%
1961-1990 period                                                                               -5.6%                          -1.1%                     -1.4%
 1961                                                                                            -3.4%                           +0.7%                   -4.4%

                                                                                               -1.9%                          +0.9%                     -1.2%
                                                                                Annual total                  Precipitation of           Precipitation of
                                                                                precipitation                  wettest month             warmest quarter

 -55%                                                               2020
 min
                                                                  +39%                          +24%                          +4,825%                   +42%

                                                                   +20%                          +13%                            +688%                      +16%
VARIATION OF SPECIFIC                                             +15%                          +11%                          +263%                     +6%
CLIMATE INDICATORS                             Agricultural drought         Hydrological drought                 Heatwave                    Runoff
                                                proportion of time           proportion of time                  duration                   increase
Climate indicators variation showing                 % of time                    % of time                      % of time                  % of area
impacts of climate change on sectors such
as agriculture, health and water. Analysis                        +77%                          +14%                          +95%                      +8%
considers 3 threshold average temperatu-
re increase: +1.5°C, +2°C, +4°C.                                   +42%                          +11%                            +58%                       +3%

                                                                  +27%                          +15%                          +33%                      +1%

                                                   Agricultural                Hydrological                      Heatwave                    Runoff
                                                drought frequency            drought frequency                   frequency                  decrease
                                                    % of change                  % of change                    % of change                 % of area
SOUTH AFRICA

OCEAN
OCEAN IN SOUTH AFRICA                                                   FUTURE PROJECTIONS
South Africa's marine exclusive economic zone (EEZ)                     Projected annual changes within the marine EEZ for the two most
varies from colder Atlantic waters to temperate condi-                  significant marine indicators of climate change: sea surface water
tions on the Indian Ocean and hosts different coastal                   temperatures and pH.
ecosystems, such as coral reefs, seagrass meadows and                   Seawater temperature changes are in line
kelp beds. The country's coastal systems are naturally                  with the definitions of each scenario, with
diveded into two areas: the Atlantic and Indian marine                  maximum values close to +3°C under a high
                                                                                                                              +2.9 °C
regions.                                                                emissions scenario in 2100.
                                                                                                                              +1.7 °C
                                                                                                                                +1 °C
CURRENT CLIMATE CONDITIONS
Mean sea surface temperature reflects the different climate regimes,
from the relatively cold waters of the Atlantic region to the warmer            SEA SURFACE            +1.3 °C
ones of the Indian coasts.                                                      TEMPERATURE              +1 °C
                                                                                ANOMALY
                                                                                                       +0.9 °C

                                                                                           0.1 °C

                                                                         -0.2 °C

 10                                           25          MEAN           1950                 2014         2050                   2100

SEA SURFACE TEMPERATURE
Celsius degrees / Over 1991-2020

 0                                         0.25         TREND
                                                                         0.05

                                                                                            -0.01

                                                                                                          -0.09
                                                                                SEA SURFACE
                                                                                pH ANOMALY                 -0.11
                                                                                                          -0.15

                                                                        Seawater surface pH becomes more acidic in              -0.09
                                                                        all scenarios, closely reflecting rising                 -0.18
                                                                        atmospheric CO₂ concentrations, and only a
                                                                                                                                -0.39
Surface temperature trends indicate a general warming of 0.1°C per      low emissions scenario leads to a stable
decade in all marine areas, with increased gains in the south-western   condition by 2100.
areas.
ECOSYSTEM INDICATORS AT 2050
Regional changes in key marine ecosystem indicators
under projected future scenarios by mid-century
(2036-2065) with respect to present climate condi-
tions (1985-2014).                                                                          Atlantic                       Indian

                                                                                                        +1.24 °C                    +1.47 °C
Temperature regulates the metabolism of marine
organisms determining which habitats remain                                                  18.89°C     +1.04 °C        22.56°C     +1.13 °C
suitable. Excessive warming will likely push ecosy-
                                                                                                        +0.83 °C                    +1.08 °C
stems beyond tolerance thresholds.

                                                                                                        -0.15                       -0.15
pH represents the acid/base status of marine waters,
where a decreasing pH reflects the acidification of                                              8.11      -0.12             8.11      -0.11
the ocean due to increased absorption of atmosphe-
                                                                                                        -0.09                       -0.09
ric CO₂.

                                                                                                        -1.52 %                     -2.54 %
Oxygen is fundamental to sustain marine life and its
reduction can have a large impact on coastal ecosy-                                          235.24
                                                                                             mmol/m3
                                                                                                         -1.12 %          221.04
                                                                                                                         mmol/m3
                                                                                                                                     -1.89 %
stem services including fisheries and aquaculture.
                                                                                                        -1.23 %                     -1.74 %

                                                                                                        -2.75 %                     -11.41 %
Chlorophyll is an indicator of the biomass available
at the base of the marine food web supporting all                                              0.69
                                                                                              mg/m3
                                                                                                         -0.14 %           0.37
                                                                                                                          mg/m3
                                                                                                                                     -12.23 %
ecosystem productivity.
                                                                                                        -1.3 %                      -10.6 %

FISH CATCH POTENTIAL                                                         ANALYSIS DETAILS
Fish catch potential is an estimate of the maximum fish catch achie-          All datasets were analysed using only data from within the
vable given the marine resources available over a sustained period. It       marine EEZ and therefore excluding overseas territories,
is linked to the concept of maximum sustainable yield, meaning the           detached islands and any disputed or joint territories with
maximum amount of fish that can be extracted from a system without            other nations. In the assessment of current climate conditions,
causing a collapse in fish populations.                                       seawater surface tempererature data was obtained using
                                                                             satellite observations distributed in the framework of ESA
It is a characteristic of the natural system, which is substantially         Climate Change Initiative.
different from realized catch, and a direct result of the fishery policy in
place.                                                                       Future projections of marine indicators are represented by the
                                                                             combined analysis of results from 15 different Earth System
                                                                             models participating in the Coupled Model Intercomparison
                                                               -11.2%        Project Phase 6 (CMIP6). These models include new and better
Fish catch                     2050                                          representations of physical and biogeochemical processes,
percentage                                                                   compared to previous IPCC assessment reports.
change                                                                       Fish catch potential data was obtained using the FAO's techni-
                                                               -6.0%         cal report and refers to the best and worst case climate scena-
                                                                             rios from the Fifth IPCC Assessment Report. These mean
                                                                             estimates are subject to substantial uncertainties as discussed
                                                                             in the original work.
SOUTH AFRICA

COASTS
OVERVIEW
With 3,751 kilometres of shoreline, the South African
coast is very diverse. To the west beaches, cliffs and arid
landscapes face the Atlantic Ocean, whereas to the east                        Shoreline                               3,751 km
temperate and grassy environments look out over the                            Length
Indian Ocean.The largest coastal settlements on are
Cape Town and Durban, each with more than 3 million
inhabitants, and Port Elizabeth, with around 1 million.
The coastal economy has been evolving in recent years,                         Sandy
with more economic activity and an increasing popula-
tion.                                                                          Coast Retreat                                             -15.3 m
                                                                               at 2050

CLIMATE CHANGE HAZARDS
Coastal hazards such as erosion, storm tide inundation and permanent          sea levels and possible changes in storm intensity and direction,
flooding, can have strong adverse impacts on coastal regions, with             affecting both the east and west coasts. Some parts of South Africa are
loss of sandy shores, damage to settlements, infrastructure and ecosy-        also sensitive to the risk of sea level rise and land loss, with the main
stems. Climate change can exacerbate these impacts due to rising sea          urban centres on the coast already being actively managed with
levels and increasing impacts of waves and storms. Climate change             coastal protection structures. In general, the beaches of South Africa
impacts on the coastal zone of South Africa are mainly driven by rising       are likely to be impacted by coastal erosion and recession.

SEA LEVEL RISE                                                                EXTREME SEA LEVEL
Relative sea level rise has been observed over the past century around        On average, one in 100 extreme sea level events are expected to rise
the coast of South Africa, with a yearly average increase of approxima-       from 2.29 metres at present day to 2.54 metres by 2050 under a
tely 1.71 millimetres per year since the 1990s. The latest IPCC               medium emissions scenario.
projections indicate that, by 2050, global sea levels may rise between
0.18 metres, under a low emissions scenario, and 0.23 metres, under a
high emissions scenario.

                                                                0.23 m                                                                            2.62 m
Observed and                                                                  Current and
projected sea                         1.71                                    projected extreme                   2.29 m                           2.54 m
level rise at 2050            mm/year                                         sea level at 2050
                                                                0.18 m

  OBSERVED                                                                       FUTURE
 STORMS           The wave climate of South Africa is influenced by
                  different types of storms developing both in the South
                                                                               STORMS            Although averages appear to remain constant, there
                                                                                                 seems to be some variation in individual storm intensi-
                  Atlantic and the Indian Ocean. Waves significantly                              ties. For example, considering the peaks of individual
                  affecting the coastal zone and its infrastructure are                          storms during the more extreme winter period (June to
                  generated mainly in the southern Atlantic, or by low                           August), an increasing trend of about 0.5 metres over 14
                  pressure systems along the southern to eastern coast                           years has been observed. The trend could be indicative
                  and, occasionally, by tropical cyclones moving down the                        of a significant increase in storminess over the coming
                  Mozambique channel. The wave climate around the                                decades. What is clear is that rising sea levels will also
                  South African coast shows clear seasonality and varies in                      increase the frequency of extreme sea level events.
                  intensity and directionality.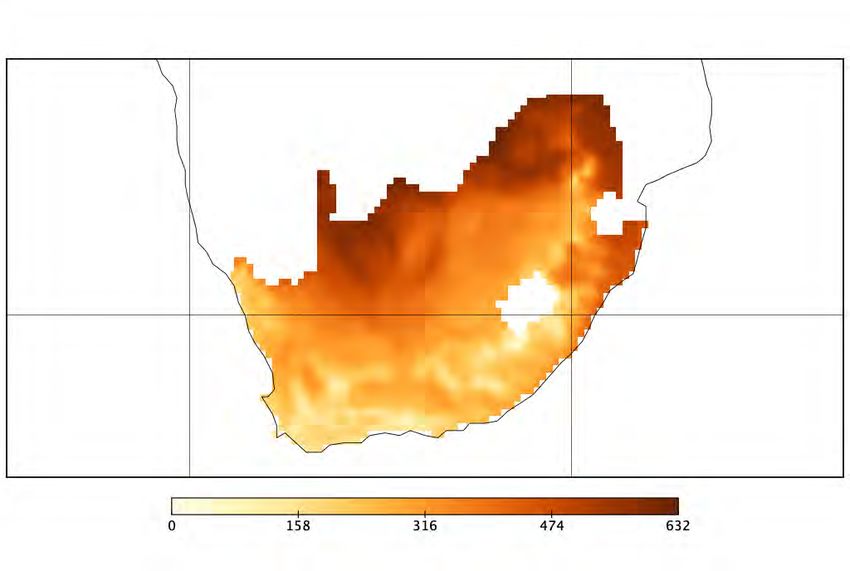
VULNERABILITY AND RISK
         In South Africa the most important drivers of risk to                                                          VULNERABLE
         coastal infrastructure from erosion and flooding are                                             HISTORICAL     POPULATION
         waves, tides and future sea level rise.

         With most of the coastal population concentrated in a
         relatively limited number of coastal cities, such as Cape                                    0.05 Million
         Town and Durban, the population exposure is relatively
         low given the nature of the shoreline that combine
         sandy beaches and rocky shores.
                                                                                                                                      0.06 Million
                                                                                                           2050
         Beaches are likely to recede and nearby infrastructure to be damaged                                                           0.06 Million
         in some locations, however, widespread land loss is not expected.
         Recent estimates show that, under a medium emissions scenario, the
         total population exposed to the annual coastal flood level is expected                                                        0.06 Million
         to increase from 50,000 to 60,000 people by 2050.

                                                                                                                                      0.09 Million
                                                                                                           2100

                                                                                                                                        0.07 Million

                                                                                                                                      0.06 Million

                           INFLUENCE OF SEA LEVEL RISE
                           ON EXTREME SEA LEVEL                                              + Wave set up refers to the accumulation of water near
                                                                                             the shore due to the presence of breaking waves.
         Present and future sea level rise are a consequence of
         carbon induced global warming causing melting ice                                   + Storm surge is an occasional increase in sea level driven
         and ocean expansion due to heat accumulation.                                       by shoreward wind-driven water circulation and atmo-
                                                                                             spheric pressure.
         The extreme sea levels reported here are based on the 100-year storm
         surge + wave set up + sea level rise + high tide indicators. The first two           + High tide is usually the highest tide reached in a given
         parameters (storm surge + wave set up) are based on the 100-year                    location based on tide records.
         value for the event; sea level rise is its projected value at 2050; and
         high tide is the absolute value of the highest tide calculated for a
         given locality, which won’t be influenced by climate change.

                                                                                                                                                 Wave set up
                                                                                                                                                         Storm surge
         Wave set up                                                                                                                             Storm surge
Storm surge
        Storm surge
          Lowest  tide

            Mean sea level                                                  Extreme     Mean sea level
                                                                                                                                                 Sea levelSea
                                                                                                                                                           riselevel rise
Sea levelSea
          riselevel rise                                                    sea level
                                            0m elevation (AHD)                                                         0m elevation (AHD)
Hig tide Hig tide                                                                       Lowest tide                                                   Hig tide Hig tide

         Present sea levels have risen globally by approximately 20 centime-            Future sea level rise is a projection based on different global
         tres over the past century.                                                    warming scenarios, at approximately 100 centimetres by the end of
                                                                                        2100, with consequent inundation during extreme sea level events.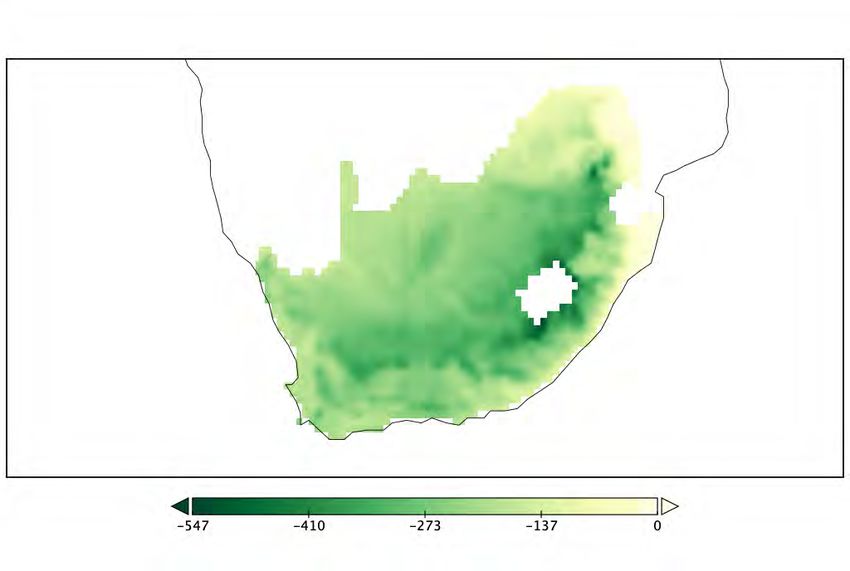
SOUTH AFRICA

WATER
OVERVIEW
South Africa's water resources are, in global terms,
scarce and extremely limited. The average rainfall of                         Renewable internal                      45
450 millimetres per year is well below the world                              freshwater resources             billion m3
average of 860 millimetres; evaporation is comparati-
vely high; no truly large or navigable rivers exist; and
the combined runoff of 49 billion cubic metres per year
is less than half of that of the Zambezi River, the
closest large river to South Africa.                                          Renewable internal                     786
                                                                              freshwater resources                     m3

In addition, South Africa has scarce groundwater                              per capita
resources and the natural availability of water across
the country is highly uneven with more than 60% of                           With an average precipitation of about 460 millimetres per year, South
the river flow arising from only 20% of the land.                             Africa is a very arid country, especially when compared to the world
                                                                             average precipitation of 860 millimetres per year. Sparse precipitation
Four of South Africa's main rivers are shared with other                     is aggravated by exceptionally high potential evapotranspiration, that
countries, which together drain about 60% of the coun-                       ranges from about 1,800 millimetres per year in the east of the
                                                                             country to more than 3,000 millimetres per year in the north-western
try's land area and contribute about 40% of its total                        part of the country. For the majority of the country, rainfall occurs
river flow.                                                                   predominantly as brief afternoon thunderstorms in the summer
                                                                             months. The Western Cape is the exception, which has a typically
                                                                             Mediterranean climate, with frontal rainfall that is concentrated in
                                                                             winter.
CLIMATE CHANGE HAZARDS
Climate change can affect water resources through increasing tempe-          levels, demand for water by people, industry and agriculture is
ratures, higher rates of evapotranspiration and altered rainfall             expected to rise by 17.7 billion cubic metres by 2030, while water
patterns. This leads to changes in the water cycle, including decrease       supply is projected to amount to 15 billion cubic metres, representing
of snow and ice coverage, alterations of surface runoff and groundwa-        a 17% gap between water supply and demand. Climate extremes are
ter storage, as well as drought and flood occurrence. Based on rising         also expected to change in South Africa.
population, economic growth projections, and current efficiency

KEY POINT RUNOFF
                                                                                                                                        +9.0%
South Africa's water requirements are mostly provided through                2050
surface runoff, captured in rivers and dams. Irrigation accounts for                     Changes in
about 62% of the country's water use, while delivering a substantially                   annual runoff
lower economic yield per unit water than through the other sectors.                      % of change
Lately, the use of groundwater has increased dramatically, primarily                                                                    +5.0%
due to extraction for irrigation. Nationally, irrigation accounts for over
64% of groundwater use.

At a country scale, an average increase in surface runoff by approxima-                                                                 +8.0%
tely 5% and 9% is expected respectively under low and high emissions         2050
scenarios for the 2045-2055 period compared to 2015-2025. If                            Runoff increase
temperatures rise by 1.5°C, 2°C or 4°C, 1%, 3.2% or 8% of the area of                   % of area
the country will likely experience an increase in runoff, while 6%,
15.5% or 42% of the surface of the country will likely experience a                                                                     +1.0%
decrease in runoff, respectively.
KEY POINT DROUGHTS
                                                                                                                                  +38.9%
South Africa is subject to the occurrence and impacts of droughts, in
particular in its western and northern provinces. Frequent droughts in
                                                                            2050     Severe drought
the past have occurred, with detailed records of droughts since the                  likelihood increase
1950s and very damaging droughts in the 1980s, 1990s and 2010s.                      % of change
Droughts in South Africa are mainly driven by climatic forces and by                                                              +21.2%
the influence of climate oscillations such as the El Niño, which is
associated with extreme drought conditions.

The latest extreme drought is the 2018-2020 drought caused by the                                                                 +14.0%
latest El Niño event. Droughts are expected to increase in the future,
driven by increasing water use and changing global climatic patterns.
                                                                            2050     Hydrological
More frequent and stronger El Niño events are also possible.                         drought frequency
                                                                                     % of change
                                                                                                                                  +10.0%

KEY POINT GROUNDWATER
The total renewable groundwater in South Africa is estimated at
                                                                                                                                  -11.0%
10,343 million cubic metres per year (or 7,500 million cubic metres         2050     Groundwater
per year under drought conditions), while the current use is between                 Recharge
2,000 and 4,000 million cubic metres per year. In South Africa, groun-               % of change
dwater is widely used for rural water supply, particularly in the east of
the country, and also for irrigation, particularly in the west.
                                                                                                                                  -9.2%

Current estimated groundwater use is between 2,000 and 4,000                the annual groundwater recharge for the period 2045-2055 compa-
million cubic metres per year. Groundwater in South Africa is often         red to the timeframe 2015-2025 is expected respectively under under
overexploited and droughts are causing the depletion of renewable           low, medium and high emissions scenarios.
reservoirs. At the country level, a -8.2%, -9.2% and -11% decrease of

KEY POINT FLOODS                                                            POPULATION AFFECTED BY RIVER FLOODS
Floods are the most frequently recorded disaster in southern Africa.
South Africa is no exception and experienced 77 major floods betwe-           TODAY
en 1980 and 2010, costing the lives of at least 1,068 people. Many                                                                     4,909
severe floods have occurred since 2010 with losses of life, livelihoods                                                                 people
and extensive damage to built infrastructure. Major floods have               2050 SSP3
affected large urban areas such as Johannesburg, Durban and Cape                                                                       7,748
Town.                                                                                                                                  people
                                                                             2050 SSP5

The highest variability in storm flows can be seen in the western                                                                       8,204
interior, whereas the lowest variability is found in parts of the Eastern                                                              people
Cape, KwaZulu-Natal and the Free State. Changing rain patterns may
affect the frequency and intensity of floods and the population              the present day to about 7,700 under SSP3 and 8,200 under SSP5 by
exposed to river floods is expected to increase from about 5,000 in          2050, with a potential higher impact of river flood events.

RISK INDICATORS
The water stress index summarises current and future water related
vulnerabilities and risks at the global level. Scores are based on the
ratio of total water withdrawals, including agriculture, industrial and
human consumption, to available renewable surface and groundwa-
ter supplies.

WATER STRESS
South Africa's water stress level is considered medium-high for the
recent past (1960-2014 average), and it is expected to increase in the
near future (2030-2050) based on climate change projections.
SOUTH AFRICA

AGRICULTURE
OVERVIEW
South Africa has a market-oriented agricultural
economy that is highly diversified with production of
major grains, oilseeds, deciduous and subtropical fruits,
sugarcane, citrus, wine and most vegetables. The agri-
culture to GDP ratio has been decreasing steadily as                            19.3 Mt              12.5 Mt              2.9 Mt
other sectors have emerged over the years. However,                           Sugarcane              Maize                 Citrus
the total value of the sector increased six-fold from
1970 to 2018.
South Africa features a range of agro-ecological zones, including
Fynbos, Savanna, Grassland, Nama Karoo, Succulent Karoo, Forest, and
Albany Thicket. Each has unique rainfall patterns, and diversified
rainfed agricultural conditions. Such diversity allows for the
                                                                                2.5 Mt               1.9 Mt               1.9 Mt
production of different agricultural commodities. Agriculture share
was estimated at 60% of total water withdrawal in 2018, with groun-             Potato               Grapes               Wheat
dwater extensively used in rural and arid areas.

Added Value of Agricultu-             Share of Agriculture                    Agricultural                          Area Equipped
 re, Forestry and Fishing           Value added in Total GDP                     land                                for Irrigation

                               2000                                    2000                           2000

           4,971                                2.5 %                           14,197                                     1,498
        USD Million                                                           Thousand HA                              Thousand HA

                                2018                                   2018                           2018

           6,875                                2.1 %                           12,413                                     1,670
        USD Million                                                           Thousand HA                              Thousand HA

EXPECTED IMPACTS
ON AGRICULTURE PRODUCTIVITY                                                                                                Rising
                                                                                                                     temperatures
                                                                                     Changes in
Rising temperatures, reduction in average annual precipitation, and                  precipitation
intensification of extreme events such as heat waves and drought,                     patterns
affect production variability with a tendency towards yield                                                                 Increased
reduction for many cultivated species, accompanied by a probable                                                     frequency of dry
decrease in food quality. Crops respond to increases in temperatures                                               spells and drought   Temperature
with changes in duration of the growing season, early appearance of                                                                       variability
phenological phases and potential shifts of cultivation areas toward                                  Increasing intensity of
higher latitudes and altitudes for better growing conditions. Howe-                                   extreme weather events
ver, impacts vary significantly depending on the geographical area
and specific crops in question.
CROP PRODUCTIVITY 67.8 -4 (-3.8)% 5.1 -0.7 (-2.2)%
Crop productivity refers to the harvested yield of a crop per unit of
land area. It is strongly influenced by climate and other environmental -6 (-7)% -1.4 (-2.5)%
and management factors. Sugarcane Maize
tons / ha tons / ha
Climate change is expected to have an impact on the productivity of
several major crops, although this may in part be offset by the fertili- 3.3 -1.6 (-5.9)% 1.4 7.9 (-1.8)%
zing effect of higher CO₂.
-1.6 (-8.9)% 11.1 (na)%
Impacts are estimated using a range of model projections based on Wheat Sunflower
tons / ha tons / ha
low to high emission scenarios and reported as percentage changes
between the 30-year average around the historical period and the
30-year average around 2050. Productivity change with (without) the CO₂ fertilization effect.
2050
Estimates assume sufficient water and nutrient supplies, and
do not include impacts of pests, diseases, or extreme events.
CHANGE IN MAIZE CHANGE IN WHEAT
_ = + _ = +
Key staples such as maize and wheat may suffer a decline in producti- Sunflower seed cultivation may largely benefit from climate change,
vity due to extreme heat exposure, with largest yield productivity with general and consistent increases in productivity. Under moderate
losses identified in the northern provinces. The impact of climate warming, irrigated vineyards will maintain and increase productivity.
change will vary among different wheat cultivars. An average marginal For more significant warming, from 2 to 3°C small reductions of 2 to
decline in wheat productivity at country level, as well as projected 5% are expected. Larger losses in productivity (10-15%) are expected
yield increases in the Western Cape provinces, are expected. Although for non-irrigated vineyards. Fruit Production (apples, pears) in the
sugarcane biomass growth is expected to increase, the sucrose level Western Cape will suffer from lack of winter chilling following
may decrease due to higher rates of respiration and structural growth. warming.
ADAPTATION IN AGRICULTURE AND WATER RESOURCES
One of the major issues affecting future South African agriculture will tion demand in South Africa is highly likely to rise in the future due to
be linked to more recurrent and pronounced droughts and worsening increasing temperature and plant evapotranspiration. This increase is
water security. South Africa has endured ongoing droughts since 2014, likely to result in added pressure on existing water resources, which
most notably in the Western Cape. Over 338 million USD have been may in turn lead to less certain water supply for crops and smaller
lost in the Western Cape agricultural economy due to drought. Irriga- yields from irrigated agriculture.
CHANGE IN WATER DEMAND
_ = +
Agriculture
Water Demand +21.7%
% of change
+24.6%
2050
A substantial increase in water demand (20-25%) is
expected to maintain agricultural production, which will
require adaptation, agronomic practices and crop varieties
enhancing water-use efficiency to limit stress on water
resources.SOUTH AFRICA
FORESTS
FORESTS IN SOUTH AFRICA
Although highly fragmented, South African forest 1990
resources are diverse, rich in biodiversity and wide-
spread, particularly in the central-eastern coastal areas.
Their shape is strictly related to the passage of fire.
18 Mln ha 50 Tons/ha
Afro temperate, coastal, Misbelt, scarp and sand forests Million hectares Tons of Carbon per hectare
are the main types of ecosystems with small strips of Forested area Carbon stock
mangroves in the estuaries of the east coast which are
now critically endangered. 2020
FORESTED AREA AND CARBON STORAGE
South Africa is not a highly forested country. Approximately 15% of the 17 Mln ha 50 Tons/ha
Million hectares Tons of Carbon per hectare
land surface is covered in forests,and the trend has been steadily
decreasing in recent decades. Approximately 0,9 gigatonnes of carbon Forested area Carbon stock
are stored in wooded lands (soil included), with an important portion
stored in mangrove ecosystems. South African forests are a net carbon
sink.
2050
FOREST PRODUCTIVITY Productivity anomaly
Tons of Carbon per
+0.36
Forest productivity or Net Primary Production is the net carbon captu- hectare per year
+0.28
red by plants. It is the difference between the carbon gained by Gross
Primary Production - net photosynthesis measured at the ecosystem
scale - and carbon released by plants' respiration. It is expressed per
unit land area.
Increase particularly in the south and south-east
+ Fertilizing effect of increasing atmospheric CO₂ and nitrogen
deposition promote productivity
No areas with an expected decrease in forest primary
production
+ Increasing dry season reduces productivity
KEY SPECIES
ENDANGERED LESS SENSITIVITY
INDIGENOUS PINUS
UNDER Regenerative capacity of indigenous forest
resources are negatively affected by climate
Pinus species show less sensitivity to rising
temperatures
CLIMATE extremes
CHANGE REDUCTION
REFORESTATION
VULNERABILITY
MANGROVES
climate change will probably reduce areas Rapid sea level rise will threaten coastal
suitable for plantation forests significantly mangrove forests significantlyFIRES IN SOUTH AFRICA WHERE DO FIRES OCCUR?
Fire is a structural ecological process that provides several types of
ecosystem services and impacts on socio-ecological systems,
including human health, carbon budgets, and climate change. Changes Wilfires mostly affect mountain
in global fire activity are influenced by multiple factors such as grasslands and fynbos.
land-cover change, policies, and climatic conditions. Fire also releases
large quantities of greenhouse gases into the atmosphere, contribu-
ting to a vicious cycle.
During the last two decades, the total forest area affected by fire
amounts to approximately 0.42 million hectares.
BURNING EMITTING
0.42 MILLION HECTARES OF 9.78 TERAGRAMMES
FOREST OF CARBON PER YEAR
Historically, forest fires are
concentrated in the mountai-
nous regions of KwaZulu-Natal
and Mpumalanga in the
north-east, as well as across
SAVANNA FIRE EMISSIONS
CONTRIBUTED TO
COSTING the Western Cape.
84% OF TOTAL FIRE RELATED 7.8 MILLION USD IN ANNUAL
CARBON EMISSIONS SUPPRESSION COSTS
FUTURE BURNED AREA CASE STUDY: INVASIVE SPECIES
Under a low emissions scenario, models project a generalized
increase in burned area from Western Cape to the north-eastern Invasive alien species not only threaten native vegetation
regions, encompassing Mediterranean forests, desert shrublands, but also affect flammability and fire behaviour.
montane grasslands and subtropical forests. Under a medium
emissions scenario, the spatial pattern is expected to be similar. In the In 2017, exacerbated by an unprecedented drought,
future, burned areas might decrease across south-eastern areas. wildfires burned 15,000 hectares in Western Cape
destroying more than 800 buildings and killing 7 people.
Over half of the biomass consumed belonged to invasive
species increasing wildfire severity and difficulty of
firefighting.
2050
Burned Area +750 Large fires might also affect natural touristic attractions
km² per year impacting on ecosystem services. For instance, in 2018
+1,328 large fires burned more than 86,000 hectares along the
Garden Route in the southern part of the country.
FUTURE FIRE EMISSIONS
Fire emissions follow a similar spatial pattern to burned areas under
both low and medium emissions scenarios.
2050
Fire Carbon emission +5.2
Teragrams of Carbon per
year
+7.1
Decrease in burned areas for a low emissions scenario
Increase in burned areas for a low emissions scenario
+ Prolonged fire season length and increased fire exposure in
terms of weather conditions considered conducive to firesSOUTH AFRICA
URBAN
OVERVIEW
In South Africa, 67.4% of the population lives in urban 2020
areas. This rate is expected to rise both in relative and
absolute terms: whereas the urban population current- 39,550,889
ly 39.5 million, it is expected to increase to 58 million, Population in
with an urbanization rate of 79.8%, by 2050. Urban Areas
2050 58,056,843
Increases in population are expected, particularly in
big agglomerations with more than 5 million inhabi-
tants and in small centres with a population of less
than 300,000 people.
Graphs refer to data provided by United Nations, Department
of Economic and Social Affairs, Population Division (2018).
While the urban population is increasing, cities need to World Urbanization
tackle important challenges related to poverty and
inequality as 25% of urban dwellers live in inadequate
urban environments lacking basic services. 2020
67.4%
Built up areas cover only 0.89% of South Africa Urbanization
(10,873.57 square kilometers). Rate
2050 79.8%
OVERVIEW OF KEY
CLIMATE IMPACTS IN URBAN AREAS
Climate change impacts are enhancing urban challenges in South
Africa. The main climate stressors are increasing heat and water +89.0%
related stress.
2050
Cooling
Degree Days +35.0%
% of change
HEATWAVES AND HEAT STRESS +22.0%
Mean temperatures in South Africa are rising and the country is
experiencing a significant number of heatwaves. Heatwave impacts in
South African cities are actually scarcely monitored due to lack of data.
+95.1%
2050
Heatwave
In Cape Town, a three years drought brought the city’s urban water frequency +57.8%
supply down to critical levels of water scarcity in 2018. It was revealed % of change
that, already under present day conditions, 28% of South African towns
have inadequate water resources and are in need of urgent attention +33.1%
for ensuring equal access to safe drinking water.
With regards to the future climate and the expected rise in both +4,825%
duration and intensity of heatwaves, heatwaves are recognized as an
additional challenge for future urban policies. The city of Durban, for
2050 Heatwave +688%
instance, expects an increase in mean temperatures by 1.5°C to 2.5°C duration
% of time
by 2065, as well as an increasing number of heatwaves. +263%UNEQUAL EXPOSURE AND COMPOUNDED IMPACTS
Rising temperatures in urban areas cause health impacts, most of 2017
Population exposed
which are felt among those living in poorer neighbourhoods and 100.0%
informal settlements, with limited access to electricity - and thus to air to air pollution
conditioning - and poor housing quality.
For Cape Town, most informal settlements were found to be part of
the city’s hot spots for urban heat island effects, due to lack of vegeta-
tion. Furthermore, the urban heat island effect enhances the impacts
of air pollution. The entire urban population of South Africa is
constantly exposed to air pollution levels which exceed threshold
values recommended by the WHO.
COASTAL FLOODING 2050 0.23 m
Nearly 20% of the South African coastline has some form of develop-
ment at less than 100 metres from the shoreline, resulting in a high
amount of settlements and infrastructure at risk of storm surges. Due
to rising sea levels, such impacts are beginning to affect coastal areas 0.18 m
and tourism related infrastructure. Projected
sea level rise
0.77 m
2100
CHANGING PRECIPITATION PATTERNS
0.38 m
Intensity of precipitation events increased, whereas the number of
rain days has decreased significantly over the last 50 years. In Cape
Town, many of the poorer neighbourhoods found in low-lying areas +8%
with high groundwater levels are regularly flooded. 2050 Runoff
The areas have no stormwater infrastructures and lack systems for
increase +3%
% of area
waste water disposal. More wealthy neighbourhoods are located on
higher ground and are therefore rarely affected by floods. Despite +1%
increasing trends in annual precipitation, changing rainfall patterns
will bring more intense precipitation events, which increase the risk of
flash floods and landslides.
SURFACE SEALING Heavy precipitation in cities is problematic due to the high level of sealed surfaces. Soil sealing
increases run off and reduces the amount of water absorbed by soil. Where there are large amoun-
AND FLOODS ts of impervious ground cover, short duration extreme rainfall events can lead to increased
flooding, even resulting in flash floods.
2010 % of urban population
INFORMAL SETTLEMENTS
Population 25.6%
Due to high rates of urban growth and a high percentage of living in slums
households living in slum areas, the exposure of the South African
urban population to future floods is critically high. Low income
households are particularly affected as these are frequently situated
in low lying areas and lack efficient drainage systems. % of total population
Urban population
These urbanization patterns, created during the apartheid period, 2018
could lead to the creation of high risk areas and poverty traps where living in areas 0.1%
high rates of losses and damages go hand in hand with limited ability where elevation is
to cope and adapt due to marginalization, high poverty, and cultural- below 5 meters
ly-imposed gender roles.SOUTH AFRICA
HEALTH
OVERVIEW
South Africa already has a high burden of disease vate over the next few decades include: heat stress;
linked to environmental stressors, and climate change vector-borne diseases (such as malaria, dengue fever
will exacerbate many of these social and environmen- and yellow fever); extreme weather events; air pollu-
tal issues. Health risks that climate change may aggra- tion; and communicable diseases.
HEAT RELATED MORTALITY
Warming and increased frequency and duration of heatwaves has
already affected the wellbeing of the South African population. Heat-related mortality
% change with respect to 2000-2004
Under a high emissions scenario, heat-related deaths in the elderly
(65+ years) are projected to increase to about 116 deaths per 100,000
by 2050, compared to the baseline estimate of about 2 deaths per
100,000 annually between 1961 and 1990. 2018
Under a low emissions scenario, heat-related deaths in the elderly will +47%
increase to 20 deaths per 100,000 in 2050. In 2018, there was a 74%
increase in heat-related deaths in South Africa compared to the 2000
to 2004 baseline. 43.8% of heat-related mortality in South Africa, from
1991 to 2015, can be attributed to human-induced climate change.
IMPACTS ON LABOUR Impact on total labour
Labour is directly affected by changes in environmental conditions. % change with respect to 1986-2005 baseline
Warming affects both the number of hours worked (labour supply) and
on the productivity of workers during their working hours (labour
productivity). Both labour supply and productivity are projected to
decrease under future climate change in most parts of the world, and
particularly in tropical regions. 2050
Parts of sub-Saharan Africa, south Asia, and southeast Asia are at
highest risk under future warming scenarios. Future climate change
will reduce global total labour in the low-exposure sectors by 18
percentage points and by24.8 percentage points in the high-exposure -1.2%
sectors under a 3.0°C warming scenario
In South Africa, there was 39.9% loss in potential hours of labour in
-3.1%
the agriculture and construction sectors in 2019, compared to the 2080
1990s baseline. Total labour in South Africa is expected to decline by
1.2% under a low emissions scenario, and by 3.1% under a medium
emissions scenario.CLIMATE CHANGE AND DENGUE
Dengue has spread throughout the tropical world over the past 60
years and now affects over half the world’s population. Globally, vecto- Dengue suitability
rial capacity for both dengue vectors (A. aegypti and A. albopictus) has % of population at risk
been rising steadily since the 1980s, with nine of the ten highest years
occurring since 2000.
Climatic stressors are one important driver of the current distribution 93.5%
and incidence of dengue. Climate change is likely to expand the 2050
geographical distribution and suitability of several vector-borne
human infectious diseases including dengue. The risk of dengue 92.0%
transmission is increased by warming climates, as the growth and
development of mosquitoes are significantly influenced by temperatu-
re, precipitation, and humidity.
CLIMATE CHANGE AND ZIKA
Zika virus has spread to at least 49 countries and territories since 2013.
Climate change impacts on transmission suitability risk have increased Zika suitability
over the years and future warming over 1.3 billion additional people % of population at risk
could face suitable transmission temperatures for Zika by 2050.
56.3%
DENGUE AND ZIKA: POPULATION AT RISK 2050
As high temperatures and high levels of moisture are favourable
conditions for the distribution of dengue vectors, these diseases are
38.8%
likely to increase in the future due to climate change.
Under a medium emissions scenario, 92% of the population will be at
risk of transmission-suitable mean temperature for dengue by 2050,
whereas 93.5% will be at risk under a high emissions scenario. In the
case of Zika, 38.8% of the population will be at risk by 2050 under
medium emissions, whereas 56.3% will be at risk under high
emissions.
CLIMATE CHANGE AND MALARIA
As mosquitoes thrive in a warm moist environments, there is enormous
concern that projected global warming coupled with ecological factors Malaria suitability
may make malaria parasites spread over more provinces in South % of population at risk
Africa. 46.4% of the South African population will be at risk of malaria
under a low emissions scenario in 2050, whereas 52.9% will be at risk
under a high emissions scenario. 52.9%
2050
46.4%
POLLUTION AND PREMATURE MORTALITY
Air pollutants, including particulate matter (PM), sulphur dioxide,
ozone, carbon monoxide, benzene, lead and nitrogen dioxide, are a
concern for public health, and their concentration in ambient air is
regulated in South Africa. In addition, climate change will influence
the concentration of criteria pollutants by affecting weather patterns.
Ambient air pollution is estimated to have been responsible for 4% of
deaths in South Africa in 2015.SOUTH AFRICA
ENERGY
ENERGY SYSTEM IN A NUTSHELL ENERGY SUPPLY
South Africa has one of the highest energy intensities South Africa’s energy mix is strongly dominated by coal for industrial
of GDP in the world and relies heavily on domestic coal. use and electricity generation (73% of total primary energy supply in
2018) followed by (imported) oil for transport (15%), which also uses
Renewables hold a negligible share; the government is a significant volume of biofuels (6% of total primary energy supply).
pushing to increase diversification of the electricity Natural gas (3%), nuclear (2%) and other renewables (1%) hold very
mix, but currently there is no clear indication about modest to negligible shares. Hydropower is virtually non-existent
what sources are to be supported. (0.1%). The country imports oil, oil products and natural gas, but is
otherwise more than self-sufficient.
Due to income inequality, electricity use is skewed
towards higher income households, with over half of it
accruing to the richest 20% of the population.
0.19 1.1%
ktoe/US$
Energy AC Share in
intensity electricity
consumption
CLIMATE CHANGE TODAY
INCREASING TEMPERATURES
In South Africa, mean annual temperatures
have increased at least 1.5 times the obser-
ved global average increase of 0.65°C during
the last 50 years, resulting in increasing
cooling needs.
EXTREME EVENTS ENERGY DEMAND
A lower water availability and increased In South Africa, energy is used mainly by the industrial sector (41% of
exposure to extreme events has been obser- final demand in 2018, including non-energy uses accounting for 6.7%
ved. The severe floods of April 2019 severely of total demand), transport (27%) and residential (19%), followed by
damaged the electricity grid in the affected commercial use (8.5%) and agriculture and fishing (3.2%). Air conditio-
areas. ning’s contribution to residential electricity demand is minimal (1.1%
in 2017, 6% of the households) due to the temperate climate, and to
the limited affordability of electricity for most of the population.FUTURE ENERGY DEMAND
South Africa has a dry/temperate climate; hence cooling needs
prevails. This is projected to result in an increase in electricity demand
of 421 PJ (or 117 million KWh) by 2050 under a medium emissions
Net change in 2050
energy demand due to + 116.98
scenario. Air conditioning units are expected to increase exponentially
from 12 million units in 2016 to 236 million units in 2050. changes in DD/CDD
Billion KWh
COOLING NEEDS COOLING DEGREE DAYS 0 632
Strongest increases in cooling needs
along the northern border. Moderate ones
around the elevations where heating
degree days are expected to drop the
most.
HEATING NEEDS HEATING DEGREE DAYS -547 0
Moderate decreases in heating needs are
expected all over the country; larger
drops are expected in the southernmost
elevations on the plateau above Cape
Town, Sutherland, and the areas around
Lesotho.
FUTURE
ENERGY SUPPLY
The future configuration of the South African energy mix is likely to be
determined by the evolution of energy policies and hence is outside
EXPECTED IMPACTS
the scope of this report. OF CLIMATE CHANGE
There are no quantitative projections of the impacts of climate
There appear to be no long-term plans for decarbonization, and the
change on South Africa’s energy sector (bar a modest drop in
push for diversifying away from coal has not yet taken a definite
hydropower). Qualitatively, the main concerns are for the impact of
direction; the high relevance of the vulnerabilities of the coal
increased frequency of extreme events on the energy system, and for
extraction industry and of coal-fueled thermal plants is, however,
the impact of droughts on the thermal efficiency of coal power
posed to decrease in the coming decades.
plants.
-5.02%
Change in 2050
Hydropower generation -4.29%
% of changeSOUTH AFRICA
ECONOMY
OVERVIEW
South Africa is ranked lowest among the G20 countries
in terms of GDP. South Africa was badly hit by the
COVID 19 pandemic, recording a decline in real GDP of 2.46/5.03%
7% in 2020. However, the country is recovering with a
growth rate of 3.1% in 2021. 2050
0.11/3.33%
IMPACTS ON GDP GDP Loss
% change w.r.t baseline
Climate change will have an effect on the growth rate and overall
economic performance of the country. By mid century, costs could
reach between 8 and 12 billion EUR (or 3% to 5% of GDP) under low
and high emissions scenarios, respectively. 7.56/13.5%
2100
By the end of the century South Africa could stand to lose up to 13.5%
of GDP, or 33 billion EUR under a high emissions scenario.
0.35/2%
SECTORAL ECONOMIC IMPACTS
IMPACTS ON INDUSTRY AND INFRASTRUCTURE
The South African coastline covers more than 3,000 kilometers and Predicted declines in agricultural productivity, the resulting increases
links together the east and west coasts of Africa. Infrastructure and in domestic prices and negative effects on trade are expected to have
economic activities on the coast are exposed to sea-level rise and serious implications for household incomes that, by mid century, could
storm surges. be reduced by almost 5 billion EUR. All this is also expected to affect
GDP growth. Impacts on agriculture alone can determine a drop in
Road infrastructure alone, assuming that no adaptation measures are GDP by 6% by 2080 relative to a no climate change scenario.
taken, could total expected annual damages of 190 million EUR by
mid century, rising to 323 million EUR by the end of the century. Some slightly positive effects from moderate climate change cannot
be excluded in the livestock sector. Under a low emissions scenario by
mid century, gains to the ranglands livestock production of between
IMPACTS ON AGRICULTURE 10.9 to 19.6 million EUR may be experienced due to increase in the
Climate change induced changes in temperature and precipitation are productivity of some vegetation types.
expected to reduce annual agricultural output.
By mid century, South Africa could lose between 5.7% and 7.1% of the
IMPACTS ON FORESTRY AND FISHERY
agricultural sector's contribution to value added under medium and As a result of declines in the amount of suitable land available for
high emissions scenarios, respectively. This translates into an econo- forestry, by mid century also under a low emissions scenario forestry
mic loss of between 94 million and 122 million EUR. output could be reduced by as much as 43%, for a loss of 41 million
EUR.0.815
2050
SEA LEVEL RISE DAMAGES
Under current levels of coastal protection, by mid century, sea-level
rise and coastal flooding can cost the country 306 to 815 million EUR
in terms of expected damages to assets under low and high emissions
scenarios, respectively. 0.306
By the end of the century, expected losses may increase to 1.3 billion
Sea Level Rise
Expected annual damages
EUR under a low emissions scenario and 2.4 to 3.3 billion EUR under a Billion Euro
high emissions scenario.
2.4/3.1
2100
1.3
4.1
2050
RIVER FLOODING DAMAGES
River flooding can also provoke non-marginal damages, in fact, poten-
tially more severe than those from sea-level rise.
Riverine 3.3
By mid century total asset losses could reach 3.3 to 4.1 billion EUR and
in the second half of the century 5.1 to 9.6 billion EUR under low and
Flooding
Expected annual damages
the high emissions scenarios, respectively. Billion Euro
9.6
2100
5.1
IMPACTS ON ENERGY
As with all other economic sectors, energy supply and energy networks where 36% of international visitors were attracted by the wildlife, and
in South Africa will undergo more intense stress from extreme 33% by scenic beauty.
weather events. Economic impacts of shifts in household and firm
energy demand (see chapter on energy) are difficult to predict and will Increasing risk of malaria is expected to reduce the numbers of visitors
mostly lead to redistribution effects. in South Africa, as they will opt for areas free of the disease. No exact
projections have been estimated for the losses to the sector under
In the case of South Africa, the magnitude of the increase in demand different climate change scenarios, but clearly the magnitude of
for cooling is expected to exceed by far the one of the (tiny) decrease losses would be large. Given that 36% of visitors were motivated by
in heating demand, hence a significant increase in energy bills is wildlife, South Africa stands to lose 3.6% of GDP, or €9 billion if this
expected. resource was completely eradicated by climate change. The exact
contribution of biodiversity to the sector is difficult to calculate, but it
is suggested that biodiversity losses could cost the tourism sector at
IMPACTS ON TOURISM least 0.23 billion EUR per year.
The tourism sector has grown considerably in South Africa over recent
decades, and is now a key component of GDP: roughly 11%, or 27.5 Additionally, rising temperatures and changing rainfall patterns could
billion EUR. The sector is highly reliant on nature-based activities and alter the length of the tourist season, with knock-on effects for related
hence is extremely sensitive to any changes in the climate and any industries such as transport, restaurants, crafts and other tourist
losses to habitats and biodiversity. The country's unique natural dependent business services such as tour guides.
resources are the primary attraction for tourists visiting South Africa,SOUTH AFRICA
POLICY
OVERVIEW INTERNATIONAL COMMITMENTS
South Africa is the 15th largest emitter among G20 South Africa ratified the Paris Agreement and submitted its NDC in
countries, and the 9th in terms emissions per capita. 2016, with the target of reaching peak carbon emissions by 2030.
Emissions have increased significantly in recent deca-
des.
CLIMATE POLICY
COMMITMENTS CHRONOLOGY
320 521
MtCO2eq MtCO2eq
2002 KYOTO PROTOCOL - 1ST PERIOD
No target
2016 PARIS AGREEMENT - 1ST NDC
Peak GHG emission by 2030
2021 PARIS AGREEMENT - NDC UPDATE
Annual emissions in a range of 398-510
MtCO₂eq. in 2025 and of 350-420 MtCO₂eq. in
2030
1990 GHG EMISSIONS 2018
INTERNATIONAL CLIMATE In 2017-2018 South Africa received 900 million USD in climate-related development finance,
according to the OECD DAC’s data. More than half comes from multilateral channels, whereas
FINANCE ASSISTANCE Germany is the main bilateral donor. The majority comes in the form of debt and equity instru-
ments.SUSTAINABLE RECOVERY POLICY ADAPTATION POLICY HIGHLIGHTS
South Africa allocated 44.14 billion USD to total public spending in TRANSNATIONAL INITIATIVES
2020. Out of this amount, the Global Recovery Observatory reported
2.45 billion USD in recovery spending. Only a small fraction, amoun- Africa Adaptation Initiative
Others: 4.387
ting to 100 million USD, is labelled as sustainable Billionmainly
spending, USD The AAI aims to enhance action on adaptation, with the aim of addres-
dedicated to green infrastructure and nature conservation. sing the adaptation financing gap, and implementing measures to
address disaster risk reduction and resilience needs in Africa.
NATIONAL INITIATIVES
The Adaptation Network
The Adaptation Network is a platform for sharing experiences, practi-
44.14 2.45 0.1 cal approaches and frameworks relating to climate change adaptation.
billion $ billion $ billion $
Membership includes representatives from civil society, government,
Total Spending Recovery Spending Green Spending parastatals, academia and business
Reducing Disaster Risks from Wildfire Hazards
DOMESTIC ADAPTATION POLICY Associated with Climate Change in South Africa
The project aims at reducing the country's environmental, social and
South Africa included adaptation in its NDC. The country adopted a economic vulnerability to the increased incidence of wildfires, through
dedicated National Adaptation Strategy, while the planning is delega- a biome-scale change in the fire management approach (from reactive
ted to sub-national administrations. No sectoral plans are foreseen in fire-fighting to proactive fire management)
this legal framework.
SUBNATIONAL INITIATIVES
City of Cape Town Climate Change Strategy
Inclusion of Adaptation in NDCs The draft strategy contains 35 goals. For adaptation, they focus on
rising temperatures, water scarcity, flood risk and storm damage,
Domestic Integrated Adaptation & Mitigation Policy coastal erosion, sea level rise, and fire risk.
Adaptation Policy Dedicated Adaptation Strategy Building resilience in the greater uMngeni catch-
Dedicated Adaptation Plan ment
The project aims to increase resilience of vulnerable communities in
the uMgungundlovu District of KwaZulu-Natal, through interventions
Sectoral Adaptation Plans such as early warning systems, climate-smart agriculture and climate
Subordinate
Adaptation Policies proofing settlements.
Subnational Adaptation Plans
Policy not in place Active policy
ENERGY TRANSITION
South Africa has yet to strengthen its efforts to transform its energy sector, and align Energy Transition Fossil Fuels
itself with the trajectories of the most virtuous G20 countries. This analysis is confir-
med by the fact that South Africa ranks below the group’s average in all the five
58.7 45.3
indicators considered in the analysis. Reliance on fossil fuels and a still partial
process of electrification are two of the main problems affecting South Africa. In the
first case the key role of coal in the energy and electricity mixes is not yet sufficiently 53.1 44.5
offset by the penetration of renewables, although it must be noted that South Africa
has a limited hydroelectric capacity compared to other G20 members, even though
– due to a significant solar and wind potential - interesting efforts are already taking Renewables Efficiency
place. Similarly, when it comes to Electrification, the performance of the country has
to be contextualized in the African continent, where electrification is extremely low 19.7 84.9
and South Africa represents a positive regional exception. The massive use of coal is
also the cause of negative results in terms of Emissions, a sector in which South 12.1 76.1
Africa has the lowest ranking, while poor Efficiency performances are determined by
the limited access to modern forms of energy for parts of the South African popula-
tion and by inefficient energy transportation networks.
Electrification Emissions
Only actively pursuing an energy transition based on decarbonization and
electrification – from policy and regulation, to72.9
health and education – will
enable countries to benefit the most from future opportunities and fight 70.8 72.9
G20 AVERAGE climate change whilst ensuring an equitable distribution of wealth.
COUNTRY
The Energy Transition indicators were developed by Enel Foundation in 65.2 67.6
cooperation with SACE, and provide a retrospective analysis based on
historical data.You can also read