FY2021 2nd Quarter Progress of Business Strategy - Akira Nozaki President and Representative Director
←
→
Page content transcription
If your browser does not render page correctly, please read the page content below
November 18, 2021

FY2021 2nd Quarter
Progress of Business Strategy

President and Representative Director
Akira Nozaki

Briefing contents

 I.   Summary
 II. FY2021 financial forecast
III. Topics of each business segment
IV. Promotion of activities aimed at realization of
    “Vision for 2030”
 V. Next 3-Year Business Plan
VI. Supplementary materials
                                                      2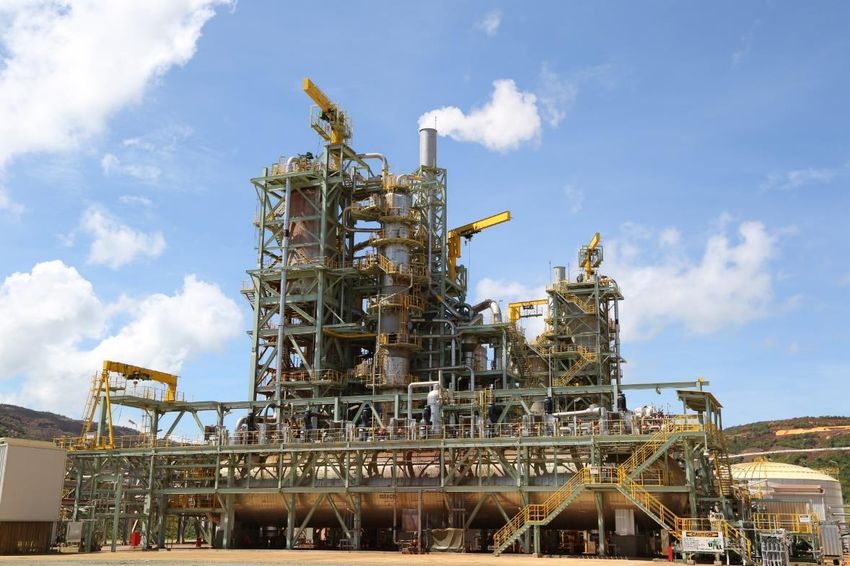
Briefing contents

 I.   Summary
 II. FY2021 financial forecast
III. Topics of each business segment
IV. Promotion of activities aimed at realization of
    “Vision for 2030”
 V. Next 3-Year Business Plan
VI. Supplementary materials
                                                      3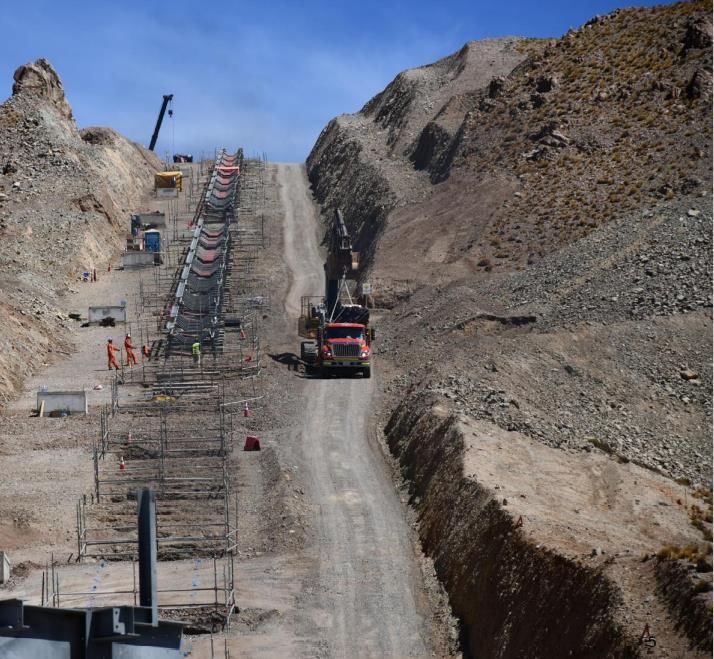
Summary ① FY2021 review of 1H (production / sales / projects)
[Production / sales]
➢ Generally strong sales environment on the back of economic recovery
  following the progress in vaccination rollouts
➢ No material impact of the COVID-19 pandemic on production thanks to the
  measures taken to stop the spread of infections and the efforts to continue
  operating in each plant
➢ Year-on-year revenue growth continues helped by high metal prices
[Large projects]
➢ Sierra Gorda: Decided to sell all our equity interests
➢ Côté: Initial construction project costs rose 25% although construction is
  progressing smoothly
➢ QB2: Construction staff recovered to the pre-COVID level (over 10,000)
➢ Pomalaa: External factors affecting the progress in project consideration
➢ Battery materials: Decided to enhancement including the construction of new
  plants
                                                                                4
Summary ② FY2021 review of 1H (capital expenditure / financial forecast)

[Capital expenditure]
   CAPEX plans have generally been pushed back due to COVID-19;
   however, there is no change to the promotion of the growth strategy
   announced in the 2018 3-Year Business Plan
[Financial forecast]
➢ The impact of the transfer of our equity stake in the Sierra Gorda copper mine is
  estimated at approx. ¥70 billion on a pre-tax profit basis (on the premise that the
  sale will be completed in March 2022).
➢ Despite negative factors such as smaller output in some overseas copper mines
  and the resulting cost increase, a significant profit growth is forecasted compared to
  the May forecast due to factors such as the maintenance of stable operations during
  the COVID-19 pandemic, a profit growth in the materials business, positive market
  factors, and the impact of the sale of the equity stake in Sierra Gorda.
  FY2021 consolidated pre-tax profit is forecast to be a record high at ¥266 billion.

                                                                                       5
Summary ③ Recent management themes (1)
 [Response to social issues]
1) Carbon neutrality (Risk of not being selected, technological development / application difficulties)
   ⇒・Promote introduction of renewable energy; seek energy efficiency
    ・Develop/supply products that help reduce GHG emissions
    ・Internal carbon pricing system
2) Digital transformation (Risk of losing competitive edge, security risk)
  ⇒・DX Promotion Committee (launched in Apr. 2021; chaired by President)
    ・Improve data analysis accuracy in the existing plants
        ⇒ reduce losses and raise yields
3) Human resource strategy (Securing / fostering / utilization of human resources)
    (Risk of decline in business vitality)
   ⇒・Brand communication focusing on securing human resources
    ・Promote the “Shikinen Kaikaku Project”(The fixed period Reform Project)
    ・Overhaul of HR/remuneration systems ・Head office renovation
                                                                                                          6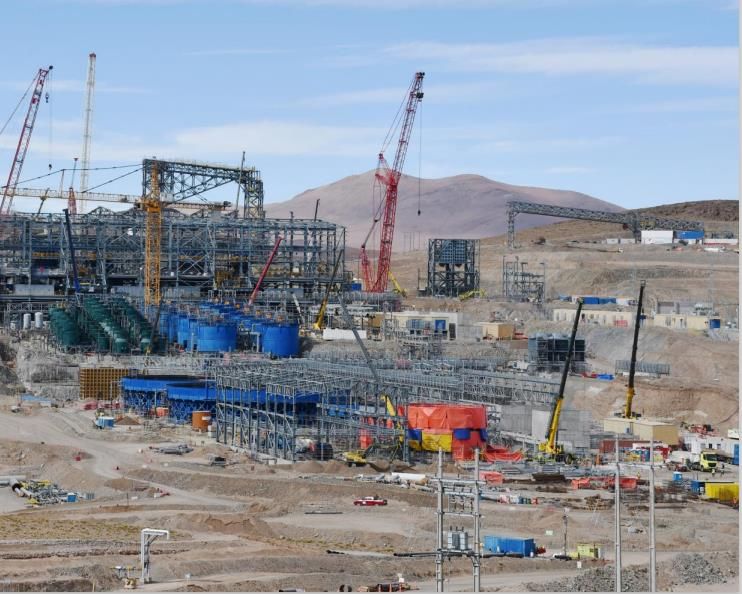
Summary ③ Current management themes (2)
[Enhancing management foundation]
   ✓Employees’ safety and health (← Failed to reach the targets set in the
    2018 3-Year Business Plan)
   ✓ Environment
   ✓ Compliance
   ✓ Corporate governance
[Promoting growth strategy]
   ✓ Three major projects in the 2018 3-Year Business Plan (QB2, Pomalaa, battery
    materials) → Address the business environment and resource nationalism
   ✓ Pathways to further growth (→ 2021 3-Year Business Plan)

 “7 competitiveness”                               Realize
  nurtured by Sumitomo’s business spirit
      (page 28, Integrated Report 2021)
                                           ”Vision for 2030”
                                                                               7
Summary ④ Safety initiatives

  2018 3Y Plan was to limit accidents to                 5 or less⇒2021 result: 19 (as of Nov. 11)
      A fatal forklift accident occurred in June 2021 in a domestic subsidiary
➢ Go back to the basics and ensure compliance with rules and practicing of basic actions
➢ Further promote safety improvement and enhancement of facilities through effective risk assessment
➢ Observation of operations will give insight into on-site realities, and it will be possible to move forward
  with corrections or measures.

                2018 3-Yr Business         Limit domestic occupational accidents to 5 or less (2021 result: 19)
                   Plan Targets            Limit overseas occupational accidents to 3 or less (2021 result: 2)
     (Cases)        64 cases
                                 Change in number of occupational accidents within Japan                19 cases in 2021
        80           (2000)
                                                                                                          (as of Nov. 11)
                                                                                                    14 more than 2018 3Y Plan
        60
                                                                            2020 result: 15 cases             target
        40
        20
         0
                                                                                                        ・     2018 3-year Plan
                                                                                                               target: 5 cases

             1998              2002         2006            2010            2014             2018                 2018 3-year
                                                                                                                  Business Plan

                                                                                                                                  8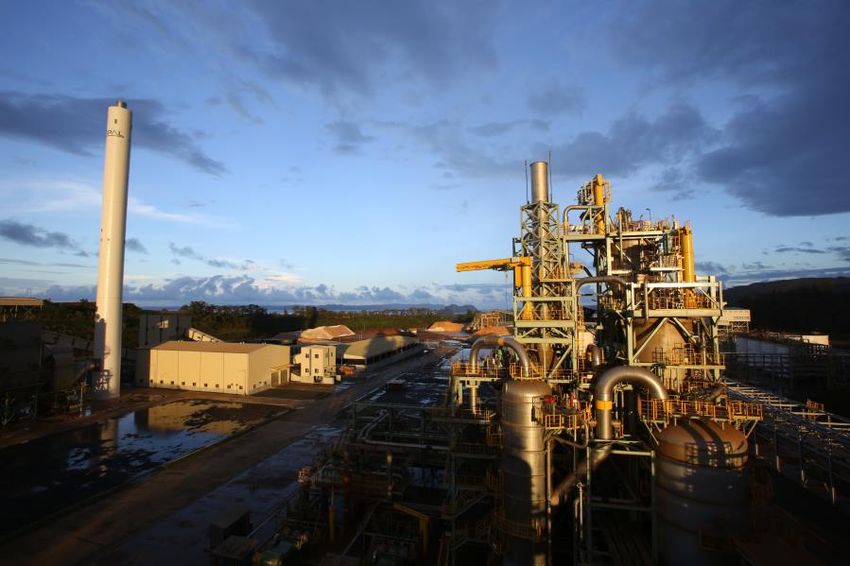
Briefing contents

 I.   Summary
 II. FY2021 financial forecast
III. Topics of each business segment
IV. Promotion of activities aimed at realization of
    “Vision for 2030”
 V. Next 3-Year Business Plan
VI. Supplementary materials
                                                      9
1) Change in financial results (FY2015 - FY2021 forecast)
                                                Japanese Standards [J-GAAP]                                                 International Financial Reporting Standards [IFRS]

                        (Billions of yen)                                                                                                                                        2021 Forecast
                                              2015                 2016                2017                  2017                  2018              2019          2020
                                                                                                                                                                                     (Nov)
   Net sales                                       855.4              786.1                933.5                  929.7                 912.2        851.9 (*2)       926.1              1,175
   Operating profit                                 59.7                76.4               110.2                       -                     -               -             -                -
   Recurring profit/loss                           -12.8                 -1.6              124.9                       -                     -               -             -                -
   Profit/loss before tax                             0.6                   -6             105.8                  108.3                   89.4               79       123.4                266
   Equity method
   profit/loss
                                                   -73.2                  -86                11.4                   12.3                   -4.9             6.2            8.7              46

                   Mineral resources               -44.3               -53.6                    56                    58                  47.3            37.9            65.3             184
  Segment Profit

                   Smelting & refining              25.3                33.3                 51.5                   47.8                  40.9            48.2            55.8              73
                   Materials                             6              12.1                 15.3                     7.1                 13.8              5.3           11.3              18
                   Other                             -0.8                -0.1                  0.2                  -7.4                      -2            -0.9          -2.8              -2
                   Diff. Adjustment                      1                6.7                  1.9                    2.8                -10.6           -11.5            -6.2              -7
                   Net profit/loss (*1)              -0.3              -18.5                 91.6                   90.2                  66.8            60.6            94.6             214
   Copper (USD/t)                                  5,215              5,154                6,444                  6,444                 6,341            5,860        6,879              9,071
   Nickel (USD/lb)                                  4.71                4.56                 5.06                   5.06                  5.85            6.35            6.80            8.14
   Gold (USD/Toz)                                  1,150              1,258                1,285                  1,285                 1,263            1,462        1,824              1,751
   Cobalt (USD/lb)                                 11.73              13.67                30.64                  30.64                 31.64            15.76        16.62              21.21
   Exchange (JPY/USD)                            120.15              108.40              110.86                 110.86                 110.92           108.74       106.07             109.90

                                            (*1) Profit attributable to owners of parent.
                                            (*2) Changes in accounting policies regarding materials supplied for a fee were retroactively applied.                                               10
2) FY2021 financial forecast (November forecast vs May forecast)
2021 1H Results 2021 2H Forecast FY2021 Forecast (Nov.) FY2021 Forecast (May) Difference
(Billions of yen)
Net sales 597.9 577.1 1175 1047 +128
Sales total profit 114.7 83.3 198 150 +48
Profit/loss before tax 121.7 144.3 266 138 +128
Equity method
profit/loss 24.4 21.6 46 40.5 +5.5
Mineral resources 67.4 116.6 184 89 +95
Segment Profit
Smelting & refining 50.2 22.8 73 37 +36
Materials 13 5 18 11 +7
Other 0 -2 -2 -2 0
Diff. Adjustment -8.9 1.9 -7 3 -10
Net income attributable
to owners of parent
113.8 100.2 214 104 +110
Copper (USD/t) 9,541 8,600 9,071 7,800 +1,271
Nickel (USD/lb) 8.27 8.00 8.14 7.00 +1.14
Gold (USD/Toz) 1,803 1,700 1,751 1,700 +51
Cobalt (USD/lb) 22.43 20.00 21.21 15.00 +6.21
Exchange (JPY/USD) 109.8 110.0 109.9 107.0 +2.9
113) Profit before tax analysis FY2021 November forecast vs May forecast
(Billions of yen)
3,000
300
Ni/Co price Au price, etc.
+19.4 +1.5 Materials
Cu price
Business Cost
2,500
250 +35.7 Foreign Inventory +7
Other
exchange evaluation difference -6.3
Impact of -18.6
Sierra Gorda +5.1 +14.2
transfer +70
200
2,000
200
1,500
150
Market factors +75.9
266
1,000
100
138
Cost difference
500
50
Candelaria: reduced output; Cerro Verde: Higher unit cost due to lower grades
Taganito: Higher unit cost due to reduced output
0
5月予想
May forecast 11月予想
November
FY2021 financial forecast forecast
124)Trend of Financial Position
(Billions of yen) 総資産
Overall assets 有利子負債debt
Interest-bearing 自己資本
Capital equity 自己資本比率
Capital equity ratio ROA (%)
22,500
2,250 100.0
20,000
2,000
4)
(2021 2Q result)
Capital equity 75.0
17,500
1,750
ratio
15,000
1,500 財務
Capital
reference
60.6%
50.0
12,500
1,250
状況
equity ratio
62.9%
D/E ratio
10,000
1,000
の推
D/E ratio
0.26
reference
0.37 25.0
7,500
750
5,000
500
移
ROA
11.8% 0.0
ROA
2,500
250 reference
4.8%
0 -25.0
2012年度
FY2012 2013年度
FY2013 2014年度
FY2014 2015年度
FY2015 2016年度
FY2016 2017年度
FY2017 2018年度
FY2018 2019年度
FY2019 2020年度
FY2020 2021/2Q
FY2021 18中計
2018 3-year Business plan
/2Q 2021年度
FY2021 (Trial calculation)
(試算)
Note: Based on Japanese Standards up to FY2017 and IFRS from FY2018.
135) Capital expenditure plan (FY2021)
2018 3-year Business Plan FY2021 Plan (Nov.) FY2021 Plan (May)
(3-year total)
R&D, (Billions of yen) R&D, (Billions of yen) R&D, (Billions of yen)
Other Other
Mineral Other
Mineral
27 Resources Mineral
Materials Materials 7.1 Resources
Materials
7.8 Resources
72 8.7 12.1 29.8
78.1 33.3 85.6
68 330
billion billion billion
yen yen yen
29.0 35.9
163 Smelting Smelting
Smelting
and refining and refining
and refining
・Cote Gold Project 20.4 billion yen (Total amount USD536 million)
・ Increased production of cathode materials for vehicles (Besshi district + Harima Refinery)
500 million yen (total amount 47.0 billion yen)
Investment and financing ・Expansion and improvement of Battery Research Laboratories 1.4 billion yen (1.6 billion yen)
Main projects ・Besshi-Niihama District Div. newly established company dormitory 1.0 billion yen (4.7 billion yen)
(QB2, etc. 160 billion yen) (Values in parentheses are ・Development of lower orebodies at Hishikari Mine 400 million yen (Total amount 3.7 billion yen)
planned total amounts) ・Switch to LNG boilers *200 million yen (800 million yen)
*Internal carbon pricing applicable project
Disclosures related to the Pomalaa project will be made individually as our company has reached a judgement on the investment decision.
146) Capital expenditure / Investment and financing plan
(comparison with 2018 3-year Business Plan)
FY2019, FY2020
Total 163.9
result 58.1 69.4 23.3 13.0 +
FY2021 Plan Investment and
financing 87.7
Total 330
2018 3-year +
Business Plan 72 163 68 27
(3-year total) Investment and
financing 160
0 50 100 150 200 250 300 350
(Billions of yen)
Mineral Resources Smelting and refining Materials R&D, Other
The effect of postponing investment periods due to COVID-19 (Pomalaa, condensing investments, etc.)
and the utilization of project finance in the QB2 project led to a rate of progress of approx. 50%
157) Cashflow (FY2021 1H results)
Cash flow from
225.0 Cash flow from
investment
operating activities
activities
200.0 +36.9 Free cash flow
-34.9 Cash flow from
+2
financial activities
175.0
-39.2
150.0 Fluctuation
amount
125.0 158.4 +3.6
(Of which, dividend payments are -27.2)
124.8
100.0
Balance at term start Balance at term end
(End of FY2021 2Q)
(Billions of yen) (FY2020 end)
Cash outflows preceded profit recovery as metal prices rose
We will continue promoting the growth strategy set out in the 2018 3-Year
Business Plan and will execute spending that has been postponed
168) Shareholder return (dividend forecast: FY2021)
Dividend payout ratio 35% or higher Record high dividend
200 184 (forecast) 50%
Year-end
dividend 150 71 40%
100 30%
78 121
(Forecast)
Interim 100
73 20%
dividend
66 22 39 99 113
50 22 10%
Dividend
34 51 39 22
payout ratio 0 0%
Dividend amount FY2016 FY2017 FY2018 FY2019 FY2020 FY2021 Dividend
forecast payout ratio
(yen/share)
Note: Due to a reverse stock split (in 2-1 ratio) executed on October 1, 2017, the dividend per share before that date is calculated and
presented based on the standard after the reverse stock split.
➢ The schedule for the sale of SMM’s equity stake in Sierra Gorda (SG) has not been fixed. The sale may not be executed until FY2022.
The projected annual dividend (184 yen) is therefore calculated excluding the 70-billion-yen impact of the sale (payout ratio: 35.1%).
➢ The impact of the sale of SMM’s stake in SG includes an amount equivalent to the gain on the reversal of the loan loss provision
arising from the application of the revised IAS No. 28. This was posted as an adjustment at beginning of period when the provision was
recognized and was not processed through the income statement. As a result, the dividend to be disclosed after the determination of
the sale date will maintain the consolidated payout ratio of 35% or over when excluding this amount.
➢ Of the 70-billion-yen impact, the amount equivalent to the reversal gain is currently estimated at around 40-50 billion yen.
17Briefing contents
I. Summary
II. FY2021 financial forecast
III. Topics of each business segment
IV. Promotion of activities aimed at realization of
“Vision for 2030”
V. Next 3-Year Business Plan
VI. Supplementary materials
181) Mineral resources ① Sierra Gorda Copper Mine
◆ On October 14, we announced the transfer of our
equity stake to South32 Ltd.
Estimated impact: +70 billion yen (pre-tax profit)
(On the assumption that the sale will be completed before March 31, 2022)
➢ Improved operation, turned around results, increased the
mine’s attraction ⇒ Agreed on an appropriate sale price
(USD1,190M)
➢ Part of a company-wide portfolio review
(Billions of yen) Equity-method profit/loss Output Copper output
(kt)
50
500 200(kt)
0
0 150
100
-50-500
50
-100
-1,000
0
-1,500
-150
2014 2015 2016 2017 2018 2019 2020 2021
2014 2015 2016 2017 2018 2019 2020 2021 (Full-year
(Up to 2Q) forecast)
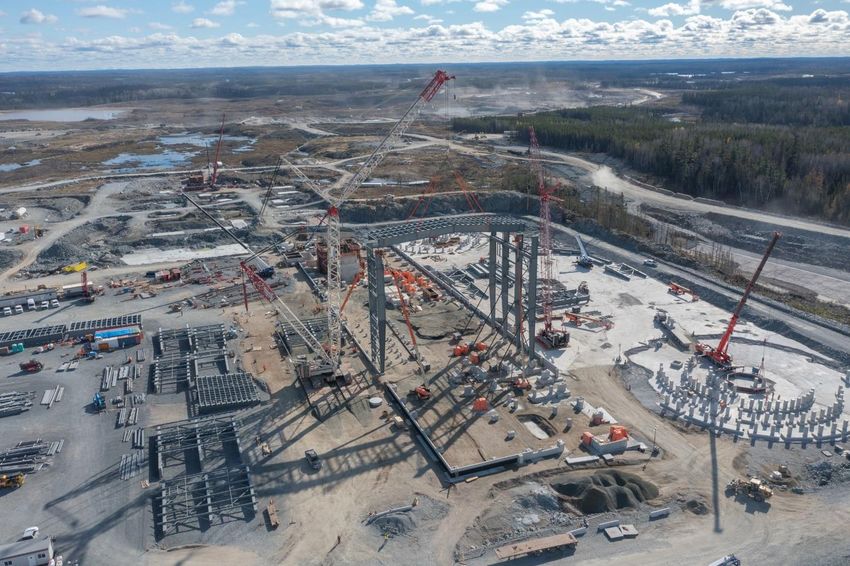
191) Mineral resources ② QB2 Project (progress / schedule moving forward)
◆ Construction continues accelerating toward the production commencement in
the second half of 2022 (over 65% of progress)
• Over 10,000 workers are currently mobilized
• Continuing stringent COVID-19 measures
◆ No change to initial construction costs of USD5.2 billion; added USD600M as
the cost of COVID-19 influence
Conveyor
installation Mill
201) Mineral resources ③ Cote Gold Project (progress / schedule moving forward)
◆ Initial construction costs rose from
USD1.42 billion to USD1.79 billion
due to changes in construction
specification details, changing
economic environment, etc.
◆ Confirmed additional resources in
the nearby Gosselin zone (157 t)*
◆ Continue working toward
production commencement in
2023
*Total of indicated and inferred mineral resources
June 2017 July 2020 September 2020 October 2023 Mine life 18 years
Acquisition of Decision Made to Start Groundbreaking Start of Construction Scheduled Start
Interests Construction Ceremony in Earnest of Production
211) Mineral resources ④ Hishikari Mine
◆ Operations
• As laid out in the 2018 3-year Business Plan,
yearly production of 6.0 t is being stably
maintained.
Currently achieving steady output.
• The reserve at the end of 2020 was 159 t.
◆ Lower orebody development
• To drop hot water about 30 m (-32 ML to
10 ML above sea level), a new hot water
extraction room is being constructed at
-80 ML.
Boring to extract hot water began in
January 2021.
Boring to extract hot water
221) Mineral resources ⑤ Overseas copper mines (Morenci, Cerro Verde, Candeleria)
◆ Morenci
・FY2021 output forecast: 401 kt/year (May plan: 368 kt/year)
・Began measures to increase output incl. the partial resumption of a mill
and additional output in response to the reduced impact of COVID-19
◆ Cerro Verde
・FY2021 output forecast: 393 kt/year (May plan: 409 kt/year)
・Increasing processing volume to make up for the lower grades of iron ore
◆ Candeleria
・FY2021 output forecast: 135 kt/year* (May plan: 175 kt/year)
・Due to concerns over the stability of some mining spots
*Combined with output of Ojos del Salado
232) Smelting and refining ① Pomalaa project (Investigation / Initiatives moving forward)
Continuing procedures/discussions for
prompt investment decision-making
Our third HPAL project following CBNC
and THPAL in the Philippines
• Production estimated at 40 kt-Ni/year. Sorowako
• 150 kt laid out as a milestone in the long-term vision. South Sulawesi
Supply of raw materials for Class 1 nickel smelting and Pomalaa
refining, which is anticipated to expand due to demand for South East Sulawesi
xEV.
• It is taking some time to obtain the necessary permits and
consult with partners due to the impact of COVID-19. Sulawesi Island, Indonesia
• LNG power generation being considered as a means of
reducing GHGs.
242) Smelting and refining ② Domestic smelters
➢ Toyo Smelter & Refinery:
Began a scheduled one-month shut-down from October
Planned output of 424 kt of electrolytic copper in FY2021
➢ Niihama Nickel Refinery: Planned output of 54.0 kt of electrolytic nickel in
FY2021
➢ Harima Refinery/Niihama Nickel Refinery:
Continue producing nickel sulfate at full
capacity in response to the growing demand
for batteries
Plan a record output of 79.7 kt in FY2021
➢ Hyuga Smelting Co., Ltd.: Planned output of 13.0 kt
of ferronickel in FY2021
252) Smelting and refining ③ CBNC/THPAL
• Planned output of 19.4 kt in FY2021
• Temporarily reducing the operation
level due to the impact of COVID-19
• Planned output of 29.6 kt in FY2021;
the output is reduced due to the impact
of a boiler facility trouble
• Start chromite sales (as a material for
stainless steel) in FY2021
263) Materials: Battery materials ① Market trends / Effect on our company, etc.
(1,000 vehicles/year)
Electric car market estimate
25,000
20,000
15,000
10,000
5,000
0
CY2019 CY2020 CY2021 CY2022 CY2023 CY2024 CY2025
MHV HEV PHEV BEV (B3 report /July 2021) Ternary cathode material (NMC)
The entire electric vehicle market is recovering strongly in FY2021.
Sales of battery electric vehicles (BEV) is especially robust in China and Europe.
273) Materials: Battery materials ② Enhancing production capacity (Current status and outlook)
Enhancement to production capacity of
cathode materials (NCA) (monthly output) 2,000t Ni
*Year in which investments for production capacity enhancement are made (Ni cathode
material)
cathode
material
total
10,000 t
3,550t 4,550t 4,850t
1,850t
(Production capacity) 300t 850t
(Investment amount) ¥4.8bn ¥15bn ¥18bn ¥4bn ¥47bn 2024 3Y Plan
(Year in which investment decision is made) 2020 (FY2027) target
2013 2014 2016 2017
2021
・In July 2021, SMM decided to make an investment for increasing production capacity by 2,000 t in the
Niihama district (Ehime Pref.) ⇒ Will consider capacity increase in the next term examining issues such as
locations and product types in line with the next 3-Year Business Plan.
・The expansion and upgrading of the Battery Research Laboratory are scheduled to be completed in July 2022.
283) Materials: Advanced materials ① Market trends
✓ FY2021 1H: Although smartphone and car sales were smaller than expected due to
semiconductor shortages and COVID-19’s impact, sales of advanced material rose
year-on-year thanks to factors such as an increase in 5G smartphones, progress in
digitalization, and recovery in capital investment.
✓ 2H / medium- and long-term outlook: Demand for all products is expected to
increase on the back of the progress and upgrading in digitalization, albeit there
will be a temporary phase of inventory adjustments.
Growing demand for advanced
◆ Progress/upgrading in digitalization materials
[Global demand for electronic parts] *Benchmarked to 2015 as 100
140%
120%
100%
80%
60%
40%
20%
0%
2015 2016 2017 2018 2019 2020 2021 2025
Forecast Forecast
Source: Prepared and estimated by SMM referring to data compiled by research institutes and others
293) Materials: Advanced materials ② Advanced ink (NIR absorbing material)
◆ CWO® (Cesium tungsten oxide)
✓ Has a superior weather resistance with a combination of
high permeability of visible light and strong absorption
capacity of near infrared rays (NIR)
✓ New chemical substance for which SMM has a patent
➢ Major car window film maker is using CWO®
➢ New market cultivation: Supply samples to leading makers
(Million ㎡) Window Film Market Estimate
・Clothing (heat generating fabric)
Groth per year: 9%
・Agriculture (light adjusting net for
green houses)
・3D printer (optical catalyst)
・Security printing (IR recognition)
Source: Prepared and estimated by SMM referring to data compiled by research institutes and others
303) Materials: Advanced materials ③ SiC substrate development
◆SiC (silicon carbide): Semiconductor material used in power semiconductors.
Shows superior attributes in the high temperature, high frequency, and high
voltage environment.
◆ Bonded SiC substrates produced by Sicoxs Corporation
➢ Lower cost than single-crystal SiC due to the use of cheaper support substrates.
➢ Reduced resistance and increased strength of overall substrates while maintaining
the attributes of single-crystal SiC.
◆ Scheduled to begin commercial production in FY2021 with the aim of
producing 10,000 SiC wafers a month (if 6 inches in diameter).
SiC power Device Market
(SMM Estimate)
31Briefing contents
I. Summary
II. FY2021 financial forecast
III. Topics of each business segment
IV. Promotion of activities aimed at realization of
“Vision for 2030”
V. Next 3-Year Business Plan
VI. Supplementary materials
321) Efforts after expressing support for TCFD (Task Force on Climate-related Financial Disclosures)
Page 72, 2021 Integrated Report
Disclosed the results of a climate change scenario analysis in Integrated Report 2021
➢ Conducted a scenario analysis for 1.5- and 4-degree Celsius rises in the average world temperature;
identified risks and opportunities
➢ ICMM commitment
Support the ICMM’s commitment to “build clear pathways by 2023 to achieving net zero GHG emissions by
2050 or sooner” ⇒ It is important to accelerate our actions to achieve carbon neutral
332) Progress of other key measures and future schedule
Vision for 2030 A company that understands and respects the traditions and culture of indigenous
peoples
Promote an understanding of indigenous people
Let’s learn about
➢ July 2021: Created and distributed an educational video “indigenous people”
to officers and employees of the SMM Group together
(Over 4,000 people in the Group have watched the video Sumitomo Metal Mining
in Japan and overseas as of November 2021.)
⇒ Endeavor to promote an understanding in the Company
Vision for 2030 A company that undertakes responsible sourcing across the supply chain
March 2021: Completed a third-party audit of refineries producing cobalt
(Niihama Nickel Refinery, Harima Refinery)
➢ Rise in customer inquiries regarding “responsible mineral sourcing” and
“CSR sourcing”
Electrolytic cobalt
⇒ Continue providing responses speedily and accurately
34Briefing contents
I. Summary
II. FY2021 financial forecast
III. Topics of each business segment
IV. Promotion of activities aimed at realization of
“Vision for 2030”
V. Next 3-Year Business Plan
VI. Supplementary materials
35V. Next 3-Year Business Plan (2021 3-Year Business Plan)
Period covered: FY2022 – FY2024 (three years)
Release time: Mid-February 2022 (scheduled)
➢ Continue the Long-Term Vision of the 2018 3-Year Plan
➢ Develop strategies for further growth in the core
businesses of Mineral resources, Smelting & Refining,
and Materials
➢ Effective responses and measures for (recent and
future) management challenges
36(Notification) Special sponsor of Special Exhibition POMPEII
The Special Exhibition POMPEII, will be held
from January 14, 2022 to April 3, 2022, at the
Tokyo National Museum in Ueno
The exhibition will then travel to Kyoto, Miyagi
and Fukuoka
The exhibition will feature many works that use
non-ferrous metal such as copper and gold
37Briefing contents
I. Summary
II. FY2021 financial forecast
III. Topics of each business segment
IV. Promotion of activities aimed at realization of
“Vision for 2030”
V. Next 3-Year Business Plan
VI. Supplementary materials
381) Trends in supply and demand (copper and nickel)
Copper
[ISCG forecast of April 2021] (kt)
2020 2021 (forecast) 2022 (forecast)
Production 24,510 24,920 25,886
Usage 24,989 24,963 25,558
Balance -479 -42 +328
Nickel (kt)
INSG forecast in October 2021 SMM forecast in August 2021
2021 2022 2021 2022
2020 2020
(forecast) (forecast) (forecast) (forecast)
Production 2,491 2,639 3,120 2,507 2,682 3,016
Usage 2,384 2,773 3,044 2,379 2,776 2,978
Balance +107 -134 +76 +128 -94 +38
392) Metal price and foreign exchange
Price (USD/t)
Change in market price of copper Price (USD/lb)
Change in market price of nickel Inventory (t)
Inventory (kt)
LME COMEX SHFE LME Cash 25 600,000
USD/T KT
2,000 SHFE inventory
10,000.00 500,000
1,800 20
1,600 LME inventory
8,000.00 400,000
1,400 15
1,200 Ni LME price
6,000.00 300,000
1,000
10
800 200,000
4,000.00
600
400 5
2,000.00 100,000
200
0.00 0 0 0
(JPY/USD)
(USD/Toz) Change in market price of gold Foreign exchange (USD/EUR)
2,000 130.00 1.70
120.00 1.60
1,500
110.00 1.50
100.00 1.40
1,000
90.00 1.30
500 80.00 ¥/$ 1.20
70.00 $/EUR 1.10
0
60.00 1.00
403) 2Q FY2021 financial highlights (YoY change)①
2021/2Q Cumulative 2020/2Q Cumulative Difference
(Billions of yen) (A) [IFRS] (B) [IFRS] (A) - (B)
Net sales 597.9 *1 406.7 +191.2
Sales total profit 114.7 56.2 +58.5
Profit/loss before tax 121.7 25.9 +95.8
Equity method profit/loss 24.4 -4.4 +28.8
Mineral resources 67.4 12.1 +55.3
Segment Profit
Smelting & refining 50.2 15.2 +35
Materials 13 1.7 +11.3
Other 0 -0.3 +0.3
Diff. Adjustment -8.9 -2.8 -6.1
Net income attributable to owners of parent 113.8 17.5 +96.3
Copper (USD/t) 9,541 5,931 +3,610
Nickel (USD/lb) 8.27 5.99 +2.28
Gold (USD/Toz) 1,803 1,811 -8
Cobalt (USD/lb) 22.43 14.84 +7.59
Exchange (USD/JPY) 109.81 106.92 +2.89
*1: Changes in accounting policies regarding materials supplied for a fee were retroactively applied. 413) 2Q FY2021 financial highlights (YoY change) ② Profit/loss before tax analysis
1,500 QB2 construction
suspension cost
Foreign +39
Ni・Co Exchange Inventory exchange
price Au Price etc. rate evaluation difference Cost
+149 +10 +4 +35 difference Others
Cu Price +44 Material
-54 -61
+679 Business
1,000 +113
1,217
500
259
0 Market factors +886
2020/1H 2021/1H
Profit before tax
424) Individual business overview Mineral Resource ① Copper (oversea copper mines)
Morenci Copper Mine (US) Cerro Verde Copper Mine (Peru) Candelaria Copper Mine (Chile)
FCX 72% FCX 53.56% Lundin 80%
Ratio of Ratio of SMM 16.80% Ratio of
SMM 25% SMM 16%
interests interests Sumitomo Corporation 4.20% interests
Sumitomo Corporation 3% Sumitomo Corporation 4%
Other 25.44%
• Production volume • Production volume • Production volume
FY2020 446 kt (results) FY2020 372 kt (results)
FY2020 123 kt (results)
FY2021 401 kt (plan) FY2021 393 kt (plan) FY2021 135 kt (plan)
Cu production volume (100%) Cu production volume (100%) Cu production volume (100%)
600 600 200
150
400
400
100
200
200 50
0 0
0 2018 2019 2020 2021 2018 2019 2020 2021
2018 2019 2020 2021 (Nov. plan) (Nov. plan)
(Nov. plan)
*Production volume reflects the total combined with that of Ojos del Salado
434) Individual business overview Mineral Resource ② Gold (Hishikari / Cote)
Hishikari Mine (Kagoshima Prefecture) Cote Gold Development Project (Canada)
Ratio of Ratio of IAMGOLD 64.75%
SMM 100% 27.75%
interests interests SMM
Other 7.50%
Acquisition amount: USD195 million (approx. 21.5 billion yen)
Location: Ontario
• F/S completed in November 2018
• Construction started August 2020
• Lower orebody development: Continued with safety-first policy • Production start scheduled from 2023
• Reserve: 159 t (based on JIS) at the end of 2020
• Production volume FY2021 6.0 t (Nov plan)
t
Au production volume Initial construction project costs USD1,785M
10.0
7.5 Mine life 18 years
5.0 Overall gold production volume 205 t
2.5
Reserve 233 Mt
0.0
FY2018 FY2019 FY2020 FY2021 Reserve grade 0.96 g/t
(Nov. plan)
(Initial construction project costs are quoted from a press release issued on Nov. 8, 2021. Other figures
are quoted from a press release issued on July 21, 2020.)
444) Individual business overview Smelting and refining ① Copper (Toyo Smelter & Refinery)
Toyo Smelter & Refinery
Production volume of electrolytic copper
FY2020 443 kt (results)
FY2021 421 kt (Nov. plan)
*Regular maintenance and repair work scheduled in FY2021
USD/t Cent/lb
TC/RC change (benchmark)
125 TC (USD/t) 12.5
Electrolytic copper production volume (left axis) Index:
100 RC 10 kt / Volume of collected secondary materials (right axis) 2015=1.0
(Cent/lb) 500 2.00
75 7.5 400
1.50
300
50 5
200 1.00
25 2.5 100
0 0.50
0 0 FY2017 FY2018 FY2019 FY2020 FY2021
2015 2016 2017 2018 2019 2020 2021 Nov. plan
Electrolytic copper (kt) Secondary materials (Index)
454) Individual business overview Smelting and refining ②Nickel
(CBNC, THPAL, Niihama Nickel Refinery)
CBNC, THPAL, Niihama Nickel Refinery
Production volume
FY2021
Unit FY2021
(Nov. FY2020 Difference Difference
Ni-kt (May plan)
plan)
CBNC 19.4 19.1 +0.3 20.0 -0.6
THPAL 29.6 29.4 +0.2 33.0 -3.4
Electrolytic nickel
54.0 55.9 -1.9 57.0 -3.0
(Niihama Nickel Refinery)
Ni-kt Electrolytic nickel
MS production volume Ni-kt
60
70 production volume
50 60 Maximize HPAL by product recovery
40 50
Scandium oxide:
30 40
30
Started commercial production from
20
20 January 2019
10 10 Chromite:
0 0
FY2018 FY2019 FY2020 FY2021
(Nov. plan)
FY2018 FY2019 FY2020 FY2021
(Nov. plan)
Sales planned to start in FY2021
CBNC THPAL
464) Individual business overview Smelting and refining ③ Nickel sulfate
(Niihama Nickel Refinery, Harima Refinery)
Niihama Nickel Refinery, Harima Refinery
Production volume of nickel sulfate (Total of Niihama Nickel Refinery and Harima Refinery)
FY2020 79.1 kt (result) a record high
FY2021 79.7 kt (Nov. plan)
Nickel sulfate kt
Nickel sulfate production volume
80.0
70.0
60.0
FY2018 FY2019 FY2020 FY2021
(Nov. plan)
474) Individual business overview Smelting and refining ➃Ferronickel
(Hyuga Smelting Co., Ltd.)
Hyuga Smelting Co., Ltd.
Production volume
FY2020 13.0 Ni-kt (results)
FY2021 13.0 Ni-kt (Nov. plan)
• Aim to maximize production volume using system Ni-Kt Fe-Ni production volume
15
of 2 kilns, 1 electric furnace
10
• Strive for cost reduction through stable production
and efficient operation, and secure profits 5
0
FY2017 FY2018 FY2019 FY2020 FY2021
(Nov. plan)
484) Individual business overview Materials
Battery materials
FY2021 1H results: Strong sales continued. Shift in sales
(Billions of yen) for materials business
FY2021 2H forecast: Strong sales are likely to continue with a favorable market. 300
250
Crystal materials
FY2021 1H results: Strong sales continued from the previous term. 200
FY2021 2H forecast: Demand is expected to sustain due to the growing 5G
smartphone market. 150
100
Powder Materials
FY2021 1H results: Strong sales continued on the back of solid demand. 50
FY2021 2H forecast: Solid sales are expected especially for commercial use; there
0
is a sense of uncertainty about some products. FY2019 FY2020 FY2021 (Nov.
forecast)
Battery materials
Package Materials Powder Materials
FY2021 1H results: Strong sales continued for smartphones, televisions, etc. Package materials
FY2021 2H forecast: Solid demand is likely to continue. Crystals, building materials,
connectors, others
*Sales of battery materials are calculated by retrospectively applying the
revised accounting policies regarding materials supplied for a fee.
494) Individual business overview Research & development ① Results
Change in research and
development expenses
(Millions of yen)
7,500 Material Business (material development)
[Battery materials]
7,000 • Research & development of higher performance battery cathode materials
• Customizing for solid state batteries
[Crystal materials]
6,500
• Cost reduction ahead of commodification
Achievement of improved productivity through crystal lengthening, larger bore, and
6,000 improved crystal growing/production yield, etc.
• Meeting new user needs
Large bore LT crystal growth technology established, now in user work
5,500
5,000 Smelting & Refining Business (process development)
[Lithium ion battery recycling]
4,500
• Succeeded in the PoC of a secondary battery recycling technology, which included
the recovery of cobalt.
4,000 Established a world-first, new recycling process incorporating the production of
FY2018 FY2019 FY2020 soluble slags from which lithium can be recovered.
504) Individual business overview Research & development ② Area/field
Development of mineral
resources and metal Materials development
process
Fundamental
Resource & Core technology
technology Cathode materials
Hydrometallurgy
Analysis Process Center for Lithium-ion Powder synthesis and
Technology Analysis technology secondary battery
Fundamental surface treatment
technology technology
Computer aided
Computer aided engineering and
engineering and
analysis technology Basic research
analysis technology
Fundamental Information and
technology communication
Information and technology (ICT)
製錬 Powder
communication Smelting Powder
technology (ICT) プロセス
and refining material
synthesis
技術
process basic
and surface
technology treatment research
technology
Core technology Exploration, Nickel powder for MLCCs
mining, and
Smelting and
refining process mineral Single-crystal Fundamental
technology processing lithium tantalate technology
technology Crystal
Powder material
Core technology growth and basic research
Exploration, mining,
processing
Core technology
and mineral processing technology
technology Crystal growth and
Sierra Gorda Copper Mine processing technology
Concentration on growth strategy fields, search for “seeds” of next-generation business
515) Sensitivity
(Billions of yen)
Up/Down of profit
Element Margin of change before tax for
FY2021
Cu ±100USD/t 2.4
Ni ±10Cent/lb 1.4
Au ±10USD/toz 0.2
JPY/USD ±1JPY/$ 2.2
Note: USD/JPY translation includes RC-related and conversion rate
of overseas consolidated/equity-method affiliate companies’ profit.
526) Targets and achievement of long-term vision
Cu (attributable production volume) Ni (annual production volume) *Quantity for long-term vision is production
capacity
kt Long-term kt Long-term
vision vision
300 300 kt
150 kt
250 kt 220 kt
150
200 100 87 kt 85 kt
100 50
0
0
FY2018 FY2019 FY2020 FY2021 FY2018 FY2019 FY2020 FY2021
(Nov. plan) (Nov. plan)
Materials business (segment profit) Net income
Profit Long-term Profit Long-term
Billions of yen vision Billions of yen vision
25 250
25 214
20 18 200
150
15 11.3 150 94.6
10 100
5 50
0 0
FY2018 FY2019 FY2020 FY2021 FY2018 FY2019 FY2020 FY2021
(Nov. (Nov.
forecast) forecast)
53Caution
The materials provided herein are not intended as disclosure under the Securities Law, and no
warranty is made as to their completeness or accuracy.
Any projections included in these materials are based solely on information available at the time
of this briefing, and are subject to change based on market conditions, competitive conditions, and
a number of other factors.
Therefore, we ask that you refrain from making any investment decisions based on these
materials alone. The Company cannot be held responsible in any way for any losses that may
occur as a result of the use of these materials.
All copyrights, trademarks, and intellectual property rights attaching to the materials herein are
the sole property of Sumitomo Metal Mining Co., Ltd.
Sumitomo Metal Mining Co., Ltd.
54https://www.smm.co.jp/
55You can also read