FY 2019 RESULTS 2020, February 25th - Investor Relations | Europcar Mobility ...

Page created by Stephen Coleman
 
CONTINUE READING
FY 2019 RESULTS 2020, February 25th - Investor Relations | Europcar Mobility ...
FY 2019 RESULTS
2020, February 25th
FY 2019 RESULTS 2020, February 25th - Investor Relations | Europcar Mobility ...
LEGAL DISCLAIMER & CONTACTS
The document has been prepared by Europcar Mobility Group (the “Company”). Recipients should conduct and will be solely responsible for their own investigations and analysis
of the Company. This presentation does not contain or constitute an offer of securities for sale or an invitation to invest in securities in France, the United States or any other
jurisdiction.
None of the Company nor its respective employees or officers, makes any representation or warranty, express or implied, as to the accuracy, relevance and/or completeness of
the document or any information, forward-looking statements contained herein and the Company shall not incur any liability for the information contained in, or any omissions
from, the document.
Forward-looking statements are statements that are not historical facts. These statements may include projections and estimates and their underlying assumptions, statements
regarding plans, objectives, intentions and expectations with respect to future financial results, events, operations, services, product development and potential, and statements
regarding future performance or events. Forward looking statements are generally identified by the words "expects", "anticipates", "believes", "intends", "estimates", "plans",
“projects”, “may”, “would” “should” and similar expressions. Forward-looking statements are based on the Company management's current expectations or beliefs on or about the
date of the document but are not guarantees of future performance and are subject to inherent risks, uncertainties (including without limitation, risks identified in the "Risk factors"
section of the Annual Registration Document filed with the Autorité des marchés financiers and also available on the Company's website: www.europcar-mobility-group.com) and
assumptions about Europcar Mobility Group and its subsidiaries and investments, trends in their business, future capital expenditures and acquisitions, developments in respect
of contingent liabilities, changes in economic conditions globally or in Europcar Mobility Group’s principal markets, competitive conditions in the market and regulatory factors.
Those events are uncertain; their outcome may differ from current expectations which may in turn materially affect expected results. Actual results may differ materially from those
projected or implied in these forward-looking statements. Other than as required by applicable law, the Company does not undertake to revise or update any forward-looking
statements in light of new information or future events.

   INVESTOR RELATIONS
   Caroline Cohen                                                                                                                 caroline.cohen@europcar.com
   Investor Relations                                                                                                             investor.relations@europcar.com

   For all financial or business information, please refer to our IR website at: https://investors.europcar-group.com

   MEDIA RELATIONS
   Valérie Sauteret                                                                                                               valerie.sauteret@europcar.com
   Vincent Vevaud                                                                                                                 vincent.vevaud@europcar.com
FY 2019 RESULTS 2020, February 25th - Investor Relations | Europcar Mobility ...
Presentation of financials and management accounts

         Figures for 2019 are presented before IFRS 16 application in comments and tables unless it is
         explicitly indicated. Full accounting reconciliation with IFRS 16 are presented in Appendix

             Application of IFRS 16 as from January 1, 2019 reads as follows:
              • Europcar mobility group is using the simplified retrospective method for 2019 financial accounts,
1               according to which there is no restatement of comparative periods

               • All lease contracts are accounted for in the balance sheet with a “right to use the asset”
                 and a corresponding debt for the lease payment obligation

               • The impact of IFRS 16 are detailed in part III and appendix

2        Detailed reported figures for the fourth quarter are presented in Appendix

         Management Account presentation:
3        2019 figures are presented before and after Urban Mobility Corporate EBITDA performance
         2020 and onwards: Group’s metrics are presented including Urban Mobility Business Unit performance
    3

           2019 RESULTS
AGENDA

       1            2019 KEY FACTS / CAROLINE PAROT, CEO

       2            2019 FINANCIAL RESULTS / LUC PELIGRY, CFO

       3            OUTLOOK / CAROLINE PAROT, CEO

       4            CONCLUSION / CAROLINE PAROT, CEO

4

     2019 RESULTS
01
2019
KEY FACTS

CAROLINE PAROT
KEY HIGHLIGHTS IN 2019

     CHALLENGING ENVIRONMENT AT THE END OF Q3 2019 AND IN Q4 2019

     REVENUE BUILD UP AND MARGIN UNDER PRESSURE, LEADING TO ACCELERATION
     OF EFFICIENCY PROGRAMS

     STRONG GROWTH MOMENTUM IN URBAN MOBILITY

     RAMP-UP OF SHIFT 2023 STRATEGIC ROADMAP

     LAST STEP OF OUR TRANSFORMATIONAL M&A PROGRAM: FOX-RENT-A-CAR

6

     2019 RESULTS
A challenging environment at the end of Q3 & in Q4
    impacting revenue build-up
                                   SOFT EUROPEAN ECONOMY & BREXIT
                             IMPACTED BOTH LEISURE AND CORPORATE RENTAL
                    VOLUME FORECAST
                                                     B2C DEMAND

                                                                                 OVERCAPACITY

                                                     B2B DEMAND

                 OUR REACTION

       •    Boost volumes to optimize           Maintained fleet utilization rate    Progressive defleeting over a
            utilization rate in defleeting                                             few months, to align with the
            period                              Increased cost of sale               market conditions, thanks to a
                                                                                       flexible fleet buy-back model.
       •    Offset lack of corporate            RPD pressure
            volume with transfer to
            leisure customer base
7
           2019 FY RESULTS
2019 revised guidance achieved in a soft environment

                     SALES               PROFITABILITY          CORPORATE NET DEBT

                                      Corp. EBITDA excl. UM
           2019 total revenue                                  ~3x before Fox acquisition
                                          €305-315m
                 ~€2,950m                                         0.3x impact of Fox
Revised                               Corp. EBITDA incl. UM
guidance
                                          €275-285m

                   €3,022m            Corp. EBITDA excl. UM    €880m Corp. Net debt
Actual           total revenue               €310m

                   €2,956m            Corp. EBITDA incl. UM   • 3.0x before Fox acquisition
     revenue excluding acquisitions          €278m            • 0.2x impact of Fox
                                                              i.e. 3.2x in total

     8

           2019 RESULTS
Our strategic framework: SHIFT 2023

In the context of fast evolution of the mobility ecosystem, we are transforming the
group in a profound way to size the market opportunities and address our
customers’ needs:

    We are rationalizing the whole organization for greater agility

    We are investing in Digital at all stages:
     • Customer journey, digital stations, connected cars, product and services,
     • Platforms, IT infrastructure,
     • New teams, new talents

                Legacy Cost Savings and Digital investments to build the near future
9

     2019 RESULTS
02
FY 2019
RESULTS

LUC PELIGRY
Key financials in 2019*

     • Revenue: €3,022m
        +0.9% on organic basis, +3.2% on reported basis

     • Adj. Corp. EBITDA in line with guidance revision published in October 2019:
        • €310m excluding Urban Mobility
        • €278m including Urban Mobility

     • Group net income: €38m, versus €73m in 2018**

     • Operating cash flow: €118m i.e. 42% of free cash flow conversion

     • Corporate net DEBT €880m
        3.0x leverage before Fox acquisition, 3.2x leverage after Fox acquisition

     • Proposed dividend: 34% payout (on group net result pre-IFRS 16)

11
                       * All figures are Before IFRS 16
      2019 RESULTS     ** Excluding €66m net proceed from the sale of Car2Go in 2018
What has happened?
           Impact on Adj. Corporate EBITDA from lower revenue in 2019

      In €M                  350
                                                                                                                                                                                                                                                                   310
                                                    (44)
                                                                                                                                                              10                                                      3
   2019 actual                                                          11                        (1)                          (9)                                                     (10)
                                                                                                                                                                                                                                               (1)
     vs 2018

                        2018 Corp. EBITDA          RPD effect   Volume effect on rev.   Utlization rate impact on    Price effect on fleet costs     Productivity and costs   Price effect of minimum       HQ personnal costs - net   Sales & Mkg & other HQ   2019 Corp. EBITDA
                                                                                                   rev.                                            control on operating costs wage (direct and indirect)           savings                  costs & other

                             375
                                                                                                                                                                                                                                                                    310
                                                     (46)
                                                                       (12)                                                       3                                                                                                               3
                                                                                                 (13)                                                                                                                 10
                                                                                                                                                              (5)                         (5)

   2019 actual
vs Initial guidance

                      Initial expected 2019 Adj.   RPD effect   Volume effect on rev.   Utilization rate impact on   Price effect on fleet costs         Operating costs       Price effect of minimum          Sales & Mkg & HQ                Other            2019 Corp. EBITDA
                             Corp. EBITDA                                                           rev.                                                                       wage (direct and indirect)

         12

                 2019 RESULTS
Revenue in 2019: a contrasted picture across business units

           REVENUE (€M AND % GROWTH)                                                                                         TOTAL REVENUE
                                 +3.2%
                                 +0.9%                                                       +1.7% reported               +5.5% reported
           2 929                Organic*                 3 022                               +0.5% organic*               -3.1% organic*                 +6.2%   +37%
                                                                                               €2,157m                        €411m                      €366m   €49m

          FY 2018                                       FY 2019

                         UTILIZATION RATE
                                Stable

           76.1%                                         76.0%

           FY 2018                                       FY 2019
                                   +3.8%
     316,000 av. fleet size                     328,000 av. fleet size
13
        2019 RESULTS
     * Excluding Fox consolidated since November 1st, 2019 (€37M revenue) and franchisees in Denmark and Norway consolidated on July 1st, 2019 (€29M revenue)
BU CARS: hit by economic conditions in Corporate segment, growth in
Leisure boosted by the necessary shift from Corporate in 2019
       RENTAL REVENUE                              RENTAL REVENUE                                            RENTAL REVENUE*
             €2,035m                                     €2,053m*                                       Evolution of RPD and # of days

                                                                                                                   LEISURE
Corporate                                 Corporate
     42%                                        40%
                                                                                     # of rental days   +4.2%               RPD     -0.9%
                2018                                          2019

                                                                                                                  CORPORATE
                        58%                                               60%
                      Leisure                                            Leisure
                                                                                     # of rental days   -2.4%               RPD     -0.1%

     • Leisure: +3.4% rental revenue growth in 2019

     • Corporate: -2.5% decline in rental revenue in 2019                               • Leisure: Good volume growth particularly helped
       on travel freeze of Large Corporate (double digit                                  by indirect channels but at the detriment of RPD
       decline), offsetting the good growth of SMEs
                                                                                        • Corporate: impact of travel ban

14
       2019 RESULTS
      * Excluding acquisitions of Fox & franchisees acquired in Finland and Norway
Goldcar and Buchbinder: Solid progress on M&A integration

               Acquisition Synergies planned              % realised
                 date         in H2 2017                   vs plan                           Goldcar and Buchbinder:
                                                                                             €20m gross savings in 2019
                    Dec            > €30m
                   2017            by 2020
                                                           80%                               •     Improved purchasing & buyback conditions with manufacturers
                                                                                             •     Reduction in fleet financing costs
                                                                                             •     Pooling central functions and merger of administrative units
                   Sept            > €10m                                                    •     Cost efficiency programs
                   2017            by 2020
                                                           80%

Reminder of the rationale of Goldcar acquisition:                                                Reminder of the rationale of Buchbinder acquisition:

• Leading Low Cost Operator in Europe with strong                                                • Capitalise on Buchbinder brand positioning to boost sourcing of
  know how in running a lean and efficient pure low-                                               German and Austrian clients to accelerate Europcar’s penetration
  cost operating model
                                                                       Volume growth               of the low cost segment in Europe
                                                                       offset by price
• Exposure to: the Mediterranean region, the
                                                                       pressure                  • Achieve German and Austrian market leadership in Vans & Trucks
  Leisure segment and the low-cost market
• Ability to grow fast the business in other Leisure                                             • Reinforce the Europcar Group’s focus on SME in its largest
  countries                                                                                        corporate market
• Compatible business models due to multiple                           Synergies &
  similarities (fleet on buyback model, variable cost                  Savings achieved as       • Seize the right platform to expand further in Eastern Europe
  model, high fleet utilization rate, 90% online sales)                expected                  • Develop know-how in in-house maintenance repair facilities and
   15
                                                                                                   remarketing of fleet at risk
Margin after variable costs: impacted by lower revenue in spite of a tight
  control of FCPU
     In €m

                        -3.4%                                                                         Low Cost       +0.8%
     Cars                                         Vans & Trucks           +1.7%                                      organic
                        organic
                                                                          organic                                               156
              910                  892                                               142                     142                 14
                                                                  139
                                                                                                                      +10%
                        -1.9%                                             +2.4%
                                                                                                                                142

             FY 2018              FY 2019                       FY 2018             FY 2019
                                                                                                           FY 2018             FY 2019

• Low Corporate volumes (travel freeze) and              • A good activity overall, revenue from         • RPD  due to a fierce competitive
  weaker than expected Leisure demand in                   Supersites up strongly                          environment with a moderate volume
  some markets                                           • Rental days . RPD  on longer duration        growth
• Utilization rate & Rental days ;                      • Fleet cost per unit  (damages)               • Synergies from Goldcar integration ++
• RPD , Fleet cost per unit 
• Higher cost of customer acquisition

                                                  MAVC* shows a limited 1% decline
16

         2019 RESULTS                 * MAVC excluding Fox and Urban Mobility
Adj. corporate EBITDA down on lower revenue but actions plans already
        paying off

                                                                              % change at
€m                                               FY 2019   FY 2018 % change    constant
                                                                                            Network costs reflect minimum
                                                                               perimeter    wages increase and opening of
                                                                                            supersites in Vans & Truck (+5% at
Revenue                                           3 022     2 929    3.2%        0.9%
% of volume growth                                                   3.7%        2.2%       constant perimeter)
Margin after variable costs                      1 224     1 231    -0.6%        -2.9%
 In % of revenue                                 40.5%     42.0%                            Slight decline in HQ costs at
                                                                                            constant perimeter:
Network                                          (464)     (428)     8.5%        5.1%
                                                                                            -   €10m gross savings in HQ costs with
In % of revenue                                  15.4%     14.6%
HQ Costs                                         (361)     (355)     1.7%        -0.4%          HQ2020 program on track
In % of revenue                                  11.9%     12.1%                            -   Offset by inflation and digital
Fleet financing costs                            (120)     (121)    -0.3%        -2.8%          investment
Financing CPU (In €)                              (30)      (32)    -5.1%        -6.0%

Adjusted Corporate EBITDA                          278      327     -15.0%      -16.1%      Full benefit from fleet financing costs
 In % of revenue                                  9.2%     11.2%
                                                                                            renegotiation in 2018
Of w/h Urban Mobility Adj. Corporate EBITDA        -32       -23    38.5%       38.5%

Adjusted Corporate EBITDA excl. Urban Mobility    310       350     -11.4%      -12.5%
                                                                                            Urban Mobility: deployment in new
 In % of revenue                                 10.4%     12.1%                            city (Paris) and ramp-up in existing
                                                                                            cities for Ubeeqo. Weak
                                                                                            performance on ride-hailing
      17

              2019 RESULTS
Net profit impacted by non-recurring items

                                                                                 Non recurring charges: 66% of costs are related
All data in €m                                     2019      2018     % change   to re-organization and transformation charges

Adj. Corporate EBITDA incl. Urban Mobility        278.3     327.3      -15.0%

Non-fleet D&A                                     (48.0)    (44.4)      8.2%

Other non-recurring operating income / expenses   (58.2)    (48.1)               Reduction in non-fleet financial expenses mainly
Proceed from the sale of Car2Go                              68.5                due to lower Bond re-financing: €3m in 2019
Non-fleet financial expenses                      (101.2)   (110.6)    -8.4%     (~€10m run-rate)
Profit Before Tax                                  70.8     192.7      -63.2%

Net tax expense                                   (32.9)    (52.0)     -36.7%

Associates                                           -       (1.3)
                                                                                 Effective tax rate: 26% in 2019 versus 30% in
Net profit                                         38.0     139.4      -72.8%
                                                                                 2018
                                                             65.9
of which proceed from the sale of Car2Go

   18

         2019 RESULTS
2019 Corporate free cash flow

Figures in €M

           278

                                  (55)

                                                                            1                                        118
                                                       (75)
                                                                                               (30)

   Adjusted Corp. EBITDA Non recurring expenses   Non fleet capex   Change in non-fleet   Income tax paid   Corporate free cash flow
                                                                    working capital and                        end 31 Dec 2019
                                                                        provisions

      STRONG DISCIPLINE IN WORKING CAPITAL REQUIREMENTS & CONTINUED INVESTMENT
                                TO SUSTAIN DIGITIZATION
 19
        2019 RESULTS
2019 Corporate net debt

Figures in €M

                                                                                      Return to shareholders €81m
      795                                                                                                                                                  880
                                                                                                                                            34
                                                                                                            39
                                                                                            42
                                                                          108                                            (12)
                                           53

                         (118)                             (63)

   Corporate net      Corporate        Interest on    Fleet financing   Investing      Purchases/        Dividends    Proceed from      Transaction     Corporate net
  debt closing 31    Operating free   corporate net    timing impact    activities   Sales of treasury               issue of share   costs, Non fleet debt closing 31
    Dec 2018           cash flow           debt                                          shares                          capital        Financing &      Dec 2019
                                                                                                                                       Forex & Other

                     CORPORATE NET LEVERAGE AT 3.2x FOR DECEMBER 31, 2019
 20
                CORPORATE NET LEVERAGE EXCLUDING FOX AT 3.0x FOR DECEMBER, 2019
      2019 RESULTS
03
OUTLOOK

CAROLINE PAROT
OUTLOOK

       1            SOFT VIEW ON THE ENVIRONMENT

       2            FOCUS ON MARGIN IMPROVEMENT, THROUGH EFFICIENCY MEASURES

       3            CONTINUED INVESTMENT IN DIGITAL

                    URBAN MOBILITY: STRONG DOUBLE-DIGIT REVENUE GROWTH & SUBSTANTIAL
       4            IMPROVEMENT IN CORPORATE EBITDA

       5            GUIDANCE 2020

22

     2019 RESULTS
2020: A limited visibility on the environment

     Macro uncertainties:
       • Soft GDP growth expected in Europe,
       • Brexit economical effects

     Our industry:
        • Travel & leisure trends
        • Environmental regulation: CO2 emissions taxes, EV expansion

23
      2019 FY RESULTS
shift           2023

   SHIFT 2023: our main business priorities for 2020                                                                                              OUR ROADMAP TO
                                                                                                                                                  FURTHER CAPTURE
                                                                                                                                                      GROXTH

   Brand portfolio deployment                           Customer satisfaction                                  Efficiency programs
Foster greater value creation for each brand    • NPS improving for all core brands               • HQ 2020 deployment on-going
                                                • Specific focus on Goldcar’s CSAT rating         • Connected Fleet ramp : One Full Country Launch
2020: on InterRent: repositioning and full
                                                • Customer Care Centers implemented at            • Network optimization
digitization effective with very positive NPS
                                                  Europcar brand level

                                                     Phygital customer journey                              Integration & Synergies
 N°1 of car rental and light commercial
 vehicle rental in Europe, B2B and B2C          • Click &Go Roll out and enhanced features        • Goldcar and Buchbinder costs synergies
                                                • Digital stations program launch during 2020     • Fox Rent-a-Car integration:
                                                                                                    • business synergies with Fox already lived with
   Mid-tier car rental, leisure-focused                                                               first in bound / out bound customers served
                                                                                                    • Fleet financing on-going for Q1

   N°1 of low-cost car rental in Europe
                                                        Sales & Partnerships                        Urban Mobility > path to profitability
                                                • Mid-Term early launch business showing          • Network costs: increased productivity thanks to tech
                                                  promising growth perspectives                     improvements and group synergies
                                                • Gain of significant new corporate accounts in   • Ride-hailing and PHV businesses to be break even
     One of the european leaders of               rental and vehicle sharing (cars and vans)        in 2020
   round-trip car sharing, B2B & B2C
                                                                                                  • Increase B2B portfolio

 24
          2019 FY RESULTS
Well on track to deliver gross cost savings and
  ongoing synergies, above cost inflation
      €40m gross savings & cost efficiency programs in 2020:
• HQ 2020 program
 • All functions and countries HQ re-organized               Gross savings (€m)         2019       2020        2021
 • Center of Excellence logic
                                                             HQ                          10         20          -
 • Strict control of travel and general expenses
                                                             Network                      -         20          10
• Network optimization                                       Total                       10         40          10
 • Focus on increased productivity
 • Rationalisation of Network
 • German perimeter integration

• Digital stations
 • Deployment in 2020 in one full country, expected savings by year-end and full impact now expected in 2021

      c.€8m synergies from                                 Cost inflation: €30m in 2020:
      Goldcar & Buchbinder                                 • CO2 emission taxes
 25                                                        • Minimum wage increases
        2019 RESULTS                                       • Operations: maintenance, car wash, repairs…
Urban mobility: Acceleration leveraging on the group capabilities

                    2019                                                                    2020

                                                               Strong double digit growth of revenue:
                    Active customers         250 K             Focus on Vehicule Sharing growth
                                                                 • Acceleration of customer acquisition through centralization of online and
                    % of repeaters            74%                  performance marketing
                                                                 • Increased pricing in most cities to drive higher value per booking and higher
                    RPU                        Up                  RPU
                                                                 • Corporate car sharing growth acceleration leveraging Europcar Mobility
                                                                   Group corporate customer and SME database

                    # Rides                  273 K             Ride Hailing growth supported by leveraging Group customer base
                                                               and International deployment in France, Spain & Germany
                    GMV per ride            Stable
                                                               PHV growth driven by France fleet increase and launch in Spain
                                                               Brunel international expansion expansion for B2B customers

                    # Drivers                2,700             Better costs absorption leading to a reduction of ~€10m of
                                                               Corporate EBITDA losses:
                                                                 • Increased productivity of network driven by tech and automation
                    Utilization               65%
                                                                   enhancements
                                                                 • Fleet and Insurance cost reduction as part of Group synergies
26
                                                                 • Ride-Hailing Business to reach breakeven end of Q1 2020
     2019 RESULTS             GMV: Gross Merchandising Value
FOX acquisition creates growth opportunities

      A compelling move for Europcar Mobility Group:                                           Financials:

• Leading independent player in the US car rental market, present in 15      • Total equity value of the transaction: $54.5m
  of the top 25 US airports, with a network of 21 corporate stations and
                                                                             • Upfront equity consideration and net debt
  affiliates at over 100 destinations
                                                                               assumed totally $99m by corporate debt &
• Attractive value for money positioning, an average fleet of 18,100 cars      1.5m treasury shares
• A direct footprint in the US, the largest car rental market in the world   • c.$250m revenue in 2019
• Unique opportunity to acquire a US platform to progressively serve all     • Impact on EPS: slightly dilutive in 2019, neutral
  the mobility needs of customers, and leverage our international network      in 2020, accretive as of 2021
• Will optimize group’s direct sales channels, serve B2B customers           • Limited +0.2x Net debt / Corporate EBITDA in
  (see comment) and help increase recurring revenue                            2019
• Significant growth opportunities and synergies through optimized fleet     • Deal completed 31 October 2019, 2 month
  financing, renewed fleet and a greater ability to capture transatlantic      consolidation in 2019
  business

 27
        2019 RESULTS
Invest in digital - core focus of capital allocation

                                                     In 2019 & 2020

                                                     • Change in the organization with two dedicated units:
                                                       Tech & Product to accelerate digital development while
€m                         Group Capex                 managing core historical system
80
                                                     • Center of Excellence in Paris and Barcelona
70                                             75
                                                     • 70% to 80% of capex dedicated to IT & Digitalization
                                         67
60

50                                                         Technology / Infra Enhancement     Back office productivity
                               46                          Country productivity               Digital Journey (customers & fleet)
40
                                                           Business Customers initiatives     EV & Others
30
                     31
                                                                                      5.0%
20    24
                                                                                             17.3%
10                                                                            13.0%                          Infrastructure / Productivity
                                                     Digitization
 0
                                                                                                                    enhancement
     2015           2016      2017   2018     2019                                                   8.0%
                                                       53%                                                               47%

                                                                             35.2%              21.5%
28
     2019 RESULTS
Guidance 2020

                    •   Quality revenue is our Top priority
                    •   Limited organic growth
       SALES        •   Strong double-digit growth of Urban Mobility
                    •   Integration of Fox on 12 months

                    Increase in Corporate EBITDA including Urban Mobility and acquisitions in the
   SOLID              range of €300-310m Including acquisitions realised in 2019 and Urban Mobility
                    • A positive but limited contribution of Fox consolidated on 12 months
 EARNINGS
 GROWTH             Strong increase in net income
                    • Non-recurring expenses of c.€50m

   FCF              Corporate Operating Cash flow generation leading to a reduction in net debt;
GENERATION          and a debt deleveraging by 0.4x
29
     2019 RESULTS
Capital allocation

      Dividend policy confirmed and no further share buy-back

      Further deleveraging with reduction in Corporate net debt

      No M&A

30
     2019 RESULTS
04
CONCLUSION

 CAROLINE PAROT
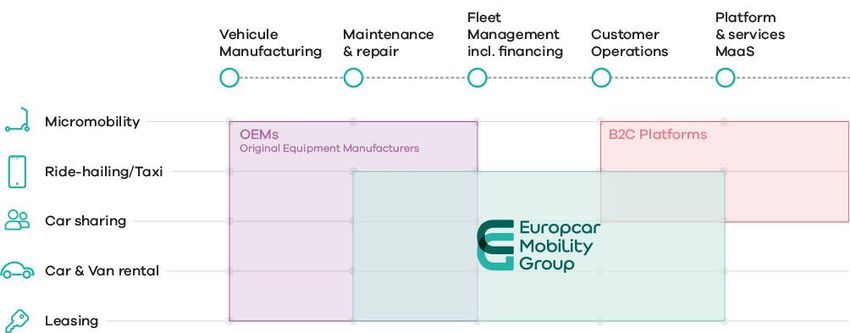
We have a unique, central position in the mobility ecosystem

 32
      2019 RESULTS
Our strategy towards our shift 2023 plan

Strategy based on offering alternative, attractive solutions to vehicle ownership

                     By enlarging a broader range of our service mobility solutions
         1
                     By digitizing our services, infrastructure & process
      HOW?           => Profound Digital transformation

                     Enhance value of our three critical assets: clients, fleet and employees

         2           Increase recurring revenue with a re-balance between Leisure & Corporate

                     Scalability effect leading to a better cost structure absorption
 PAYBACK
                     Greater and recurring free cash flow generation

 33
                        REDUCE EARNINGS VOLATILITY => INCREASE RETURN
      2019 RESULTS
05
APPENDIX
Net income impacted by lower revenues, higher investments in urban mobility
     and non-recurring items
                                                                                                IFRS 16
                                                                                 Incl. IFRS16                 Excl. IFRS16
                                                                                                 impact
                                                                                                                                           Impact of IFRS 16
All data in €m                                                                      2019          2019     2019        2018      Change
Total revenue                                                                      3 022.4          -     3 022.4     2 929.3     3.2%     on P&L:
Fleet holding costs, excluding estimated interest included in operating leases     (755.6)       (1.8)    (753.8)      (707.8)    6.5%
Fleet operating, rental and revenue related costs                                 (1 006.5)      38.3     (1 044.8)   (990.3)     5.5%
                                                                                                                                           Impact on Corporate
Margin after Variable costs                                                        1 260.3       36.5      1 223.8    1 231.1    (0.6%)    rents, reclassified
Margin                                                                              41.7%                  40.5%       42.0%               below Adj. Corporate
Personnel costs                                                                    (522.3)        -       (522.3)      (500.3)    4.4%     EBITDA in
Network and head office overhead                                                   (240.9)       74.1     (315.0)      (294.3)    7.0%
Other income and expense                                                             12.0        0.0        12.0         11.8     1.9%
                                                                                                                                           Depreciation and
Personnel costs, network and head office overhead, IT and other                    (751.2)       74.1     (825.3)      (782.9)    5.4%     financing costs
Net fleet financing expense                                                         (67.9)         -       (67.9)      (65.8)     3.2%
Estimated interest included in operating leases                                     (52.4)         -       (52.4)      (55.2)    (5.1%)
Fleet financing expenses, including estimated interest included in operating                                                               Impact on Adj. Corp.
                                                                                   (120.2)         -      (120.2)      (121.0)   (0.6%)
leases
Adjusted Corporate EBITDA including Urban Mobility                                  388.9        110.6     278.3       327.3     (15.0%)   EBITDA: +€111m
Margin                                                                              12.9%                   9.2%       11.2%
Urban Mobility                                                                                             (32.0)      (22.5)
Adjusted Corporate EBITDA excluding Urban Mobility                                                         310.3       349.8     (11.4%)
Margin                                                                                                     10.4%       12.1%
                                                                                                                                           Impact on net profit:
Depreciation – excluding vehicle fleet                                             (151.5)      (103.6)    (48.0)       (44.4)    8.2%     -€8m
Other operating income and expenses                                                 (58.2)          -      (58.2)        20.4
Other financing income and expense not related to the fleet                        (116.4)       (15.2)   (101.2)      (110.6)    (8.4%)
Profit/loss before tax                                                               62.7         (8.2)     70.8        192.7    (63.2%)
Income tax                                                                          (32.9)          -      (32.9)       (52.0)   (36.7%)
Share of profit/(loss) of associates                                                  -             -        -           (1.3)
Net profit/(loss)                                                                    29.8         (8.2)     38.0        139.4    (72.8%)

   35
             2019 RESULTS
2019 revenue by business unit
                                           TOTAL REVENUE (€M AND % GROWTH)
                    Cars                                    Vans & Trucks                    Low Cost
                    +2%                                         +7%                            +6%

       2 035                  2 078                  337                     359                            422
                                                                                    389

      FY 2018                FY 2019               FY 2018               FY 2019   FY 2018              FY 2019

                                       VOLUMES & PRICES (% YoY PROFORMA CHANGE)
                    Cars                                    Vans & Trucks                    Low Cost
                                                                 +9.5%
                     +1.1%
                                                                                                   + 1.9%
     (0.3%)                                        (3.5%)                            ( 3.5%)

                                                   RPD         Rental days
                                                                                      RPD        Rental days
      RPD       Rental days
36
     2019 RESULTS
Q4 2019 key financials

                     REVENUE (€M AND % GROWTH)                                                 ADJUSTED CORPORATE EBITDA Excl. URBAN MOBILITY (€M)

                                       +10%                                                                                                  -32%

                                                                708
                    644                                                                                                50
                                                                                                                                                               34

               Q4 2018                                       Q4 2019                                                Q4 2018                                  Q4 2019

                               NET INCOME (€M)                                                                CORP OPERATING FREE CASH FLOW (€M)
                                                                                                                                                                9

                  (29)

                                                                                                                       (33)
                                                               (33)
               Q4 2018                                        Q4 2019                                               Q4 2018                                  Q4 2019
37
          NOTES: REVENUE, ADJUSTED CORPORATE EBITDA ARE AT CONSTANT EXCHANGE RATE; NET INCOME AND CORPORATE OPERATING FREE CASH FLOW ARE REPORTED FIGURES.

     2019 RESULTS
Q4 2019 Operational KPIs

     RENTAL DAY VOLUME (MILLION AND % GROWTH)                              FLEET COSTS PER UNIT PER MONTH (€ AND % CHANGE)

                        +7.8%                                                                 +8.1%

                20.0                   21.5                                                                236
                                                                                    218

              Q4 2018               Q4 2019                                       Q4 2018                 Q4 2019

                                  UTILIZATION RATE (% AND CHANGE IN BPS)
                                                             +0.3%

                                        71.7%                                  72.0%

                                       Q4 2018                                 Q4 2019

38
     2019 RESULTS
                                NOTES: FIGURES AT CONSTANT EXCHANGE RATE
Q4 2019 Revenue by business unit
                                                            TOTAL REVENUE (€M AND % GROWTH)
                    Cars                                                                     Vans & Trucks                                                                              Low Cost
                    +4%                                                                              +10%                                                                                +50%

                                                                                                                                                                                                   94
       468                   488
                                                                                                                         102                                                       63
                                                                                        93

     Q4 2018               Q4 2019                                                 Q4 2018                           Q4 2019                                                  Q4 2018           Q4 2019

                     Evolution of prices (RPD) & number of rental days (% YoY PRO-FORMA GROWTH)
                    Cars                                                                 Vans & Trucks                                                                                  Low Cost
        +1.1%                +0.9%

                                                                                                                                                                                                + 0.6%

        RPD                Rental days
                                                                            (3.7%)                            +15.5%                                                          ( 5.3%)

                                                                             RPD                          Rental days                                                           RPD          Rental days

39
                                         Notes: figures at constant exchange rate; RPD and volume growth include acquisitions of franchisees in 2019 in the BU Cars and Vans & Trucks
     2019 RESULTS
Management P&L for 2019 (incl. and excl. IFRS 16)

                                                          Incl. IFRS16   Excl. IFRS16   Excl. IFRS16

                                                                     2019                  2018        Change
              All data in €m

              Revenues                                     3 022.4          3 022.4      2 929.3        3.2%

              Fleet holding costs excluding estimated
                                                           (755.6)          (753.8)       (707.8)       6.5%
              interest included in operating leases
              Fleet operating, rental, revenues and
                                                          (1 006.5)      (1 044.8)        (990.3)       5.5%
              insurance-related costs
              Margin after variable costs                  1 260.3          1 223.8      1 231.1       -0.6%

              in % of Revenue                               41.7%           40.5%         42.0%

              Personnel, network, IT and other HQ costs    (751.2)          (825.3)       (782.9)       5.4%

              Fleet financing costs                        (120.2)          (120.2)       (121.0)      -0.6%
              Adjusted Corporate EBITDA                     388.9           278.3         327.3        -15.0%
              Adjusted Corporate EBITDA Margin              12.9%           9.2%          11.2%
40
     2019 RESULTS
Management P&L for Q4 2019 (incl. and excl. IFRS 16)

                                                                                     INCL. IFRS16 EXCL. IFRS16 EXCL. IFRS16

                                                                                      Q4 2019      Q4 2019       Q4 2018      Change
     All data in €m

     Revenues                                                                           708           708          644        10.0%

     Fleet holding costs excluding estimated interest included in operating leases      (184)        (188)        (166)       13.4%

     Fleet operating, rental, revenues and insurance-related costs                      (244)        (258)        (227)       13.6%

     Margin after variable costs                                                        279           262          251         4.4%

     in % of Revenue                                                                   39.4%        37.0%         39.0%       (2.0)pt

     Personnel, network, IT and other HQ costs                                          (189)        (202)        (181)       11.8%

     Fleet financing costs                                                              (30)          (30)         (30)       -0.6%

     Adjusted Corporate EBITDA                                                           60           29            39        -26.0%

     Adjusted Corporate EBITDA Margin                                                   8.4%         4.1%         6.1%        (2.0)pt

41
      2019 RESULTS
Key financial metrics for 2019

       All data in €m, except if noted                         2019    2018    Change

       Revenues                                                3 022   2 929    3.2%
       Rental Day Volume (million)                             91.0    87.7     3.7%
       Average duration (day)                                   6.7     6.5     3.3%
       Average Fleet size* (thousand)                          328.0   315.9    3.8%
       Average Per unit fleet costs per month (€)              (229)   (226)    1.6%
       Fleet utilization rate                                  76.0%   76.1%
       Adjusted Corporate EBITDA                               278     327     -15.0%
       Adjusted Corporate EBITDA Margin                        9.2%    11.2%
       Adjusted Corporate EBITDA Excl. Urban Mobility          310     350     -11.4%
       Adjusted Corporate EBITDA Margin excl. Urban Mobility   10.4%   12.1%
       Corporate Free Cash Flow                                118     135     -12.2%
         Operating Income IFRS                                 240     369     -34.9%
         of w/h proceed from the sale of Car2Go                         68
         Net Income IFRS                                        38     139      n.m
       Corporate Net Debt at end of the period                 880     795

        * Excluding urban mobility fleet
42

     2019 RESULTS
Key financial metrics for Q4 2019

       All data in €m, except if noted                         Q4 2019   Q4 2018   Change

       Revenues                                                 708       644       9.9%
       Rental Day Volume (million)                              21.5      20.0      7.8%
       Average duration (day)                                    6.6       6.4      1.9%
       Average Fleet (thousand)*                               325.1     302.7      7.4%
       Average Per unit fleet costs per month (€)               (236)     (218)     7.9%
       Financial utilization rate                              72.0%     71.7%
       Adjusted Corporate EBITDA                                 29        39      -25.9%
       Adjusted Corporate EBITDA Margin                         4.1%      6.1%
       Adjusted Corporate EBITDA Excl. Urban Mobility            34        50      -31.8%
       Adjusted Corporate EBITDA Margin Excl. Urban Mobility    4.9%      7.9%
       Corporate Free Cash Flow                                  9        (33)     -128.8%
         Operating Income IFRS                                   15        23      -33.1%

         Net Income IFRS                                        (33)      (29)      n.m
       Corporate Net Debt at end of the period                  880       795

43     * Excluding urban mobility fleet

     2019 RESULTS
IFRS P&L Q4 & FY 2019

               Q4 2019       Q4 2018                     All data in €m                       2019       2018

                 707.7        643.6                       Total revenue                      3 022.4    2 929.3
                (199.6)      (179.7)                   Fleet holding costs                   (806.2)    (763.0)
                (258.0)      (227.1)    Fleet operating, rental and revenue related costs   (1 044.8)   (990.3)
                (127.5)      (113.8)                     Personnel costs                     (522.3)    (500.3)
                 (80.8)       (69.1)           Network and head office overhead              (315.0)    (294.3)
                  6.0          2.0                Other income and expense                     12.0       11.8
                 (14.9)       (12.7)          Depreciation – excluding vehicle fleet          (48.0)     (44.4)
                  32.9         43.4              Recurring operating income                   298.2      348.7
                    (17.7)    (20.5)        Other non-recurring income and expenses           (58.2)      20.4
                     15.3      22.8                    Operating income                       240.0      369.1
                    (35.9)    (56.0)                    Net financing costs                  (169.1)    (176.4)
                    (20.7)    (33.2)                 Profit/(loss) before tax                  70.8      192.7
                    (12.8)      4.5                         Income tax                        (32.9)     (52.0)
                     0.2       (0.1)           Share of profit/(loss) of associates             -         (1.3)
                    (33.3)    (28.8)                     Net profit/(loss)                     38.0      139.4
                      -       (28.4)   Net profit/(loss) attributable to Europcar owners        -        139.5

44
     2019 RESULTS
Reconciliation Q4 & FY 2019

           Incl. IFRS16 Excl. IFRS16 Excl. IFRS16                                                                    Incl. IFRS16 Excl. IFRS16 Excl. IFRS16

             Q4 2019     Q4 2019       Q4 2018                             All data in €m                               2019         2019         2018
              236.7        209.8        201.2                     Adjusted Consolidated EBITDA                        1 128.5       1 016.1      1 027.8
             (140.7)       (79.5)       (61.4)                         Fleet depreciation IFRS                         (617.2)      (329.8)       (295.4)
              (6.1)        (70.8)       (70.0)           Fleet depreciation included in operating lease rents           (2.3)       (287.8)       (284.2)
             (146.8)      (150.4)      (131.4)                       Total Fleet depreciation                         (619.4)       (617.6)      (579.6)
              (11.6)       (11.6)       (13.9)      Interest expense related to fleet operating leases (estimated)     (52.4)        (52.4)       (55.2)
              (18.6)       (18.6)       (16.5)                      Net fleet financing expenses                       (67.9)        (67.9)       (65.8)
              (30.2)       (30.2)       (30.4)                         Total Fleet financing                          (120.2)       (120.2)      (121.0)
               59.7        29.2          39.4                      Adjusted Corporate EBITDA                           388.9         278.3        327.3
              (38.7)       (14.9)       (12.7)           Amortization, depreciation and impairment expense             (151.5)       (48.0)       (44.4)
               18.6        18.6          16.5                 Reversal of Net fleet financing expenses                  67.9         67.9          65.8
                                                    Reversal of Interest expense related to fleet operating leases
               11.6        11.6          13.9                                                                           52.4         52.4          55.2
                                                                             (estimated)
               51.1        44.5          57.1                 Adjusted recurring operating income                      357.6         350.5        403.9
              (11.6)       (11.6)       (13.9)      Interest expense related to fleet operating leases (estimated)     (52.4)        (52.4)       (55.2)
               39.5        32.8          43.3                      Recurring operating income                          305.2         298.2        348.7

45
     2019 RESULTS
Management cash flow in 2019
     All data in €m                                                                              2019    2018

     Adjusted Corporate EBITDA                                                                   278     328
     Non-recurring expenses                                                                      (55)    (49)
     Non-fleet capital expenditure (net of proceeds from disposals)                              (75)    (67)
     Changes in non-fleet working capital and provisions                                          1      (32)
     Income tax paid                                                                             (30)    (46)
     Corporate free cash flow                                                                    118     135
     Cash interest paid on corporate High Yield bonds                                            (51)    (60)

     Cash flow before change in fleet asset base, financing and other investing activities        67      75
     Change in fleet asset base, net of drawings on fleet financing and others working capital
                                                                                                 497      76
     facilities
     Other investing activities                                                                  (104)    50
     Capital increase and Share buy-back                                                         (30)    (27)
     Dividends                                                                                   (39)    (24)
     Change in Corporate High Yield                                                              (150)    -
     Transaction cost cash out and swap impact                                                   (38)    (36)
     Net change in cash before FX effect                                                         202     113
     Cash and cash equivalents at beginning of period                                            425     313
     Scope variation                                                                               -      -
     Effect of foreign exchange conversions                                                       2      (1)
46
     Cash and cash equivalents at end of period                                                  628     425
Main impacts of IFRS 16 on FY 2019
                                                                                                                                                         December 30,
                                                                                                              Balance sheet in M€
                                                                                                                                                             2019

                                                                                                              Assets :                                       476
                                                                                                               -Property, Plant & Equipment                  347
                                                                                                              - Rental Fleet in balance sheet                129
                                                                                                              Liabilities :                                  485
                                                                                                              - Liabilities linked to non-fleet leases       353
                                                                                                              - Liabilities linked to fleet leases           132

                                                                                                       IFRS 16 is the new standard on leases, with first
                                                                                                       application on January 1, 2019. All leases contracts are
                                                                                                       accounted in the balance sheet through an asset
                                                                                                       representing the “Right of Use” of the leased asset along
                                             At December
                                                            At December
                                                                                        At December
                                                                                                       the contract duration, and the corresponding liability,
                                                              31, 2019    Application
Restatement of Adj Corprate EBITDA (in M€)    31, 2018 as
                                                            before New    of IFRS 16
                                                                                         31, 2019 as   representing the lease payments obligation.
                                               reported                                   reported
                                                             Standards
Current operating Income                         349           298             9            308
D&A and Impairment                                44            48            104           152
Net Fleet Financing expenses                     (66)          (68)           (3)           (70)
                                                                                                       Europcar Mobility Group is using the simplified
Adj. Corp. EBITDA calculated                     327           278           110.6          389        retrospective method, according to which there is no
                                                                                                       restatement of comparative periods.

     47

                 2019 RESULTS
Financing structure as of December 31, 2019
                                                                                                                                  Dec. 31,   Dec. 31,
                    In € m illion                                                                           Pricing    Maturity
                                                                                                                                   2018       2019

                    High Yield Senior Notes                                                                 4.125%      2024        600        600
                    High Yield Senior Notes                                                                 5.75%       2019        600
                    High Yield Senior Notes                                                                 4.00%       2026                   450
                    Senior Revolving Facility (€650m) & NEU CP (€450m)                                                  2023        230        518

                    FCT Junior Notes, accrued interest not yet due, capitalized financing costs and other                          (257)      (227)
                    Gross Corporate debt                                                                                           1 173      1 341

                    Short-term Investments and Cash in operating and holding entities                                              (377)      (461)

                    Corporate Net Debt                                                                                              795        880

                                                                                                                                  Dec. 31,   Dec. 31,
                    In € m illion                                                                           Pricing    Maturity
                                                                                                                                   2018       2019

                    High Yield EC Finance Notes                                                              2.375%      2022        500       500
                    Senior asset revolving facility (€1.7bn SARF)                                           E+130bps     2022        557      1 134
                    FCT Junior Notes, accrued interest, financing capitalized costs and other                                        252       253
                    UK, Australia, GC ABB & other fleet financing facilities                                                        1 265     1 572
                    Gross financial fleet debt                                                                                      2 574     3 459
                    Cash held in fleet financing entities and ST fleet investments                                                  (127)     (235)
                    Fleet net debt in Balance sheet                                                                                 2 447     3 224

                    Debt equivalent of fleet operating leases                                                                       129        132

48
                    FLEET NET DEBT (incl. op leases)                                                                                2 576     3 356
     2019 RESULTS
IFRS balance sheet end of December 31, 2019
                                                                      At              At               At           Equity
In € thousands                                                     Dec. 31,        Dec. 31,         Dec. 31,        Share capital                                                  163 884    163 884     161 031
                                                                                  2019 before                       Share premium                                                  701 229    701 229     692 255
                                                                   2019 (*)                          2018
                                                                                    IFRS 16                         Reserves                                                     (199 924)   (199 924)   (165 487)
                                                                                                                    Retained earnings (losses)                                     171 992    180 338     201 417
Assets                                                                                                              Total equity attributable to the owners of Europcar
                                                                                                                                                                                   837 181    845 527     889 216
                                                                                                                    Mobility Group
Goodwill                                                            1 169 740       1 169 740        1 029 845      Non-controlling interests                                          643        643         651
Intangible assets                                                   1 016 084       1 016 084          986 016      Total equity                                                   837 824    846 170     889 867
Property, plant and equipment                                         518 346         171 544          159 247      Liabilities
Other non-current financial assets                                     73 905           73 905          66 012      Financial liabilities                                        1 812 604   1 812 604   1 740 667
Financial instruments non-current                                             0                 0           1 544   Non-current liabilities related to leases                      292 174          0           0

Deferred tax assets                                                   119 740         119 740           58 209      Non-current financial instruments                               64 161     64 161      60 415
                                                                                                                    Employee benefit liabilities                                   161 565    161 565     142 358
Total non-current assets                                            2 897 815       2 551 013        2 300 873
                                                                                                                    Non-current provisions                                           5 132      5 132       2 925
                                                                                                                    Deferred tax liabilities                                       212 046    212 046     173 799
Inventory                                                              29 563           29 563          26 536
                                                                                                                    Other non-current liabilities                                      159        159         220
Rental fleet recorded on the balance sheet                          3 210 147       3 080 646        2 434 448      Total non-current liabilities                                2 547 841   2 255 667   2 120 384
Rental fleet and related receivables                                  966 423         966 423          753 370
                                                                                                                    Current portion of financial liabilities                     2 994 090   2 994 090   2 006 533
Trade and other receivables                                           487 618         487 618          481 264      Current liabilities related to leases                          192 475          0           0
Current financial assets                                               14 844           14 844          11 970      Employee benefits                                                3 275      3 275       3 192
                                                                                                                    Current provisions                                             219 950    219 950     220 893
Current tax assets                                                     34 023           34 023          37 547
                                                                                                                    Current tax liabilities                                         46 494     46 494      23 025
Restricted cash                                                       116 518         116 518           90 490      Rental fleet related payables                                  813 128    813 128     644 169
Cash and cash equivalents                                             527 019         527 019          358 138      Trade payables and other liabilities                           628 893    628 893     586 573

Total current assets                                                5 386 155       5 256 654        4 193 763      Total current liabilities                                    4 898 305   4 705 830   3 484 385
                                                                                                                    Total liabilities                                            7 446 146   6 961 497   5 604 769
Total assets                                                        8 283 970       7 807 667        6 494 636
                                                                                                                    Total equity and liabilities                                 8 283 970   7 807 667   6 494 636

   49       (*) The financial statements as of December 31, 2019 are established by applying IFRS 16 (using the modified retrospective approach without restatement of the previous year).

            2019 RESULTS
IFRS Cash Flow 2019
                                                                                                          FY 2019                    (1) In 2019, the variation includes €103.6 million for the depreciation of the right of use of property assets within the scope of IFRS 16.
In € thousands                                                                          FY 2019 (*)     before IFRS     FY 2018
                                                                                                            16
                                                                                                                                     (2) In 2019, the variation is mainly explained by the change in the insurance provision for €(2.4) million, in the “buy-back” provision for €(2.6)
Profit/(loss) before tax                                                                      62 500         70 845       192 705
                                                                                                                                     million and benefit employee provision for €(1) million. In 2018, the variation mainly includes payments related to some litigations in France for
Reversal of the following items                                                                                                      €10 million.
Depreciation and impairment expenses on property, plant and equipment
                                                                                            125 747          22 192        20 424
(1)
                                                                                                                                     (3) In 2018 mainly related to the profit on the sale of Car2Go.
Amortization and impairment expenses on intangible assets                                    25 198          25 198         23 939
Impairment of assets                                                                             593             593         9 981
Changes in provisions and employee benefits (2)                                              (7 183)         (7 183)      (13 233)   (4) In 2019, the variation includes €17.8 million for the depreciation of the right of use of leased assets within the scope of IFRS 16.
Recognition of share-based payments                                                              688             688         2 495
Profit/(loss) on disposal of assets (3)                                                      (1 214)         (1 214)      (68 806)   (5) Given the average holding period for the fleet, the Group reports vehicles as current assets at the beginning of the contract. Their change
Other non-cash items                                                                           4 592           4 592         5 809
Total net interest costs(4)                                                                 154 909         137 128       137 492
                                                                                                                                     from period to period is therefore similar to operating flows generated by the activity. In 2019, the variation includes the change in right of use of
Amortization of transaction costs                                                            16 448          16 448        16 577    the fleet within the scope of IFRS 16 for an amount of €48.5 million.
Net financing costs                                                                         171 357         153 576       154 069

Net cash from operations before changes in working capital                                  382 278         269 287       327 383    (6) Mainly related to IT developments for €(39) million and equipment renewal for €(28.8) million.
Changes to the rental fleet recorded on the balance sheet (5)                              (331 373)       (379 895)     (104 020)
Changes in fleet working capital                                                            (27 953)        (27 953)      (51 156)   (7) The variation relates to the sale of the investment in SnappCar in 2019 and the sale of Car2Go in 2018.
Changes in non-fleet working capital                                                          10 137          10 137      (15 835)

Cash generated from operations                                                                33 089       (128 424)      156 372
                                                                                                                                     (8) In 2019, the change is mainly related to the acquisition by the Group of its Finnish and Norwegian franchisees for €37.8 million and Fox Rent
Income taxes received/paid                                                                  (29 919)        (29 919)      (46 109)
                                                                                                                                     A Car for €49 million.
Net interest paid                                                                          (135 485)       (135 485)     (138 283)
                                                                                                                                     (9) In 2019, the variation includes the impact of the capital increase reserved for employees of the group (“we Share 2019” Plan). Refer to Note
Net cash generated from (used by) operating activities                                     (132 315)       (293 828)      (29 029)
                                                                                                                                     1.2.3.
Acquisition of intangible assets and property, plant and equipment (6)                      (84 454)        (84 454)      (73 132)
Proceeds from disposal of intangible assets and property, plant and
equipment
                                                                                               9 030           9 030        6 529    (10) In 2019, the change is mainly related to the issuance of €450 million of Senior Notes at a rate of 4%, which mature in 2026 and the early
Proceeds from disposal of subsidiaries (7)                                                     1 499           1 499       70 000    reimbursement of €600 million of existing Senior Notes, at a rate of 5.750% that mature in 2022. In 2018, the change is mainly due to the launch
Acquisition of subsidiaries, net of cash acquired and other financial investments (8)      (106 968)       (106 968)      (20 740)   of a Senior Secured Notes at a rate of 2.375% of an amount of 150 million euros maturing in 2022.
Net cash used by investing activities                                                      (180 893)       (180 893)      (17 343)
                                                                                                                                     (11) In 2019, primarily related to changes in the Senior Credit Facility, Revolving Credit Facility and Commercial Papers. Refer to Note 8 for
Capital increase (net of related expenses) (9)                                                11 827          11 827             -
                                                                                                                                     more detail.
Special distribution and dividends paid                                                     (39 479)        (39 479)      (24 229)
(Purchases) / Sales of treasury shares net                                                  (42 402)        (42 402)      (29 883)
Derivative instruments                                                                              -               -      (6 083)   (12) In 2019 and following the implementation of IFRS 16, the variation includes €49 million due to change in liability under the fleet lease
Issuance of bonds (10)                                                                     (150 000)       (150 000)      148 500    agreements and €112.5 million due to change in liability under non-fleet lease agreements.
Change in other borrowings (11)                                                              905 170         905 170        85 322
Change in rental debts (12)                                                                (161 511)                -            -
Payment of transaction costs (13)                                                             (8 909)         (8 909)     (15 084)
                                                                                                                                     (13) In 2019, the variation is primarily due to transaction costs, of which €(4.7) million relate to the new issuance of Senior Notes for €450 million
Net cash generated from (used by) financing activities                                      514 696         676 207       158 543
                                                                                                                                     and the renewal of the Revolving Credit Facility for €(2.4) million. In 2018, payment of transaction costs including €(4.2) million related to SARF,
                                                                                                                                     €(0.2) million of initial costs related to the revolving credit facility, €(1.3) million related to the bridging loan, €(0.6) million related to the new €150
Cash and cash equivalent at beginning of period                                             424 986         424 986       313 251    million bond issue and €(2.6) million related to other loans.
Net increase/(decrease) in cash and cash equivalents after effect of
                                                                                            201 488         201 488       113 181
foreign exchange differences
Changes in scope                                                                                  -               -              -   (*) The financial statements as of December 31, 2019 are established by applying IFRS 16 (using the modified
Effect of foreign exchange differences                                                        1 681           1 681        (1 446)   retrospective approach without restatement of the previous year).
Cash and cash equivalents at end of period                                                  628 155         628 155       424 986
GLOSSARY (1/3)

     Business customers: include corporations, small and medium-sized businesses, government agencies and other organizations which rent cars
       as well as entities renting cars to provide vehicle replacement services

     Corporate countries: countries where Europcar owns and operates its own network, where corporate-operated stations are located (Germany,
       UK, France, Italy, Spain, Portugal, Belgium and Australia/New Zealand)

     Adjusted Corporate EBITDA: EBITDA less fleet depreciation, fleet operating lease rents and fleet financing costs

     Fleet: all vehicles operated by the car rental company available or not for rent which includes cars and vans

     Fleet Cost per Unit per month: defined as total monthly fleet costs (including fleet holding and fleet operating costs but excluding financial
       interests) divided by the average fleet over the period

     Fleet holding costs: include (A) Costs related to rental fleet agreements, which consist of (i) “depreciation” expense relating both to vehicles
       purchased with manufacturer or dealer buy-back commitments and to “at risk” vehicles (based, with respect to vehicles purchased with a buy-
       back commitment, on monthly depreciation rates negotiated under the buy-back agreements, net of volume rebates, and with respect to “at
       risk” vehicles, to the difference between the acquisition cost of the vehicles and the estimated residual value, the value of “at risk” vehicles
       being adjusted monthly on the basis of the vehicles’ market values) and (ii) charges under operating leases; (B) Acquisition and sale-related
       costs, which include principally (i) the cost of vehicle accessories; (ii) costs relating to the conditioning of new vehicles; and (iii) costs relating
       to disposal of used vehicles and of vehicles purchased in connection with buy-back programs; and (C) Taxes on vehicles.

51
GLOSSARY (2/3)

     Fleet operating, rental and revenue related costs: include (A) Fleet operating costs, which include repairs and maintenance costs and costs
       incurred for damaged and stolen cars, as well as the costs of reconditioning vehicles for repurchase by the car manufacturer or dealer; (B)
       insurance (the costs of car insurance covering civil liability and damage to vehicles, as well as self-insurance costs); (C) Revenue-related
       commissions and fees, which include commissions paid to agents, such as personnel costs and station overhead (excluding vehicle fleet), as
       well as commissions paid to travel agents, brokers and other commercial partners and fees and taxes paid for airport and train station
       concessions; and (D) Rental related costs, which include the cost of transferring vehicles from one site to another, vehicle washing costs and
       fuel costs.
     Fleet financial utilization rate: number of actual rental days as a percentage of the theoretical total potential number of days of the fleet. The
       theoretical total potential number of days of the fleet is equal to the number of vehicles held over the period, multiplied by the total number of
       days in the period
     Franchising: arrangement where the franchiser grants the franchisee the right to use its trademark or trade-name as well as certain business
       systems and processes, to produce and market a good or services according to certain specifications. In exchange, the franchisee usually
       pays the franchiser an entry fee plus a percentage of sales revenues as royalty
     GDS (Global Distribution System): computerized reservations systems operated by third parties and used by intermediaries such as travel
       agents and travel operators to make reservations with the Europcar Network
     GSA (General Sales Agent): general sales representative that promotes and sells the services offered by Europcar in a specific country or
       region in consideration of a commission
     GreenWay® system: software application, owned by Europcar, offering a comprehensive business solution mainly in the areas of fleet
       management, e-commerce, reservations and global distribution systems and rental operations
     Leisure customers: include not only individual travelers booking vacation car rentals but also people renting to meet other personal needs
52
GLOSSARY (3/3)

 Loan to value: corresponds to the indebtedness of Securitifleet Holding, the Securitifleet Companies and EC Finance Plc divided by the total value of the
  net assets on the balance sheets of these companies.

 Margin after variable costs (MAVC): corresponds to the total revenues less Fleet holding costs and Fleet operating, rental and revenue related costs

 Net rates: brokers selling at any price, ie brokers revenue is the gap between Europcar’s selling price and their selling price (usually offered to TOs for
  package, brokers with Keddy and destinations where brokers are more present than Europcar)

 Operating lease vehicle: agreement by which a vehicle is leased to a car rental company, which pays periodically on a relatively short-term basis; at the
  end of the operating lease, title does not pass to the car rental company

 Rental Day Volume: number of vehicles rented over a period of time

 RCM: Revenue Capacity Management

 Retail rates: Europcar setting the price and paying a commission to brokers preventing them from selling at a lower price than Europcar’s

 RPD (Revenue Per Day): rental revenue divided by the Rental Day Volume

 Vehicle replacement: business involving principally the rental of cars to individuals whose rental charges are wholly or partially paid or reimbursed, by
  insurance companies, vehicle leasing companies and vehicle dealers and other entities offering vehicle replacement services, with whom Europcar has a
  direct contractual relationship
  53
You can also read