Furnished as of May 5, 2022 - UNAUDITED - Healthcare Trust of America, Inc.
←
→
Page content transcription
If your browser does not render page correctly, please read the page content below
Furnished as of May 5, 2022 - UNAUDITED
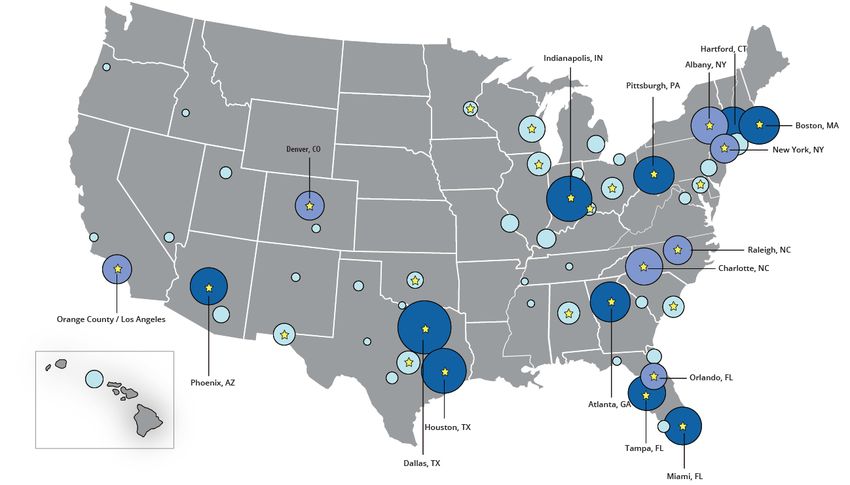
Table of Contents

Company Overview
   Company Information                                                                                                                       3
   Recent Highlights                                                                                                                         6
   Financial Highlights                                                                                                                      8
   Company Snapshot                                                                                                                          9
Financial Statements
   Condensed Consolidated Balance Sheets                                                                                                    10
   Condensed Consolidated Statements of Operations                                                                                          11
   Condensed Consolidated Statements of Cash Flows                                                                                          12
Financial Information
   FFO, Normalized FFO, Normalized FAD and Adjusted EBITDAre                                                                                13
   Debt Composition and Maturity Schedule                                                                                                   14
   Capitalization and Covenants                                                                                                             15
Portfolio Information
   Same-Property Performance and NOI                                                                                                        16
   Investment Activity                                                                                                                      17
   Development/Redevelopment Summary and Property Capital Expenditures                                                                      18
   Net Asset Value Components                                                                                                               19
   Key Markets in Top 75 MSA Concentration                                                                                                  20
   Portfolio Diversification by Type, Historical Campus Proximity and Ownership Interests                                                   21
   New and Renewal Leasing Activity, Historical Leased Rate and Tenant Lease Expirations                                                    22
   Tenant Profile, Tenant Specialty and Top MOB Tenants                                                                                     23
Reporting Definitions                                                                                                                       24

Forward-Looking Statements:
Certain statements contained in this report constitute forward-looking statements within the meaning of the safe harbor from civil liability
provided for such statements by the Private Securities Litigation Reform Act of 1995 (set forth in Section 27A of the Securities Act of 1933,
as amended, and Section 21E of the Securities Exchange Act of 1934, as amended, or the Exchange Act). Such statements include, in
particular, statements about our plans, strategies, prospects and estimates regarding future medical office building market performance.
Additionally, such statements are subject to certain risks and uncertainties, as well as known and unknown risks, which could cause actual
results to differ materially and in adverse ways from those projected or anticipated. Therefore, such statements are not intended to be a
guarantee of our performance in future periods. Forward-looking statements are generally identifiable by the use of such terms as “expect,”
“project,” “may,” “should,” “could,” “would,” “intend,” “plan,” “anticipate,” “estimate,” “believe,” “continue,” “opinion,” “predict,” “potential,” “pro
forma” or the negative of such terms and other comparable terminology. Readers are cautioned not to place undue reliance on these
forward-looking statements. We cannot guarantee the accuracy of any such forward-looking statements contained in this report, and we do
not intend to publicly update or revise any forward-looking statements, whether as a result of new information, future events, or otherwise,
except as required by law. Any such forward-looking statements reflect our current views about future events, are subject to unknown risks,
uncertainties, and other factors, and are based on a number of assumptions involving judgments with respect to, among other things, future
economic, competitive and market conditions, all of which are difficult or impossible to predict accurately. To the extent that our assumptions
differ from actual results, our ability to meet such forward-looking statements, including our ability to generate positive cash flow from
operations, provide dividends to stockholders, and maintain the value of our real estate properties, may be significantly hindered. Forward-
looking statements express expectations of future events. All forward-looking statements are inherently uncertain as they are based on
various expectations and assumptions concerning future events and they are subject to numerous known and unknown risks and
uncertainties that could cause actual events or results to differ materially from those projected. Due to these inherent uncertainties, our
stockholders are urged not to place undue reliance on forward-looking statements. Forward-looking statements speak only as of the date
made. In addition, we undertake no obligation to update or revise forward-looking statements to reflect changed assumptions, the
occurrence of unanticipated events or changes to projections over time, except as required by law. These risks and uncertainties should be
considered in evaluating forward-looking statements and undue reliance should not be placed on such statements. Additional information
concerning us and our business, including additional factors that could materially affect our financial results, is included herein and in our
filings with the SEC.

                                                                                                                       1Q 2022 I Supplemental Information
                                                                                                                       Healthcare Trust of America, Inc. I 2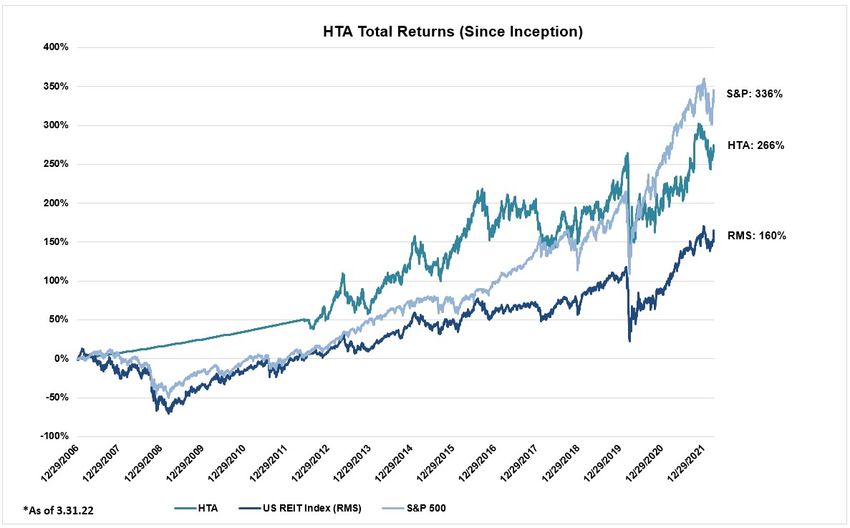
Company Information

Healthcare Trust of America, Inc. (NYSE: HTA) is the largest dedicated owner and operator of medical office buildings (“MOBs”) in the United
States, with assets comprising approximately 26.0 million square feet of gross leasable area (“GLA”), and with $7.8 billion invested primarily
in MOBs. HTA provides real estate infrastructure for the integrated delivery of healthcare services in highly-desirable locations. Investments
are targeted to build critical mass in 20 to 25 leading gateway markets that generally have leading university and medical institutions, which
generally translates to superior demographics, highly-educated graduates, intellectual talent and job growth. The strategic markets HTA
invests in support a strong, long-term demand for quality medical office space. HTA utilizes an integrated asset management platform
consisting of on-site leasing, property management, engineering and building services, and development capabilities to create complete,
state of the art facilities in each market. We believe this drives efficiencies, strong tenant and health system relationships, and strategic
partnerships that result in high levels of tenant retention, rental growth and long-term value creation. Headquartered in Scottsdale, Arizona,
HTA has developed a national brand with dedicated relationships at the local level.
Founded in 2006 and listed on the New York Stock Exchange in 2012, HTA has produced attractive returns for its stockholders that have
outperformed the US REIT index, since inception. More information about HTA can be found on the Company’s Website (www.htareit.com),
Facebook, LinkedIn, Instagram and Twitter.

Senior Management

Peter N. Foss I Interim President and Chief Executive Officer
Robert A. Milligan I Chief Financial Officer, Secretary and Treasurer
Amanda L. Houghton I Executive Vice President - Asset Management
David A. Gershenson I Chief Accounting Officer
Caroline E. Chiodo I Senior Vice President - Acquisitions and Development
Brock J. Cusano | Senior Vice President - Operations

Contact Information

Corporate Headquarters
Healthcare Trust of America, Inc. I NYSE: HTA
16435 North Scottsdale Road, Suite 320
Scottsdale, Arizona 85254
480.998.3478
www.htareit.com

Follow Us:
Investor Relations
Robert A. Milligan I Chief Financial Officer, Secretary and Treasurer
16435 North Scottsdale Road, Suite 320
Scottsdale, Arizona 85254
480.998.3478
info@htareit.com

Transfer Agent
Computershare
P.O. Box 505000
Louisville, KY 40233
888.801.0107

                                                                                                              1Q 2022 I Supplemental Information
                                                                                                              Healthcare Trust of America, Inc. I 3
HTA: LARGEST DEDICATED OWNER OF MEDICAL OFFICES

      $7.8B                     ~26.0M GLA                              266%                       BBB/Baa2
                                                                TOTAL SHAREHOLDER                 INVESTMENT GRADE
GROSS INVESTMENTS              ACROSS 470 BUILDINGS                  RETURNS
                                                                    (Since December 2006)
                                                                                                    BALANCE SHEET

                                  BEST IN CLASS PORTFOLIO FOCUSED
                                         IN 20-25 KEY MARKETS

                                                The HTA Difference

Industry Leading Portfolio: Core, critical MOBs where healthcare demand is growing: on-campus, core community
outpatient, and academic locations. With limited ground lease restrictions.

Key Market Focus: Investing in high growth markets where we can achieve operational scale. 10 markets of ~1MM
square feet of GLA and 17 markets >500k square feet of GLA.

Unique, Vertically Integrated Operating Platform: The strength of a dedicated, national platform delivering tenant
satisfaction, performance and growth in our key markets.

Strong and Diverse Tenant Base: Partnered with leading healthcare providers in our markets. ~74% of tenants are
Health Systems or National/Regional providers. 58% of tenants are credit rated or affiliated with credit rated parties.

Steady and Consistent Performance: Delivering earnings growth to the bottom line, even during COVID.

Dividend Growth: Only MOB REIT to raise dividend in each of the last 8 years.

Investment Grade Balance Sheet: HTA believes its $1.0 billion in liquidity and low leverage positions it for future
growth and stability.

                                                                                                 1Q 2022 I Supplemental Information
                                                                                                 Healthcare Trust of America, Inc. I 4
FINANCIAL PERFORMANCE: HISTORY OF VALUE CREATION
Normalized FFO/Share Same Store Growth
$0.45 4%
$0.44 $0.44 $0.44 $0.44
$0.43 $0.43 $0.43
$0.42 $0.42 $0.42 $0.42 $0.42 $0.42
$0.41 $0.41 $0.41 $0.41
3% 3.1%
$0.40 $0.40
2.9% 2.9%
$0.4 2.8%
$0.39 2.7% 2.7% 2.7%
2.6%
2.5% 2.5% 2.5% 2.5% 2.5%
2.3%
2% 2.1%
1.6%
$0.35
1% 1.1%
0.8%
0.6%
0.5%
$0.3 0%
2Q17 3Q17 4Q17 1Q18 2Q18 3Q18 4Q18 1Q19 2Q19 3Q19 4Q19 1Q20 2Q20 3Q20 4Q20 1Q21 2Q21 3Q21 4Q21 1Q22 2Q17 3Q17 4Q17 1Q18 2Q18 3Q18 4Q18 1Q19 2Q19 3Q19 4Q19 1Q20 2Q20 3Q20 4Q20 1Q21 2Q21 3Q21 4Q21 1Q22
DELIVERING SHAREHOLDER VALUE
8.5% Annualized Average Total Returns Since First Distribution in 2006 to March 31, 2022
$0.34
Top MOB Tenants Steady & Growing Dividend
» AdventHealth » HCA Healthcare
$0.325
» Ascension » Highmark-Allegheny Health Network
$0.320
» Atrium Health » Mercy Health $0.32
$0.315
» Baylor Scott & White Health » Steward Health Care $0.310
» Boston Medical Center » Tenet Healthcare Corporation $0.305
$0.300
» CommonSpirit Health » Tufts Medical Center $0.3
» Community Health Systems » UNC Health Care
$0.28
2Q17 3Q17 4Q17 1Q18 2Q18 3Q18 4Q18 1Q19 2Q19 3Q19 4Q19 1Q20 2Q20 3Q20 4Q20 1Q21 2Q21 3Q21 4Q21 1Q22
1Q 2022 I Supplemental Information
Healthcare Trust of America, Inc. I 5Company Overview
Recent Highlights
First Quarter 2022 Highlights:
• Reported net income attributable to common stockholders of $0.08 per diluted share.
• Reported Funds From Operations (“FFO”), as defined by NAREIT, of $0.40 per diluted share.
• Reported Normalized FFO of $0.44 per diluted share. This excludes normalizing adjustments totaling approximately $7.4
million consisting of the following:
◦ Merger-related costs of $6.0 million including: (i) financial advisor fees of $3.8 million; (ii) legal fees of $1.8 million;
(iii) merger and integration consulting fees of $0.3 million; and (iv) travel costs of $0.1 million;
◦ Interest expense of $0.9 million related to amortization of bridge loan commitment fees; and
◦ Other normalizing adjustments of $0.5 million including: (i) additional board meeting fees of $159,000 (ii) legal and
professional fees related to the whistleblower investigation of $143,000; (iii) legal fees related to employee retention
matters of $131,000; and (iv) professional fees related to strategic review matters of $81,000.
• Reported Normalized FAD of $80.3 million.
• Reported Same-Property Cash Net Operating Income (“NOI”) growth of 0.8% compared to Q1 2021. The change in Same-
Property Cash NOI from Q1 2021 to Q1 2022 was impacted by $1.1 million of increased platform operating expenses,
resulting in a compression in rental margin of 0.8%. These expenses include increased accounting labor and technology
costs of approximately $0.3 million as well as increased engineering costs of approximately $0.4 million related primarily to
compensation and outside services.
Portfolio Performance
• As of March 31, 2022, our portfolio had a leased rate of 89.3% by gross leasable area (“GLA”) and an occupancy rate of
87.3% by GLA.
• During Q1 2022, HTA executed leases of 713 thousand square feet of GLA, including 202 thousand square feet of GLA in
new leases and 511 thousand square feet of GLA in renewals. Re-leasing spreads were 3.0% and tenant retention for the
Same-Property portfolio was 69% by GLA.
Investment Activity
• During Q1 2022, HTA closed on a $19 million medical office building totaling over 44,000 square feet of GLA located in the
Tampa, Florida key market.
• In Q1 2022, we closed on the sale of a tenant purchase option transaction on a property located in Georgia for a gross sales
price of approximately $26.8 million.
Capital Activity and Liquidity
• HTA ended Q1 2022 with total leverage of (i) 29.4%, measured as debt less cash and cash equivalents to total capitalization,
and (ii) 6.0x net debt to Adjusted Earnings before Interest, Taxes, Depreciation and Amortization for real estate (“Adjusted
EBITDAre”).
• HTA ended Q1 with total liquidity of $1.0 billion, inclusive of $1.0 billion available on our unsecured revolving credit facility and
$10.9 million of cash and cash equivalents.
1Q 2022 I Supplemental Information
Healthcare Trust of America, Inc. I 6Company Overview
Recent Highlights Cont'd
Transaction with Healthcare Realty Trust Incorporated
On February 28, 2022, the Company announced that it has agreed to enter into a strategic business combination with Healthcare
Realty Trust Incorporated (NYSE:HR) (“Healthcare Realty” or “HR”). Subject to a favorable stockholder vote, upon the consummation
of the merger, HTA stockholders would receive a total implied value of $35.08 per share comprised of a special cash dividend of $4.82
per share and a transaction exchange ratio of 1:1 based on HR’s unaffected price of $30.26 on February 24, 2022.
Upon the consummation of the merger, this transaction would bring together two of the largest owners of medical office buildings,
creating the preeminent, pure-play medical office building REIT and positions the combined company to create long-term stockholder
value. With 733 properties totaling 44 million square feet, the combined company will be the largest pure-play MOB REIT, with nearly
double the square footage of the next largest MOB portfolio. The combined company will have a pro forma equity market capitalization
of approximately $11.6 billion and a total enterprise value of $17.6 billion based on the implied values at market close on February 24,
2022.
The special cash dividend as described above is expected to be financed through a combination of joint venture transactions and
asset sales. As of April 29, 2022, HTA and HR have received letters of intent from, and are in advanced negotiations with, three
institutional investors for a combination of joint venture and asset sales totaling $1.7 billion at a weighted average cap rate of 4.8%.
Net proceeds from these transactions are expected to be approximately $1.6 billion. The transactions may occur in separate
tranches, with the initial transactions expected to close prior to the vote on the merger by HTA and HR stockholders and the remainder
to be completed on or around the closing date of the merger. These transactions are subject to execution of definitive documentation
and customary closing conditions.
Additionally, HTA and HR have secured initial commitments for amended and restated credit facilities for the combined company,
including the following:
• a $1.5 billion revolving credit facility;
• $1.5 billion of term loans, including $650 million of new capacity; and
• a $1.1 billion asset sale term loan to replace the transaction bridge loan commitment and to backstop the $1.1 billion special
cash dividend to HTA shareholders, if needed, depending on the timing of asset sales and joint ventures.
On May 2, 2022, HTA and HR filed a Form S-4 Registration Statement with the SEC in connection with the contemplated merger.
Second Quarter 2022 Dividend
HTA’s regular quarterly dividends are expected to continue under the terms of merger agreement. On May 5, 2022, HTA’s Board of
Directors announced a quarterly dividend of $0.325 per share of common stock. The dividend will be paid on July 15, 2022 to
stockholders of record on July 6, 2022, and is not deemed to be a component of the special cash dividend of $4.82 described above.
In the event the merger transaction with HR closes prior to the record date, the quarterly dividend will be pro-rated, pursuant to the
terms of the merger agreement, and will be paid on the business day prior to the effective date of the transaction to stockholders of
record three business days before the payment date.
Additionally, the eligible holders of HTA’s operating partnership units (“OP Units”) will receive a quarterly OP Unit distribution, which is
on par with HTA’s common stock dividend described above. In addition, holders of HTA’s OP Units will receive a corresponding
special distribution of $4.82 per share pursuant to the terms of the merger agreement.
1Q 2022 I Supplemental Information
Healthcare Trust of America, Inc. I 7Company Overview
Financial Highlights
(unaudited and dollars in thousands, except per share data)
Three Months Ended
1Q22 4Q21 3Q21 2Q21 1Q21
INCOME ITEMS
Revenues $ 202,002 $ 195,703 $ 191,262 $ 188,615 $ 191,493
NOl (1)(2) 136,118 135,409 131,694 131,206 131,914
(1)(3)
Adjusted EBITDAre, annualized 508,740 502,092 491,156 496,792 505,952
FFO (1)(3) 93,606 94,468 97,280 96,789 97,849
(1)(3)
Normalized FFO 101,525 98,132 97,787 97,583 98,308
(1)(3)
Normalized FAD 80,285 79,181 77,762 80,976 88,758
Net income attributable to
common stockholders per diluted share $ 0.08 $ 0.07 $ 0.10 $ 0.17 $ 0.10
FFO per diluted share 0.40 0.42 0.44 0.44 0.44
Normalized FFO per diluted share 0.44 0.43 0.44 0.44 0.44
Same-Property Cash NOI growth (4) 0.8% 1.1% 2.5% 2.1% 1.6%
Fixed charge coverage ratio (5) 4.91x 5.02x 5.05x 5.07x 5.06x
As of
1Q22 4Q21 3Q21 2Q21 1Q21
ASSETS
Gross real estate investments $ 7,798,488 $ 7,766,297 $ 7,861,336 $ 7,845,368 $ 7,809,702
Total assets 6,814,908 6,889,689 6,775,631 6,725,404 6,696,591
CAPITALIZATION
Net debt (6) $ 3,042,940 $ 2,975,769 $ 3,064,628 $ 2,988,662 $ 2,997,742
(7)
Total capitalization 10,349,140 10,756,374 9,754,767 8,924,659 9,129,686
Net debt/total capitalization (6) 29.4% 27.7% 31.4% 33.5% 32.8%
(1) Refer to pages 24 and 25 for the reporting definitions of NOI, Adjusted EBITDAre, FFO, Normalized FFO and Normalized FAD.
(2) Refer to page 16 for a reconciliation of GAAP Net Income to NOI.
(3) Refer to page 13 for the reconciliations of GAAP Net Income Attributable to Common Stockholders to FFO, Normalized FFO, Normalized FAD and Adjusted EBITDAre.
(4) Calculated as the increase in Same-Property Cash NOI for the quarter as compared to the same period in the previous year.
(5) Calculated as Adjusted EBITDAre divided by interest expense and scheduled principal payments.
(6) Refer to page 15 for components of net debt.
(7) Calculated as the common stock price on the last trading day of the period multiplied by the total diluted common shares outstanding at the end of the period, plus net debt.
Refer to page 15 for details.
1Q 2022 I Supplemental Information
Healthcare Trust of America, Inc. I 8Company Overview
Company Snapshot
(as of March 31, 2022)
Investments in Real Estate (1) $ 7.8
Total portfolio GLA (2) 26.0
Leased rate (3) 89.3%
Same-Property portfolio tenant retention rate (YTD) (4) 69%
% of GLA managed internally 96%
% of GLA on-campus/adjacent 67%
% of invested dollars in key markets in top 75 MSAs (5) 95%
Weighted average remaining lease term for all buildings (6) 5.3
Weighted average remaining lease term for single-tenant buildings (6) 5.7
(6)
Weighted average remaining lease term for multi-tenant buildings 5.0
Credit ratings (Standard & Poor’s/Moody’s) BBB(Stable)/Baa2(Stable)
Cash and cash equivalents (2) $ 10.9
Net debt/total capitalization 29.4%
Weighted average interest rate per annum on portfolio debt (7) 2.86%
Building Type Presence in Top MSAs (8)
% of Portfolio (based on GLA) % of Portfolio (based on annualized base rent)
Tampa, FL
Phoenix, AZ
Medical Office Buildings 4.4%
Indianapolis, IN 4.3% Hartford/New
95%
4.8% Haven, CT
4.3%
Miami, FL
Atlanta, GA
5.4%
4.2%
Raleigh, NC
Boston, MA 3.5%
6.2%
Houston, TX
Senior Care 6.4%
1%
Hospitals
4%
Dallas, TX
9.9%
Remaining Top
All Other Markets MSAs
5.3% 41.3%
(1) Amount presented in billions. Refer to page 24 for the reporting definition of Investments in Real Estate.
(2) Amounts presented in millions. Total portfolio GLA excludes GLA for projects under development and includes 100% of the GLA of its unconsolidated joint venture.
(3) Calculations are based on percentage of total GLA, excluding GLA for development properties.
(4) Refer to page 25 for the reporting definition of Retention.
(5) Refer to page 24 for the reporting definition of Metropolitan Statistical Area.
(6) Amounts presented in years.
(7) Includes the impact of cash flow hedges.
(8) Refer to page 20 for a detailed table of HTA’ s Key Markets in Top 75 MSA Concentration.
1Q 2022 I Supplemental Information
Healthcare Trust of America, Inc. I 9Financial Statements
Condensed Consolidated Balance Sheets
(unaudited and in thousands, except share and per share data)
As of
1Q22 4Q21
ASSETS
Real estate investments:
Land $ 644,194 $ 640,382
Building and improvements 6,744,865 6,688,516
Lease intangibles 393,756 404,714
Construction in progress 15,673 32,685
7,798,488 7,766,297
Accumulated depreciation and amortization (1,650,257) (1,598,468)
Real estate investments, net 6,148,231 6,167,829
Assets held for sale, net — 27,070
Investment in unconsolidated joint venture 62,454 62,834
Cash and cash equivalents 10,944 52,353
Restricted cash 4,478 4,716
Receivables and other assets, net 350,781 334,941
Right-of-use assets - operating leases, net 228,009 229,226
Other intangibles, net 10,011 10,720
Total assets $ 6,814,908 $ 6,889,689
LIABILITIES AND EQUITY
Liabilities:
Debt $ 3,053,884 $ 3,028,122
Accounts payable and accrued liabilities 159,659 198,078
Liabilities of assets held for sale — 262
Derivative financial instruments - interest rate swaps — 5,069
Security deposits, prepaid rent and other liabilities 78,771 86,225
Lease liabilities - operating leases 196,226 196,286
Intangible liabilities, net 30,001 31,331
Total liabilities 3,518,541 3,545,373
Commitments and contingencies
Equity:
Preferred stock, $0.01 par value; 200,000,000 shares authorized; none issued and outstanding — —
Class A common stock, $0.01 par value; 1,000,000,000 shares authorized; 229,076,322 and
228,879,846 shares issued and outstanding as of March 31, 2022 and December 31, 2021,
respectively 2,291 2,289
Additional paid-in capital 5,180,579 5,178,132
Accumulated other comprehensive income (loss) 1,727 (7,041)
Cumulative dividends in excess of earnings (1,971,904) (1,915,776)
Total stockholders’ equity 3,212,693 3,257,604
Non-controlling interests 83,674 86,712
Total equity 3,296,367 3,344,316
Total liabilities and equity $ 6,814,908 $ 6,889,689
1Q 2022 I Supplemental Information
Healthcare Trust of America, Inc. I 10Financial Statements
Condensed Consolidated Statements of Operations
(unaudited and in thousands, except per share data)
Three Months Ended
1Q22 1Q21
Revenues:
Rental income $ 200,243 $ 191,350
Interest and other operating income 1,759 143
Total revenues 202,002 191,493
Expenses:
Rental 65,884 59,579
General and administrative 12,448 10,560
Merger-related costs 6,018 —
Transaction 144 96
Depreciation and amortization 75,386 76,274
Interest expense 23,940 22,986
Total expenses 183,820 169,495
Loss on sale of real estate, net (4) —
Income from unconsolidated joint venture 400 392
Other income 88 3
Net income $ 18,666 $ 22,393
Net income attributable to non-controlling interests (351) (363)
Net income attributable to common stockholders $ 18,315 $ 22,030
Earnings per common share - basic:
Net income attributable to common stockholders $ 0.08 $ 0.10
Earnings per common share - diluted:
Net income attributable to common stockholders $ 0.08 $ 0.10
Weighted average common shares outstanding:
Basic 228,978 218,753
Diluted 233,046 222,268
Dividends declared per common share $ 0.325 $ 0.320
1Q 2022 I Supplemental Information
Healthcare Trust of America, Inc. I 11Financial Statements
Condensed Consolidated Statements of Cash Flows
(unaudited and in thousands) Three Months Ended
1Q22 1Q21
Cash flows from operating activities:
Net income $ 18,666 $ 22,393
Adjustments to reconcile net income to net cash provided by operating activities:
Depreciation and amortization 71,009 71,671
Share-based compensation expense 2,025 3,337
Income from unconsolidated joint venture (400) (392)
Distributions from unconsolidated joint venture 785 785
Loss on sale of real estate, net 4 —
Changes in operating assets and liabilities:
Receivables and other assets, net (3,229) 2,275
Accounts payable and accrued liabilities (34,131) (27,613)
Security deposits, prepaid rent and other liabilities (5,421) (7,103)
Net cash provided by operating activities 49,308 65,353
Cash flows from investing activities:
Investments in real estate (19,094) (30,472)
Development of real estate (10,372) (17,096)
Proceeds from the sale of real estate 26,791 —
Capital expenditures (28,560) (28,931)
Collection of real estate notes receivable — 200
Loan origination fees 325 —
Advances on real estate notes receivable (2,270) —
Net cash used in investing activities (33,180) (76,299)
Cash flows from financing activities:
Borrowings on unsecured revolving credit facility 75,000 15,000
Payments on unsecured revolving credit facility (50,000) (15,000)
Deferred financing costs (5,355) —
Repurchase and cancellation of common stock (1,641) (3,248)
Dividends paid (74,377) (70,000)
Distributions paid to non-controlling interest of limited partners (1,402) (1,485)
Net cash used in financing activities (57,775) (74,733)
Net change in cash, cash equivalents and restricted cash (41,647) (85,679)
Cash, cash equivalents and restricted cash - beginning of period 57,069 118,765
Cash, cash equivalents and restricted cash - end of period $ 15,422 $ 33,086
1Q 2022 I Supplemental Information
Healthcare Trust of America, Inc. I 12Financial Information
FFO, Normalized FFO, Normalized FAD and Adjusted EBITDAre
(unaudited and in thousands, except per share data)
FFO, Normalized FFO and Normalized FAD Three Months Ended
1Q22 1Q21
Net income attributable to common stockholders $ 18,315 $ 22,030
Depreciation and amortization expense related to investments in real estate 74,799 75,331
Loss on sale of real estate, net 4 —
Proportionate share of joint venture depreciation and amortization 488 488
FFO attributable to common stockholders $ 93,606 $ 97,849
Transaction expenses 144 96
Merger-related costs (1) 6,018 —
Commitment fee amortization (2) 892 —
Non-controlling income from OP units included in diluted shares 351 363
Other normalizing adjustments (3) 514 —
Normalized FFO attributable to common stockholders $ 101,525 $ 98,308
Non-cash compensation expense 2,024 3,337
Straight-line rent adjustments, net (2,828) (3,774)
Amortization of (below) and above market leases/leasehold interests and corporate assets, net 196 621
Amortization of deferred financing costs and debt discount/premium, net (4) 1,223 1,164
Recurring capital expenditures, tenant improvements and leasing commissions (21,855) (10,898)
Normalized FAD attributable to common stockholders $ 80,285 $ 88,758
Net income attributable to common stockholders per diluted share $ 0.08 $ 0.10
FFO adjustments per diluted share, net 0.32 0.34
FFO attributable to common stockholders per diluted share $ 0.40 $ 0.44
Normalized FFO adjustments per diluted share, net 0.04 0.00
Normalized FFO attributable to common stockholders per diluted share $ 0.44 $ 0.44
Weighted average diluted common shares outstanding 233,046 222,268
Adjusted EBITDAre (5) Three Months
Ended
1Q22
Net income $ 18,666
Interest expense 23,940
Depreciation and amortization expense 75,386
Loss on sale of real estate, net 4
Proportionate share of joint venture depreciation and amortization 488
EBITDAre $ 118,484
Transaction expenses 144
Merger-related costs (1) 6,018
Non-cash compensation expense 2,024
Other normalizing adjustments (3) 514
Pro forma impact of investments/dispositions (40)
Pro forma impact of developments 41
Adjusted EBITDAre $ 127,185
Adjusted EBITDAre, annualized $ 508,740
As of March 31, 2022:
Debt $ 3,053,884
Less: cash and cash equivalents 10,944
Net Debt $ 3,042,940
Net Debt to Adjusted EBITDAre 6.0x
(1) For the three months ended March 31, 2022, merger-related costs include the following: (i) financial advisor fees of $3.8 million; (ii) legal fees of $1.8 million; (iii) merger and integration
consulting fees of $0.3 million; and (iv) travel costs of $0.1 million.
(2) For the three months ended March 31, 2022, commitment fee amortization relates to commitment fees on the $1.7 billion bridge loan financing commitment secured in connection with
the contemplated merger transaction with HR.
(3) For the three months ended March 31, 2022, other normalizing adjustments include the following: (i) additional board meeting fees of $159,000; (ii) legal and professional fees related
to the whistleblower investigation of $143,000; (iii) legal fees related to employee retention matters of $131,000; and (iv) professional fees related to strategic review matters of
$81,000.
(4) For the three months ended March 31, 2022, amortization of deferred financing costs does not include amortization of commitment fees on the $1.7 billion bridge loan financing
commitment secured in connection with the pending transaction with HR.
(5) Refer to page 24 for the reporting definitions of EBITDAre, as defined by NAREIT, and Adjusted EBITDAre.
1Q 2022 I Supplemental Information
Healthcare Trust of America, Inc. I 13Financial Information
Debt Composition and Maturity Schedule
(as of March 31, 2022, dollars in thousands)
Debt Composition
Deferred
Principal Financing (Discounts)/
Balance Costs, Net Premium, Net Total Stated Rate (1) Hedged Rate (2)
Unsecured senior note due 2026 $ 600,000 $ (2,020) $ 4,872 $ 602,852 3.50% 3.50%
Unsecured senior note due 2027 500,000 (2,219) (1,448) 496,333 3.75 3.75
Unsecured senior note due 2030 650,000 (4,281) (1,749) 643,970 3.10 3.10
Unsecured senior note due 2031 800,000 (5,733) (5,592) 788,675 2.00 2.00
Total unsecured senior notes $ 2,550,000 $ (14,253) $ (3,917) $ 2,531,830
Unsecured term loan due 2025 300,000 (2,231) — 297,769 1.45% 2.37%
Unsecured term loan due 2024 200,000 (715) — 199,285 1.45 2.32
Total unsecured term loans $ 500,000 $ (2,946) $ — $ 497,054
Unsecured revolving credit facility (3) 25,000 — — 25,000 1.35% 1.35%
Total debt $ 3,075,000 $ (17,199) $ (3,917) $ 3,053,884 2.72% 2.86%
Maturity Schedule (4)
$800,000
$800,000
$700,000
$650,000
$600,000
$600,000
$500,000
$500,000
$400,000
$300,000 $300,000
$200,000
$200,000
$100,000
$25,000
$0
2022 2023 2024 2025 2026 2027 2028 2029 2030 2031
Period Ending
Unsecured Revolving Credit Facility Unsecured Senior Notes Unsecured Term Loans
(1) The stated rate on the debt instrument as of the end of the period.
(2) The effective rate incorporates any cash flow hedges that serve to fix variable rate debt, as of the end of the period.
(3) Rate does not include the 20 basis point facility fee that is payable on the entire $1.0 billion revolving credit facility.
(4) Maturity schedule reflects a new amended and restated $1.3B Unsecured Revolving Credit Facility and Term Loan Agreement entered into in October 2021.
1Q 2022 I Supplemental Information
Healthcare Trust of America, Inc. I 14Financial Information
Capitalization and Covenants
(as of March 31, 2022, dollars and shares in thousands, except stock price)
Capitalization
1Q22
Unsecured revolving credit facility $ 25,000
Unsecured term loans 500,000 Equity
Unsecured senior notes 2,550,000 71%
Secured mortgage loans —
Deferred financing costs, net (17,199)
Discount, net (3,917)
Total debt $ 3,053,884
Less: cash and cash equivalents 10,944
Net debt $ 3,042,940
Stock price (as of March 31, 2022) $ 31.34
Total diluted common shares outstanding 233,127
Unsecured
Equity capitalization $ 7,306,200 Debt
29%
Total capitalization $ 10,349,140
Total undepreciated assets $ 8,465,165
Gross book value of unencumbered assets $ 7,923,093
Total debt/undepreciated assets 36.1%
Net debt/total capitalization 29.4%
Available Capital:
Unsecured Revolving Credit Facility $ 974,690
Cash and Cash Equivalents 10,944
Total Available Capital: $ 985,634
Covenants
1Q22
Term Loan Term Loan
Bank Loans Required Due 2024 Due 2025 Senior Notes Required 1Q22
Total leverage ≤ 60% 37% 35% Total leverage ≤ 60% 37%
Secured leverage ≤ 30% 0% 0%
Secured leverage ≤ 40% 0%
Fixed charge coverage ≥ 1.50x 4.91x 4.91x
Unencumbered asset coverage ≥ 150% 267%
Unencumbered leverage ≤ 60% 37% 36%
Unencumbered coverage ≥ 1.75x 5.46x 5.19x Interest coverage ≥ 1.50x 4.94x
1Q 2022 I Supplemental Information
Healthcare Trust of America, Inc. I 15Portfolio Information
Same-Property Performance and NOI
(as of March 31, 2022, unaudited and dollars and GLA in thousands)
Same-Property Performance
Three Months Ended Sequential Year-Over-Year
1Q22 4Q21 1Q21 $ Change % Change $ Change % Change
Rental revenue $ 130,224 $ 129,324 $ 128,011 $ 900 0.7% $ 2,213 1.7%
Tenant recoveries 42,330 38,562 39,288 3,768 9.8 3,042 7.7
Total rental income 172,554 167,886 167,299 4,668 2.8 5,255 3.1
Expenses 55,124 50,246 50,750 4,878 9.7 4,374 8.6
Same-Property Cash NOI $ 117,430 $ 117,640 $ 116,549 $ (210) (0.2%) $ 881 0.8%
Rental Margin (1) 90.2% 91.0% 91.0%
As of
1Q22 4Q21 1Q21
Number of buildings 424 424 424
GLA 22,600 22,594 22,570
Leased GLA, end of period 20,456 20,422 20,376
Leased %, end of period 90.5% 90.4% 90.3%
Occupancy GLA, end of period 20,060 20,102 20,196
Occupancy %, end of period 88.8% 89.0% 89.5%
NOI (2) Three Months Ended
1Q22 1Q21
Net income $ 18,666 $ 22,393
General and administrative expenses 12,448 10,560
Merger-related costs 6,018 —
Transaction expenses 144 96
Depreciation and amortization expense 75,386 76,274
Interest expense 23,940 22,986
Loss on sale of real estate, net 4 —
Income from unconsolidated joint venture (400) (392)
Other income (88) (3)
NOI $ 136,118 $ 131,914
NOI percentage growth 3.2%
NOI $ 136,118 $ 131,914
Straight-line rent adjustments, net (2,828) (3,774)
Amortization of (below) and above market leases/leasehold interests, net and other GAAP
adjustments (407) (475)
Notes receivable interest income (1,660) (6)
Cash NOI $ 131,223 $ 127,659
Acquisitions not owned/operated for all periods presented and disposed properties Cash NOI (6,280) (2,180)
Redevelopment Cash NOI (2,105) (2,650)
Intended for sale Cash NOI (3) (5,408) (6,280)
Same-Property Cash NOI $ 117,430 $ 116,549
Same-Property Cash NOI percentage growth 0.8%
(1) Rental margin presents Same-Property Cash NOI divided by Same-Property rental revenue.
(2) Refer to pages 24 and 25 for the reporting definitions of NOI, Cash NOI and Same-Property Cash NOI.
(3) With respect to the contemplated merger as described in Recent Highlights, properties intended for sale do not reflect the marketed portfolios either for sale with parties external to the
merger, or anticipated to be contributed to joint ventures. With the exception of the asset sold in 1Q 2022, the properties included in intended for sale are consistent with the
properties in this category as presented in our 4Q 2021 supplemental information, prior to the merger announcement.
1Q 2022 I Supplemental Information
Healthcare Trust of America, Inc. I 16Portfolio Information
Investment Activity
(as of March 31, 2022, dollars and GLA in thousands)
2022 Investments (1)
Date
Acquired/ % Leased at
Property Market Invested Acquisition Purchase Price (2) GLA
Acquisitions:
Cattlemen MOB Tampa, FL February 100% $ 19,000 44
Total Acquisitions $ 19,000 44
2022 Dispositions
Property Market Date Disposed Sales Price GLA
Harbin Clinic (Martha Berry) January $ 26,818 122
Total Dispositions $ 26,818 122
Annual Investment Activity (3)
As of March 31, 2022, HTA has invested $7.8 billion primarily in MOBs, development properties and other healthcare assets comprising 26.0 million square
feet of GLA.
Annual Investment Activity
$2,800,000
$2,722,467
$2,450,000
$2,100,000
$1,750,000
$1,400,000
$1,050,000
$700,000 $802,148
$700,764
$542,976 $557,938
$350,000 $413,150
$455,950 $439,530
$397,826
$294,937 $271,510 $305,884
$17,729 $19,000
$68,314 $191,963
$0 $(82,885) $(35,685) $(39,483) $(85,150) $(4,900) $(24,310) $(26,818)
$(88,250)
$(308,550)
$-350,000
2007 2008 2009 2010 2011 2012 2013 2014 2015 2016 2017 2018 2019 2020 2021 2022
Acquisitions Dispositions
(1) During the three months ended March 31, 2022, HTA also funded the remaining $2,300 on its real estate loan commitments with respect to the Texas Medical Center in Houston,
TX. HTA expects to fund up to $15,500 in total on the CitiSculpt development in Charlotte, NC. No funding was provided on the CitiSculpt development during the three months
ended March 31, 2022.
(2) Excludes corporate assets and land only purchases.
(3) Excludes real estate note receivables and corporate assets.
1Q 2022 I Supplemental Information
Healthcare Trust of America, Inc. I 17Portfolio Information
Development Activity and Property Capital Expenditures
(as of March 31, 2022, dollars and GLA in thousands)
Completed Development Projects
Total
Total % Construction Completed Costs to Expected
Project MSA GLA Leased Cost Costs Complete Stabilization
Jackson South MOB (1) Miami, FL 52 69 21,098 18,694 2,404 2022
Pavilion III MOB (1) Dallas, TX 109 74 59,608 47,237 12,371 2022
Total Completed Development Projects 161 72 $ 80,706 $ 65,931 $ 14,775
Active Development Projects
% Total
Total Leased Construction Costs to Estimated
(3)
Project MSA GLA Cost LTD Costs (4) Complete Completion
Development:
Macon Pond Raleigh, NC 118 — $ 45,071 $ 475 $ 44,596 2023
Houston Heights MOB Houston, TX 109 — 43,614 764 42,850 2024
Horizon Tower (Texas A&M) Houston, TX 477 — 216,000 917 215,083 2024
Total Active Development Projects(2) 704 — $ 304,685 $ 2,156 $ 302,529
Property Capital Expenditures Three Months Ended
1Q22
Recurring capital expenditures $ 6,535
Tenant improvements - 2nd generation 10,489
Lease commissions 4,831
Total recurring capital expenditures $ 21,855
Capital expenditures - 1st generation/acquisition 2,341
Capital expenditures/tenant improvements - redevelopment 4,527
Tenant improvements - 1st generation/acquisition 4,640
Total capital expenditures incurred $ 33,363
During the three months ended March 31, 2022, approximately $0.7 million of capital expenditures were incurred related to environmental, sustainability or other
conservation initiatives.
(1) Annual Cash NOI upon full stabilization of recently completed development projects is expected to approximate $4.9 million. Costs to complete primarily represent tenant
improvements pending completion.
(2) HTA currently has two additional development projects at various stages of the pre-leasing phase, totaling over 170 thousand square feet of GLA with anticipated costs of over
$84 million.
(3) HTA is currently negotiating pre-leasing commitments on over 50% of the total GLA Macon Pond and Houston Heights MOB.
(4) Represents Life-to-Date (LTD) incremental construction costs for assets that have not been placed in service and excludes existing book value of development and
redevelopment assets.
1Q 2022 I Supplemental Information
Healthcare Trust of America, Inc. I 18Portfolio Information
Net Asset Value Components
(as of March 31, 2022, in thousands)
Cash NOI
1Q22 Incremental 1Q22 Annualized
Timing/Other NOI Upon Adjusted Adjusted
Cash NOI Adjustments (1) Stabilization (3) Cash NOI Cash NOI
Same-Store Cash NOI $ 117,430 $ — $ — $ 117,430 $ 469,720
(2)
Acquisitions/Dispositions Cash NOI 5,737 (40) — 5,697 22,788
Unstabilized development assets Cash NOI 543 41 630 1,214 4,856
Intended for sale Cash NOI 5,408 — — 5,408 21,632
Redevelopment Cash NOI 2,105 (2,105) — — —
Total $ 131,223 $ (2,104) $ 630 $ 129,749 $ 518,996
Other Assets
Cash and cash equivalents and restricted cash $ 15,422
(4)
Receivables and other assets 125,846
Investment in unconsolidated joint venture 62,454
Development LTD costs (5) 2,156
Book value of redevelopment assets (6) 336,006
Land parcels held for development 37,495
Total $ 579,379
Obligations
Unsecured revolving credit facility $ 25,000
Unsecured term loans 500,000
Unsecured senior notes 2,550,000
Total debt $ 3,075,000
Accounts payable and accrued liabilities (7) 83,893
Security deposits, prepaid rent and other liabilities (8) 61,864
Total $ 3,220,757
Total Shares Outstanding
Total Diluted Common Shares Outstanding 233,127
(1) Timing and other adjustments include the pro forma impact of current quarter acquisitions and dispositions, the pro forma impact of development properties, as well as the
elimination of Cash NOI for redevelopment assets.
(2) Represents Cash NOI on acquisitions not owned/operated for all periods presented and disposed properties Cash NOI.
(3) Represents incremental Cash NOI on recently completed and unstabilized development assets only. Anticipated incremental Cash NOI upon stabilization of development and
redevelopment assets will be determined upon substantial completion of construction and/or stabilization.
(4) Includes tenant receivables of $3,009, other receivables of $7,402, prepaid expenses, deposits, equipment and other of $42,734 and real estate notes receivable, net of $72,701.
(5) Represents LTD costs on active development projects only.
(6) Represents existing book value on redevelopment assets, for which Cash NOI is excluded from 1Q22 Adjusted Cash NOI.
(7) Excludes accrued dividend distributions of $75,766 which represents our quarterly dividend being declared in one quarter and paid in the next. This accrual is excluded for
purposes of calculating net asset value to provide comparability to REIT peers whose dividends are declared and paid within the same quarter.
(8) Excludes finance right-of-use liability of $16,908.
1Q 2022 I Supplemental Information
Healthcare Trust of America, Inc. I 19Portfolio Information
Key Markets in Top 75 MSA Concentration
(as of March 31, 2022, dollars and GLA in thousands)
Key Markets in Top 75 MSA Concentration (1)
% of
Annualized Annualized Total GLA % of
Key Markets Base Rent (2) Base Rent (3)
% of Portfolio Investment Investment
Dallas, TX $ 57,576 9.9% 2,210 8.5% $ 914,237 11.7%
Houston, TX 37,396 6.4 1,935 7.4 534,869 6.9
Boston, MA 36,495 6.2 965 3.7 397,693 5.1
Miami, FL 31,819 5.4 1,326 5.1 358,449 4.6
Indianapolis, IN 28,086 4.8 1,396 5.4 281,768 3.6
Tampa, FL 25,679 4.4 999 3.8 366,764 4.7
Phoenix, AZ 25,181 4.3 1,316 5.1 267,781 3.4
Hartford/New Haven, CT 25,025 4.3 1,186 4.6 347,104 4.5
Atlanta, GA 24,742 4.2 1,086 4.2 315,771 4.0
Raleigh, NC 20,403 3.5 885 3.4 250,858 3.2
Pittsburgh, PA 20,285 3.5 1,094 4.2 148,612 1.9
Charlotte, NC 18,350 3.1 930 3.6 216,037 2.8
Orange County/Los Angeles, CA 16,970 2.9 719 2.8 326,070 4.2
New York, NY 16,173 2.8 615 2.4 256,144 3.3
Albany, NY 14,924 2.6 832 3.2 170,071 2.2
Chicago, IL 13,827 2.4 455 1.7 231,178 3.0
Denver, CO 13,340 2.3 608 2.3 265,807 3.4
Orlando, FL 12,955 2.2 513 2.0 156,300 2.0
Austin, TX 9,518 1.6 409 1.6 164,425 2.1
El Paso, TX 9,049 1.6 474 1.8 121,409 1.6
Top 20 MSAs 457,793 78.4 19,953 76.8 6,091,347 78.2
Additional Top MSAs 95,618 16.3 4,608 17.7 1,310,406 16.8
Total Key Markets in Top 75
MSAs $ 553,411 94.7% 24,561 94.5% $ 7,401,753 95.0%
All Other Markets 30,701 5.3 1,427 5.5 389,851 5.0
Total All Markets $ 584,112 100% $ 25,988 100% $ 7,791,604 100%
(1) Key markets are titled as such based on HTA’s concentration in the respective MSA.
(2) Refer to page 24 for the reporting definition of Annualized Base Rent.
(3) Total portfolio GLA excludes GLA of projects under development and includes 100% of the GLA of its unconsolidated joint venture.
1Q 2022 I Supplemental Information
Healthcare Trust of America, Inc. I 20Portfolio Information
Portfolio Diversification by Type, Historical Campus Proximity and Ownership Interests
(as of March 31, 2022, dollars and GLA in thousands, except as otherwise noted)
Portfolio Diversification by Building Type
% of
Number of Number of Annualized Annualized % of Total
Buildings States Base Rent (1) Base Rent Total GLA (2) GLA
Medical Office Buildings
Single-tenant 124 18 $ 138,332 23.7% 5,643 21.7%
Multi-tenant 328 32 407,196 69.7 19,037 73.2
Other Healthcare Facilities
Hospitals 15 7 32,798 5.6 954 3.7
Senior care 3 1 5,786 1.0 354 1.4
Total 470 32 $ 584,112 100% 25,988 100%
Portfolio Diversification by Lease Type
% of Total % of
Annualized Annualized Occupied Occupied
Base Rent (1) Base Rent GLA (2) GLA
Absolute net $ 50,400 8.6% 1,715 7.6%
Triple-net 333,883 57.2 13,167 58.0
Modified gross 158,940 27.2 6,208 27.4
Full-service gross 40,889 7.0 1,588 7.0
Total $ 584,112 100% 22,678 100%
Historical Campus Proximity (3)
As of
1Q22 4Q21 3Q21 2Q21 1Q21
Off-Campus Aligned 26% 26% 26% 26% 26%
On-Campus 67 67 67 67 67
On-Campus/Aligned 93% 93% 93% 93% 93%
Off-Campus/Non-Aligned 7 7 7 7 7
Total 100% 100% 100% 100% 100%
Ownership Interests (4)
% of As of (5)
Number of Annualized Annualized
Buildings Base Rent (1) Base Rent GLA (2) 1Q22 4Q21 3Q21 2Q21 1Q21
Fee Simple 325 $ 367,308 63 % 16,399 63% 63% 63% 62% 62%
Customary Health System
Restrictions 138 207,266 35 9,222 36 36 36 36 36
Economic with Limited
Restrictions 6 9,020 2 331 1 1 1 2 2
Occupancy Health System
Restrictions 1 518 — 36 — — — — —
Leasehold Interest Subtotal 145 216,804 37 9,589 37 37 37 38 38
Total 470 $ 584,112 100% 25,988 100% 100% 100% 100% 100%
(1) Refer to page 24 for the reporting definition of Annualized Base Rent.
(2) Total portfolio and total occupied GLA excludes GLA of projects under development and includes 100% of the GLA of its unconsolidated joint venture.
(3) Percentages shown as percent of total GLA. Refer to page 25 for the reporting definitions of Off-campus/Non-Aligned and On-Campus/Aligned.
(4) Refer to pages 24 and 25 for the reporting definitions of Customary Health System Restrictions, Economic with Limited Restrictions, and Occupancy Health System Restrictions.
(5) Percentages shown as percent of total GLA.
1Q 2022 I Supplemental Information
Healthcare Trust of America, Inc. I 21Portfolio Information
New and Renewal Leasing Activity, Historical Leased Rate and Tenant Lease Expirations
(as of March 31, 2022, dollars and GLA in thousands)
New and Renewal Leasing Activity
Average Base Rent (2)
Tenant Leasing
Total GLA Average Term (1) Expiring Starting Improvements (2) Commissions (2)
1Q 2022
New Leases 202 6.5 $ 26.16 $ 35.09 $ 5.11
Renewal Leases 511 4.3 $ 29.14 30.03 7.01 4.12
Total 1Q 2022 713 4.9 $ 28.92 $ 15.01 $ 4.40
Historical Leased Rate (3)
As of
1Q22 4Q21 3Q21 2Q21 1Q21
Total portfolio leased rate 89.3% 89.3% 89.7% 89.3% 89.2%
On-campus/aligned leased rate 89.4 89.3 89.8 89.4 89.3
Off-campus/non-aligned leased rate 88.9 88.9 88.8 87.9 88.7
Total portfolio occupancy rate 87.3 87.5 88.0 87.9 87.9
Tenant Lease Expirations
Annualized Base % of Total
Number of Rent of Expiring Annualized Total GLA of % of GLA of
Expiration Expiring Leases Leases (4) Base Rent Expiring Leases (5) Expiring Leases
Month-to-month 116 $ 6,057 1.0% 221 1.0%
2022 480 44,285 7.6 1,582 6.8
2023 629 63,465 10.9 2,623 11.3
2024 583 71,739 12.3 2,761 11.9
2025 454 57,354 9.8 2,287 9.9
2026 474 52,478 9.0 2,396 10.3
2027 364 71,545 12.2 2,659 11.5
2028 183 36,333 6.2 1,440 6.2
2029 258 46,593 8.0 1,886 8.1
2030 110 31,000 5.3 1,186 5.1
2031 72 23,802 4.1 1,120 4.8
Thereafter 297 79,461 13.6 3,052 13.1
Total 4,020 $ 584,112 100% 23,213 100%
(1) Amounts presented in years.
(2) Amounts presented per square foot of GLA.
(3) Calculations are based on percentage of total GLA, excluding GLA for projects under development, and including 100% of the GLA of its unconsolidated joint venture.
(4) Refer to page 24 for the reporting definition of Annualized Base Rent.
(5) Total portfolio GLA excludes GLA of projects under development and includes 100% of the GLA of its unconsolidated joint venture.
1Q 2022 I Supplemental Information
Healthcare Trust of America, Inc. I 22Portfolio Information
Tenant Profile, Tenant Specialty and Top MOB Tenants
(as of March 31, 2022, dollars and GLA in thousands, except as otherwise noted)
Tenant Profile Tenant Specialty (2)
% of Specialty On-Campus Off-Campus Total
Annualized Annualized
Primary Care (3) 14.9% 17.2% 15.7%
Tenant Classification Base Rent (1) Base Rent
Health Systems/Universities $ 348,477 60% Orthopedics/Sports Medicine 9.1% 8.7% 9.0%
Obstetrics/Gynecology 8.8 3.6 7.0
National/Large Regional Providers 81,980 14
Cardiology 6.5 2.8 5.3
Local Healthcare Providers/Other 153,655 26 Oncology 3.9 2.5 3.4
Total $ 584,112 100% Imaging/Diagnostics/Radiology 3.0 4.8 3.6
Eye and Vision 2.9 3.4 3.1
General Surgery 2.5 3.0 2.6
Other Specialty 36.2 38.0 36.8
Credit Rated Tenancy
Specialty 72.9% 66.8% 70.8%
Investment Grade $ 285,257 49%
Ambulatory Surgery Center 3.7% 5.5% 4.3%
Other Credit Rated 54,097 9
Education/Research 2.8 1.9 2.5
Total Credit Rated $ 339,354 58% Pharmacy 1.0 0.5 0.8
Not Rated/Other 244,758 42 Other 4.7 8.1 5.9
Total $ 584,112 100% Total 100% 100% 100%
Top MOB Tenants (4)
Weighted
Average % of
Remaining Credit Annualized Annualized Total Leased % of Leased
Tenant Lease Term (5) Rating (6) Base Rent (1) Base Rent GLA (7) GLA
Baylor Scott & White Health 5 Aa3 $ 23,980 4.1% 855 3.7%
HCA Healthcare 6 Baa3 22,175 3.8 741 3.2
Highmark-Allegheny Health Network 8 Baa1 17,969 3.1 927 4.0
Tenet Healthcare Corporation 6 B1 14,908 2.5 593 2.6
Ascension 5 Aa2 11,997 2.1 485 2.1
Tufts Medical Center 5 Aa3 11,600 2.0 255 1.1
Steward Health Care 8 NR 10,644 1.8 380 1.6
AdventHealth 4 Aa2 10,349 1.8 407 1.8
Community Health Systems 7 B3 7,989 1.4 385 1.7
CommonSpirit Health 8 Baa1 7,935 1.4 356 1.5
Emblem Health 13 C+ 7,649 1.3 281 1.2
Trinity Health 6 Aa3 7,178 1.2 288 1.2
Indiana University Health 4 Aa2 6,696 1.1 300 1.3
United Health Group 4 A3 6,629 1.1 286 1.2
Mercy Health 5 A1 6,226 1.1 190 0.8
Total $ 173,924 29.8% 6,729 29.0%
(1) Refer to page 24 for the reporting definition of Annualized Base Rent.
(2) Tenant Specialty includes the percentage of total GLA of multi-tenanted clinical MOBs.
(3) Primary Care includes Pediatrics, Family and Internal Medicine.
(4) Represents direct leases with leading MOB health systems and their subsidiaries. Parent tenant credit rating used where direct tenant is not rated.
(5) Amounts presented in years.
(6) Credit ratings from S&P, Moody's or AM Best where appropriate.
(7) Total leased and total portfolio GLA excludes GLA of projects under development and includes 100% of the GLA of its unconsolidated joint venture.
1Q 2022 I Supplemental Information
Healthcare Trust of America, Inc. I 23Reporting Definitions
Adjusted Earnings Before Interest, Taxes, Depreciation and Amortization for Real Estate (“Adjusted EBITDAre”): Adjusted EBITDAre is
presented on an assumed annualized basis. HTA defines Adjusted EBITDAre as EBITDAre (computed in accordance with NAREIT as
defined below) plus: (i) transaction expenses; (ii) gain or loss on extinguishment of debt; (iii) non-cash compensation expense; (iv) pro forma
impact of its acquisitions/dispositions; and (v) other normalizing adjustments. HTA considers Adjusted EBITDAre an important measure
because it provides additional information to allow management, investors, and its current and potential creditors to evaluate and compare its
core operating results and its ability to service debt.
Annualized Base Rent or (“ABR”): Annualized base rent is calculated by multiplying contractual base rent for the end of the period by 12
(excluding the impact of abatements, concessions, and straight-line rent).
Cash Net Operating Income (“Cash NOI”): Cash NOI is a non-GAAP financial measure which excludes from NOI: (i) straight-line rent
adjustments; (ii) amortization of below and above market leases/leasehold interests and other GAAP adjustments; (iii) notes receivable
interest income; and (iv) other normalizing adjustments. Contractual base rent, contractual rent increases, contractual rent concessions and
changes in occupancy or lease rates upon commencement and expiration of leases are a primary driver of HTA’s revenue performance. HTA
believes that Cash NOI, which removes the impact of straight-line rent adjustments, provides another measurement of the operating
performance of its operating assets. Additionally, HTA believes that Cash NOI is a widely accepted measure of comparative operating
performance of real estate investment trusts (“REITs”). However, HTA’s use of the term Cash NOI may not be comparable to that of other
REITs as they may have different methodologies for computing this amount. Cash NOI should not be considered as an alternative to net
income or loss (computed in accordance with GAAP) as an indicator of its financial performance. Cash NOI should be reviewed in
connection with other GAAP measurements.
Credit Ratings: Credit ratings of parent tenants and their subsidiaries.
Customary Health System Restrictions: Ground leases with a health system ground lessor that include restrictions on tenants that may be
considered competitive with the hospital, including provisions that tenants must have hospital privileges.
Economic with Limited Restrictions: Ground leases that are primarily economic in nature and contain no material restrictions on tenancy.
Earnings Before Interest, Taxes, Depreciation and Amortization for Real Estate (“EBITDAre”): As defined by NAREIT, EBITDAre is computed
as net income or loss (computed in accordance with GAAP) plus: (i) interest expense; (ii) income tax expense (not applicable to HTA); (iii)
depreciation and amortization; (iv) impairment; (v) gain or loss on the sale of real estate and corporate assets; and (vi) the proportionate
share of joint venture depreciation and amortization.
Funds from Operations (“FFO”): HTA computes FFO in accordance with the current standards established by NAREIT. FFO is defined as
net income or loss attributable to common stockholders (computed in accordance with GAAP), excluding gains or losses from sales of real
estate property and corporate assets and impairment write-downs of depreciable assets, plus depreciation and amortization related to
investments in real estate, and after adjustments for unconsolidated partnerships and joint ventures. HTA presents this non-GAAP financial
measure because it considers it an important supplemental measure of its operating performance and believes it is frequently used by
securities analysts, investors and other interested parties in the evaluation of REITs. Historical cost accounting assumes that the value of real
estate assets diminishes ratably over time. Since real estate values have historically risen or fallen based on market conditions, many
industry investors have considered the presentation of operating results for real estate companies that use historical cost accounting to be
insufficient by themselves. Because FFO excludes depreciation and amortization unique to real estate, among other items, it provides a
perspective not immediately apparent from net income or loss attributable to common stockholders.
Gross Leasable Area (“GLA”): Gross leasable area in square feet.
Investments in Real Estate: Based on acquisition price.
Leased Rate: Leased rate represents the percentage of total GLA that is leased (excluding GLA for properties under development), including
month-to-month leases and leases which have been executed, but which have not yet commenced, as of the date reported.
Metropolitan Statistical Area (“MSA”): Is a geographical region with a relatively high population density at its core and close economic ties
throughout the area. MSAs are defined by the Office of Management and Budget.
Net Operating Income (“NOI”): NOI is a non-GAAP financial measure that is defined as net income or loss (computed in accordance with
GAAP) before: (i) general and administrative expenses; (ii) transaction expenses; (iii) depreciation and amortization expense; (iv) impairment;
(v) interest expense; (vi) gain or loss on sales of real estate and corporate assets; (vii) gain or loss on extinguishment of debt; (viii) income or
loss from unconsolidated joint venture; and (ix) other income or expense. HTA believes that NOI provides an accurate measure of the
operating performance of its operating assets because NOI excludes certain items that are not associated with the management of its
properties. Additionally, HTA believes that NOI is a widely accepted measure of comparative operating performance of REITs. However,
HTA’s use of the term NOI may not be comparable to that of other REITs as they may have different methodologies for computing this
amount. NOI should not be considered as an alternative to net income or loss (computed in accordance with GAAP) as an indicator of HTA’s
financial performance. NOI should be reviewed in connection with other GAAP measurements.
1Q 2022 I Supplemental Information
Healthcare Trust of America, Inc. I 24You can also read