Functional Annotation of a Full-Length Transcriptome and Identification of Genes Associated with Flower Development in Rhododendron simsii ...
←
→
Page content transcription
If your browser does not render page correctly, please read the page content below
Article

Functional Annotation of a Full-Length Transcriptome and
Identification of Genes Associated with Flower Development
in Rhododendron simsii (Ericaceae)
Qunlu Liu 1, Fiza Liaquat 2, Yefeng He 1, Muhammad Farooq Hussain Munis 3 and Chunying Zhang 4,*

                                          1 Department of Landscape Architecture, School of Design, Shanghai Jiao Tong University,
                                            Shanghai 200240, China; liuql@sjtu.edu.cn (Q.L.); 950201; yf@sjtu.edu.cn (Y.H.)
                                          2 School of Agriculture and Biology, Shanghai Jiao Tong University, Shanghai 200240, China;

                                            fiza.liaquat@bs.qau.edu.pk
                                          3 Department of Plant Sciences, Faculty of Biological Sciences, Quaid-I-Azam University,

                                            Islamabad 45320, Pakistan; munis@qau.edu.pk
                                          4 Shanghai Engineering Research Center of Sustainable Plant Innovation, Shanghai Botanical Garden,

                                            Shanghai 200231, China; mayzhang55@163.com
                                          * Correspondence: mayzhang55@163.com

                                          Abstract: Rhododendron simsii is one of the top ten famous flowers in China. Due to its historical
                                          value and high aesthetic, it is widely popular among Chinese people. Various colors are important
                                          breeding objectives in Rhododendron L. The understanding of the molecular mechanism of flower
                                          color formation can provide a theoretical basis for the improvement of flower color in Rhododendron
Citation: Liu, Q.; Liaquat, F.; He, Y.;
                                          L. To generate the R. simsii transcriptome, PacBio sequencing technology has been used. A total of
Munis, M.F.H.; Zhang, C. Functional       833,137 full-length non-chimeric reads were obtained and 726,846 high-quality full-length tran-
Annotation of a Full-Length               scripts were found. Moreover, 40,556 total open reading frames were obtained; of which 36,018 were
Transcriptome and Identification of       complete. In gene annotation analyses, 39,411, 18,565, 16,102 and 17,450 transcriptions were allo-
Genes Associated with Flower              cated to GO, Nr, KEGG and COG databases, correspondingly. To identify long non-coding RNAs
Development in Rhododendron simsii        (lncRNAs), we utilized four computational methods associated with Protein families (Pfam), Coop-
(Ericaceae). Plants 2021, 10, 649.        erative Data Classification (CPC), Coding Assessing Potential Tool (CPAT) and Coding Non Coding
https://doi.org/10.3390/                  Index (CNCI) databases and observed 6170, 2265, 4084 and 1240 lncRNAs, respectively. Based on
plants10040649
                                          the results, most genes were enriched in the flavonoid biosynthetic pathway. The eight key genes
                                          on the anthocyanin biosynthetic pathway were further selected and analyzed by qRT-PCR. The
Academic Editor: Thomas
                                          F3′H and ANS showed an upward trend in the developmental stages of R. simsii. The highest ex-
Nussbaumer
                                          pression of F3′5′H and FLS in the petal color formation of R. simsii was observed. This research
Received: 27 February 2021
                                          provided a huge number of full-length transcripts, which will help to proceed genetic analyses of
Accepted: 24 March 2021                   R. simsii. native, which is a semi-deciduous shrub.
Published: 29 March 2021
                                          Keywords: Rhododendron simsii; transcriptome; full length transcript; alternative splicing
Publisher’s Note: MDPI stays neu-
tral with regard to jurisdictional
claims in published maps and insti-
tutional affiliations.                    1. Introduction
                                                Rhododendron is one of the largest genera in the Ericaceae family, with several species
                                          having high horticultural value and being grown as ornamental plants all over the world.
                                          The genus contains 580 species in six subgenera in China, with approximately 420 being
Copyright: © 2021 by the authors.
                                          endemic, including several species described after the publication of the Flora of China
Licensee MDPI, Basel, Switzerland.
                                          [1]. Numerous varieties of Rhododendron have been cultured, and it has become one of the
This article is an open access article
distributed under the terms and con-
                                          most popular flowering shrubs in the world. Their colorful flowers are the most attractive
ditions of the Creative Commons At-
                                          traits. Plant flower color is the result of the synergistic effect of many factors, but it is
tribution (CC BY) license (http://cre-    fundamentally due to the presence of specific pigments in petal cells [2]. At present, the
ativecommons.org/licenses/by/4.0/).       plant pigments can be divided into four categories: flavonoids, carotenoids, chlorophyll,

Plants 2021, 10, 649. https://doi.org/10.3390/plants10040649                                                          www.mdpi.com/journal/plants
Plants 2021, 10, 649                                                                                        2 of 13

                       and alkaloid pigments. The flower color is mainly affected by the first three kinds of fla-
                       vonoids. Flavonoids are the main pigments, most of which exist in plant vacuoles, so that
                       the petals show red, purple red and other colors [3]. Flavonoids (flavonoids) are the most
                       widely existing plant polyphenols in nature, which are classified according to their struc-
                       tural characteristics, including anthocyanin (anthocyanin), flavonoids alcohol (flavonols),
                       flavonoids (flavones), etc. [4]. Thin-layer chromatography was previously used to explore
                       the flavonoid pigments that contribute to petal coloration in azalea cultivars and contain
                       the anthocyanins cyanidin 3-O-galactoside, cyanidin 3-O-glucoside, cyanidin 3-O-arabi-
                       noside, cyanidin 3,5-di-O-glucoside, cyanidin 3-O-arabinoside-5-O-glucoside, peonidin
                       3,5-di-O-glucoside and malvidin 3,5-di-O-glucoside, as well as flavonols azaleatin, quer-
                       cetin, myricetin and their glycoside derivatives [5].
                             Anthocyanins are the main pigment groups that determine the color of plant flowers,
                       the most common of which include (cyanidin), (pelargonidin), (petunidin), (delphindin),
                       (peonindin), etc. [6]. It was considered that the anthocyanins contained (Cy), (Dp), (Pe),
                       (Mv) and (Pt), which were usually in the form of anthocyanins. Anthocyanin is the most
                       concerned natural plant pigment in the related research of flower color improvement, and
                       its biosynthesis pathway is also one of the clearest secondary metabolic pathways in
                       plants [7]. Recent discoveries have enabled genome and transcriptome knowledge in nu-
                       merous species. However, R. simiisi genome and transcriptome sequencing has lagged
                       behind that of other organisms, and knowledge of the sequence and structure of its genes
                       is poor. As a result, the generation of transcriptome data may provide a significant molec-
                       ular biology foundation for the reanalysis.
                             However, up to date, no researcher has studied the transcriptomic and full-length
                       transcript of R. simissi using single-molecule long-read sequencing. Recent discoveries
                       demonstrate that PacBio’s single-molecule real-time (SMRT) sequencing technology is a
                       more efficient method of obtaining full-length transcripts [8]. Both model and non-model
                       organisms have had their transcriptomes analyzed using SMRT sequencing technology
                       [9]. Furthermore, transcriptome sequencing is a low-cost and easy strategy for developing
                       large-scale SSRs. Many non-model plants have confirmed the discovery of SSR markers
                       through RNA sequencing and their effective use in genetic improvement in recent years
                       [10–12]. Since the establishment of large scale sequencing technology, to study gene ex-
                       pression regulation transcripts sequencing has become a key source, after the whole ge-
                       nome sequencing of humans was completed [13]. With its advantage of long-read length,
                       high-quality full-length transcript information can be directly obtained to identify simple
                       sequence repeat (SSR) and fulfill the functional annotation of transcripts and long non-
                       coding RNAs prediction (lncRNA) [14,15].
                             In this study, Single Molecule Real-Time (SMRT) sequencing was performed to gen-
                       erate a full-length transcriptome of R. simissi. Based on the acquired transcriptome data,
                       we performed functional annotations of transcripts, transcript factors (TFs) and simple
                       sequence repeat (SSR) analysis, and lncRNA prediction.
                             Through the analysis of the expression pattern of differentially expressed genes, this
                       provides important significance for further analyzing the molecular mechanism of the
                       color formation of Rhododendron and promoting the cultivation and breeding of Rhododen-
                       dron in China. This research may be a useful resource for further investigation of molecu-
                       lar mechanisms related to R. simissi.

                       2. Materials and Methods
                       2.1. Plant Materials
                            Line “Y4” of Rhododendron simsii with cardinal flowers (Red-group 39B) was utilized
                       as materials in this article. The 10-year-old “Y4” plants were cultivated in Shanghai bo-
                       tanical garden (31°08′46.88″ N, 121°26′39.85″ E), Shanghai, China. According to [16], the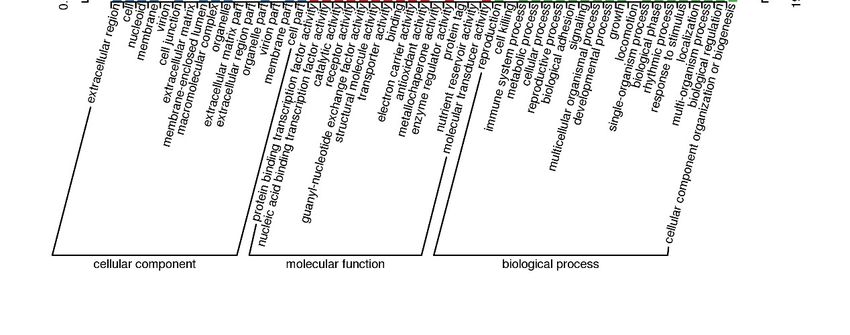
Plants 2021, 10, 649                                                                                      3 of 13

                       development of the R. simsii flower was divided into bud, early coloring and full-flower-
                       ing stages (Figure 1). The fresh petals at the three stages were immediately preserved in
                       liquid nitrogen after collection, and stored at −80 °C until extraction of RNA.

                       Figure 1. Three developmental stages of R. simsii flower.

                       2.2. RNA Extraction
                            Plant tissues (0.2 g petals) were used for the extraction of RNA by using RNeasy plus
                       Mini Kit (Qiagen, Valencia, CA, USA). After observing RNA on agarose gel, its quality
                       and quantity were determined using Qubit 2.0 (Thermo Fisher Scientific, USA). RNA
                       quality was also distinctly described by Qubit® RNA Assay and RNA 6000 Nano Assay
                       Kit. For PacBio sequencing, all the samples were present in ≥300 ng/µl concentration and
                       >1µg RNA was used for sequencing.

                       2.3. Library Construction and SMRT Sequencing
                             For sequencing, C2 sequencing reagents were used in Pacific Biosciences (PacBio)
                       real-time sequencer. Purified RNA was used to synthesize cDNA using SMRT PCR Syn-
                       thesis Kit (Clontech, USA). Full-length cDNA of different sizes was selected and cDNA
                       libraries were constructed using the BluePippin® (SageScience, Beverly, MA, USA). After
                       BluePippin screening, the fragments were subjected to large-scale PCR to obtain sufficient
                       total cDNA and quantified by using Qubit fluorometer (Life Technologies, Carlsbad, CA,
                       USA). The libraries’ uniqueness was maintained by using the Agilent Bioanalyzer 2100
                       system, and SMRT sequencing was achieved.

                       2.4. Error Correction and Quality Filtering
                            Sequence statistics were obtained by using the SMRTlink 5.1 software. To create CCS
                       by subread BAM files, specific parameters such as min_length 50, min_zscore −9999.0,
                       min_passes 2, max_drop_fraction 0.8, no_polish TRUE, min_predicted_accuracy 0.8, and
                       max_length 15,000 were followed. The output was CCS.BAM filest, which were catego-
                       rized into full length and non-full length reads by using pbclassify.py. Non-full length
                       and full-length FASTA files produced were then fed into cluster step, and extra nucleotide
                       errors in the consensus reads were corrected by LoRDEC software. Any redundancy in
                       corrected consensus reads was removed by CD-HIT (-c 0.95 -T 6 -G 0 -aL 0.00 -aS 0.99) to
                       obtain final transcripts for the subsequent analysis.

                       2.5. Functional Annotation of Transcripts
                             We recognized functional annotations matching each unique transcript by searching
                       NR       [17],    NT,    Protein    families    (Pfam)   (http://pfam.xfam.org)     KOG
                       (http://www.ncbi.nlm.nih.gov/COG/) [18], Swiss-prot (http://www.ebi.ac.uk/uniprot/)
                       [19], KEGG (http://www.genome.jp/kegg/) [20] and GO [21]. We used BLAST software
                       (with “1e-10” e-value) in the NT database using Diamond BLASTX v2.7.1
                       (ftp://ftp.ncbi.nlm.nih.gov/blast/executables/blast+/LATEST/). The same e-value (“1e-10”)
                       was set in NR, KOG, Swiss-Prot, KEGG and Pfam database analysis.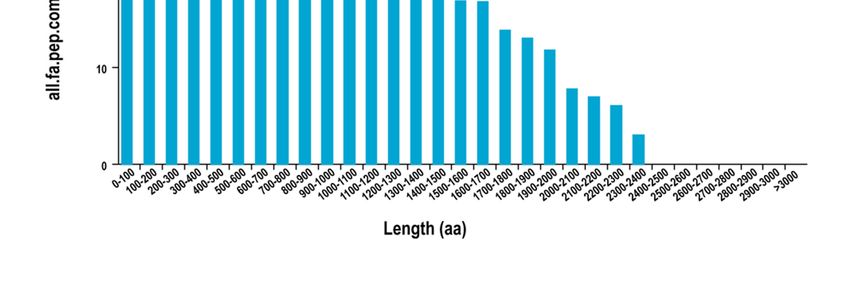
Plants 2021, 10, 649                                                                                                      4 of 13

                                     2.6. Identification of TFs, lncRNAs and SSR
                                           Plant    transcription    factors    were      predicted   using     iTAK    v1.7a
                                     (https://github.com/kentnf/iTAK/ ) [22]. Four tools, CNCIv2 (https://github.com/www-bi-
                                     oinfo-org/CNCI ) [23], CPCvcpc-0.9-r2 (http://cpc.cbi.pku.edu.cn/ ) with e-value “1e-10”
                                     [24], Pfam-scan (E 0.001 -domE 0.001) [25] and PLEKv1.2 (https://sourceforge.net/pro-
                                     jects/plek/ ) with min length 200 [26], were chosen to predict candidate long non-coding
                                     RNAs (lncRNAs). Transcripts predicted with coding potential by either/all of the above
                                     mentioned tools were filtered out, and those without coding potential were considered as
                                     a candidate set of lncRNAs. Transcript sequences were examined for homology via
                                     searches against the non-redundant nucleotide database (Nr) 25, Swiss-Prot protein26,
                                     protein family (pfam) 27, non-supervised orthologous groups (eggNOG)28, clusters of
                                     orthologous groups of proteins (COG)29, eukaryotic ortholog groups (KOG) 30, gene on-
                                     tology (GO) 31, kyoto encyclopedia of genes and genomes (KEGG) 32 databases with
                                     BLAST alignment (E-value ≤ 10−5).

                                     2.7. Development of SSR Markers
                                         SSRs were identified by MISA v1.0 (http://pgrc.ipk-gatersleben.de/misa/ ) [27], with
                                     default parameters. MISA can recognize seven SSR types (mono, di, tri, tetra, penta and
                                     hexa nucleotide compound SSR) by analyzing transcript sequences.

                                     2.8. qRT-PCR analysis
                                          The fresh petals at the three stages were used for RNA extraction via RNeasy plus
                                     Mini Kit (Qiagen, Valencia, CA, USA). The cDNA was synthesized by using SMART PCR
                                     cDNA synthesis kit (Clontech, CA, USA). In the reaction mixture of qPCR, SYBR green
                                     (10 µL), ddH2O (7.2 µL), primers (0.4 µL) and cDNA (2.0 µL) were used. The qPCR reac-
                                     tion was performed at 94 °C for 40 s followed by 30 cycles of 94 °C for 10s, 94 °C for 40 s,
                                     54 °C for 30 s and 72 °C for 90 s. At the end, the reaction was kept at 72 °C for 5 min. The
                                     primers used for PCR are listed in Table 1.

                                              Table 1. The primers used for qRT-PCR analysis.

   Primer ID                   Gene ID                        Forward Primer                         Reverse Primer
 RhCHS                 F01_transcript/61502       GCTTACCGTCGAGACCGTGG                     AACAATGGGCCTCACCAGCC
 RhCHI                 F01_transcript/68926       GCCGCGTTGGAGCAAATTGT                     CCCCCTGGTTCCACCCAAAT
 RhF3H                 F01_transcript/64242       CTCACTCTCGGCCTCAAGCG                     TGCCTCAGGGGCTGGATTCT
 RhDFR                 F01_transcript/64345       GGCTTCATCGGCTCATGGCT                     TCCGCTTTGGGCAACTCCAG
 RhANS                 F01_transcript/40426       CTCCTTCTCCTCCACCGGCT                     GGGGGTTGTTCCAGGTGGTG
 RhF3’H                F01_transcript/54870       CGATCCCCACCACTCCATC                      AAGAACTGTGCGGCAACCGA
 RhF3’5’H              F01_transcript/50526       TGCTGACTACGGCCCGAGAT                     GGTATCACCACTGCCTCGCC
 RhMYB1                F01_transcript/63169       ACTCGAGCTGTAGCCCACCA                     CGTTCGGAAGACGAGCCTCC
 RhMYB2                F01_transcript/66405       GGCAACTGGAGGTCTCTGCC                     CCGGCAGCCTTCCTGCTATG
 RhbHLH1               F01_transcript/65059       CCCTTTCGGCTATGCTGCGA                     CCCTTTCGGCTATGCTGCGA
 RhbHLH2               F01_transcript/50357       CTTGGTTGCTTCGGCCTCCA                     ACCTCACTCCCTCTCGCCTC

                                     3. Results and Analysis
                                     3.1. Single Molecule Real Time Sequencing (SMRT)
                                          The qualified RNAs extracted from petals of R. simsii “Y” flowers at bud, early color-
                                     ing and full-flowering stages were used to construct the full-length cDNA library (1–2 kb,
                                     2–3 kb, and >3 kb). Single molecular real time (SMRT) sequencing was performed to gen-
                                     erate the continuous long reads exploiting Pacbio RS II platform. Total 40G clean data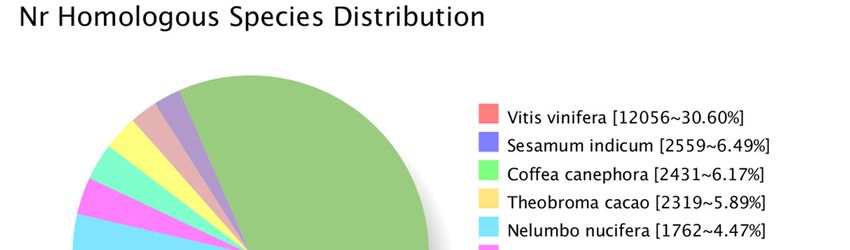
Plants 2021, 10, 649                                                                                         5 of 13

                       were obtained from the qualified polymerase reads (length > 50 bp, accuracy > 0.90) after
                       the adapter sequences were removed. According to the full passes number (≥ 1) and accu-
                       racy (> 0.90), 833,137 circular consensus (CCS) reads were screened out, and the average
                       length of CCS read was 2758bp (Table 2). Among the total CCS reads, 87.24% (726,846) of
                       reads were identified as the full length non-chimeric (FLNC) reads. Then, the FLNC reads
                       were analyzed with the algorithm of iterative clustering to obtain 71,727 consensus
                       isoforms. After error correction and polishing, 71,210 high-quality (> 0.99) consensus
                       isoforms were filtrated. The low-quality consensus isoforms were proofread with the
                       clean data obtained by Illumina next generation sequencing. After reducing the redun-
                       dancy, 41,112 full-length unigenes were filtrated from the consensus isoforms.

                       Table 2. Summary of reads of inserts from single-molecule long-read sequencing.

                       Sample cDNA              Read Bases of             Mean Read Length of      Mean Number of
                                     CCS Number
                          s     size                CCS                          CCS                   Passes
                         F01   1–6 k   833,137  2,298,485,998                    2758                    19

                       3.2. Open Reading Frame and Alternative Splicing Event Prediction
                            Using the software TransDecoder, 40,566 Open Reading Frames (ORF) were to be
                       found. The sum of 36,018 complete ORFs and the length distribution of the complete ORFs
                       were analyzed (Figure 2). Around all transcripts acquired by SMRT sequencing, 2844 al-
                       ternative splicing (AS) events were examined (Table S1). Due to the absence of an availa-
                       ble R. simsii reference genome, further characterization of the types of AS events would
                       be warranted in predicted studies.

                       Figure 2. Distribution of predicted CDS encoded protein length.

                       3.3. Long Non-Coding RNA Identification
                            Long non-coding RNAs (lncRNAs) are a class of poly-A non-coding RNAs that play
                       roles in three stages of the plant. In this research, four computational approaches were
                       used to recognize lncRNAs, including Coding Assessing Potential Tool (CPAT), Cooper-
                       ative Data Classification (CPC), Coding Non Coding Index (CNCI) and Pfam databases.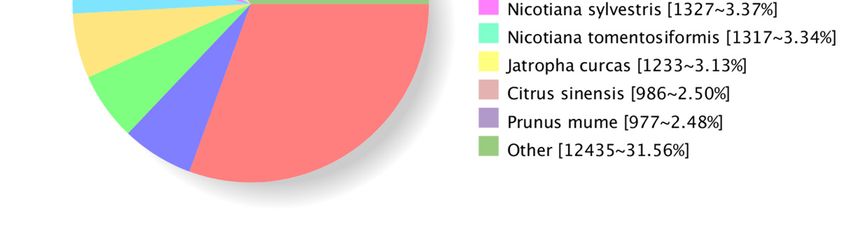
Plants 2021, 10, 649                                                                                      6 of 13

                       A total of 1104, 2265, 6170 and 4084 lncRNAs were recognized in the CPAT, CNCI, CPC,
                       and Pfam databases, respectively (Table S2). By screening transcripts of less than 300 bp,
                       5155 transcripts were evaluated as lncRNAs by all methods (Figure 3).

                       Figure 3. Venn diagram of long non-coding RNAs (lncRNAs) CPC: coding potential cal-
                       culator; CNCI: coding-noncoding index; CPAT: coding potential assessment
                       tool; Pfam: s protein families.

                       3.4. Transcription Factor Prediction
                            TFs play a major role in plant growth development and are the key regulators of gene
                       expression. According to the recent work, 6005 putative TFs were allocated and classified
                       into 64 families (Table S3). The TFs in the R. simsii transcriptome mainly belong to the
                       CH3 (208, 3.46%), GRAS (175, 2.91%), MYB-related (222, 3.70%), FAR1 (155, 2.58%), SNF2
                       (131, 2.18%), mTERF (131, 2.18%), bHLH (131, 2.18%), B3-ARF (115, 1.92%), SET (111,
                       1.85%), and RLK-Pelle-DLSV (109, 1.78%) families (Figure 4).

                              Figure 4. Distribution of transcription factor types.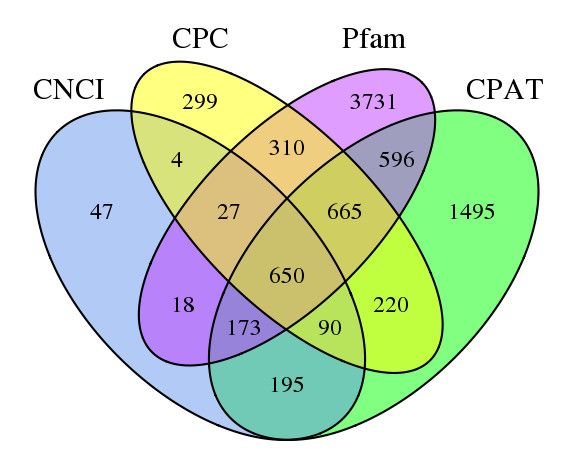
Plants 2021, 10, 649                                                                                                             7 of 13

                                 3.5. Functional Annotation of Transcripts
                                      All 726,846 unique SMRT transcripts were functionally annotated by seven data stor-
                                 ages, such as gene ontology (GO), eukaryotic ortholog groups (KOG), Protein family
                                 (Pfam), Swissport (15), COG (17), COG (18) and KEGG (20) by using BLAST (7) software
                                 (version 2.2.26) (Table 3).

                                 Table 3. Summary of functional annotation of S. superba transcriptome.

                                                  Annotated Databases                                    Isoform Number
                                                         COG                                                  16,102
                                                          GO                                                  18,565
                                                        KEGG                                                  17,450
                                                         KOG                                                  25,787
                                                         Pfam                                                 34,156
                                                        Eggnog                                                29,498
                                                      Swiss-Prot                                              38,933
                                                          Nr                                                  39,411
                                                          All                                                 39,521

                                      By comparing the transcript sequence to NR with homologous species, among them
                                 are Vitis vinifera (12,056), Sesamum indicum (2559), Coffea canephora (2431) and Theobroma
                                 cacao (2319), which were the top four distributed species of transcripts, as shown in Figure
                                 5.

                                 Figure 5. The classification statistics of Nr-annotated species in transcripts.

                                      Function annotation of the non-redundant unigenes was conducted by searching
                                 against the main databases. A total of 95.86% (39,411) of the non-redundant unigenes were
                                 annotated in NR, 18,565 unigenes in GO, 16,102 unigenes in COG, 38,933 unigenes in egg-
                                 NOG, 17,450 unigenes in KEGG, 25,787 unigenes in KOG, 34,156 unigenes in Pfam, and
                                 29,498 unigenes in Swissport. In total, 96.13% (39,521) non-redundant unigenes were an-
                                 notated, and more than 90% of the unigenes were longer than 1Kb (Table 4).

                       Table 4. Summary of functional annotation for the non-redundant unigenes of R. simsii.

                                                                300~1000 bp                                   ≥1000 bp
     Databases              Unigene Number
                                                          Number        Percentage                 Number                Percentage
         NR                    39,411                     2171             5.51%                  37,230                   94.47%
         GO                    18,565                     1521             8.19%                  17,040                   91.79%
        COG                    16,102                     800              4.97%                  15,300                   95.02%
      eggNOG                   38,933                     2115             5.43%                  36,811                   94.55%
Plants 2021, 10, 649 8 of 13
KEGG 17,450 1109 6.36% 16,336 93.62%
KOG 25,787 1249 4.84% 24,534 95.14%
Pfam 34,156 1699 4.97% 32,454 95.02%
Swiss-Prot 29,498 1521 5.16% 27,971 94.82%
All 39,521 2201 5.57% 37,310 94.41%
3.6. GO Classified Transcripts
Transcripts’ GO classification statistics demonstrated 18,565 unique genes, which
were enriched in major categories of molecular function, cellular component, biological
component and catalytic activity (Figure 6). This analysis also helped us to obtain tran-
scripts’ COG classification statistics.
Figure 6. Transcript GO annotation classification statistics graph.
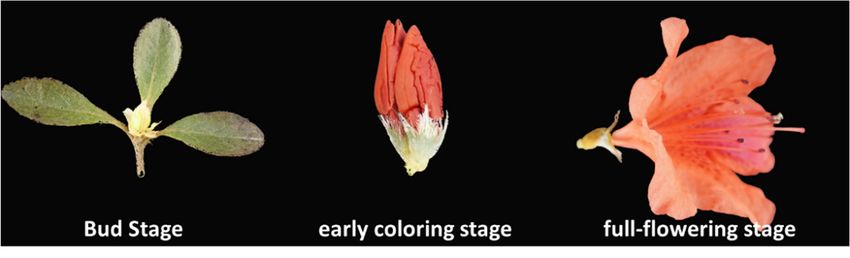
3.7. COG Function Classification
To further research the functional classification of R. simsii, all transcripts were sub-
jected to a search against the Clusters of COG database. This analysis indicated that 16,102
transcripts were allocated to 24 groups (Figure 7). The highest category was general func-
tion prediction (4930, 20.19%), followed by transcription (2936, 12.02%), and afterwards
replication recombination and repair (2842, 11.64%). The six groups were in the range of
less than 1%, including extracellular structure, nuclear structure and cell motility, nucle-
otide transport and metabolism and chromatin structure and dynamics.Plants 2021, 10, 649 9 of 13
Figure 7. COG annotation classification statistics of transcripts.
3.8. KEGG Annotated Transcripts
KEGG data storage interpreted a total of 67,426 sequences and plotted 367 operative
categories in R. simsii. Among them, metabolism was the largest category. The functional
annotations of all 78,559 unique transcripts were detected in this study (Table S4). A large
number of genes, especially interrelated in the salt-tolerance and fatty acid component of
S. superba, were annotated, such as oxidative phosphorylation (1073), plant hormone sig-
nal transduction (506), fatty acid biosynthesis (246), the biosynthesis of unsaturated fatty
acids (94) and α-linolenic acid metabolism (199). We also identified matches to our unique
transcripts in clusters of orthologous groups of proteins (COG) (44,376, 56.49%), Pfam da-
tabase (41,535, 52.87%) and Swiss-Port (58,535, 74.51%) (Table 5).
Table 5. The best 15 pathways annotated by the KEGG database.
No. Name of Pathway Pathway ID No of Transcripts (%)
1. Carbon metabolism ko01200 605 (3.47%)
2. Protein processing in endoplasmic reticulum ko04141 608 (3.48%)
3. Biosynthesis of amino acid ko01230 525 (3.01%)
4. Spliceosome ko03040 700 (4.01%)
5. Ribosome ko03010 491 (2.81%)
6. RNA transport ko03013 558 (3.20%)
7. Starch and sucrose metabolism ko00500 377 (2.16%)
8. Plant hormone signal transduction ko04075 470 (2.69%)
9. Oxidative phosphorylation ko00190 280 (1.60%)
10. Glycolysis/gluconeogenesis ko00010 322 (1.85%)
11. Plant pathogen interaction ko04626 324 (1.86%)
12. mRNA surveillance pathway ko03015 469 (2.69%)
13. Ubiquitin mediated proteolysis ko04120 321 (1.84%)
14. Amino sugar and nucleotide sugar metabolism ko00520 271 (1.55%)
15. Endocytosis ko04144 251 (1.44%)
3.9. Expression Analysis in qRT PCR
For the expression analysis of potential high expression genes, the anthocyanin path-
way was selected for qRT analysis. A total of 67 transcripts were recognized throughPlants 2021, 10, 649 10 of 13
KEGG analysis (Table S5). Among them, nine genes related to anthocyanin were selected
for qRT PCR analysis (Table S6). The results of qRT PCR analysis showed that the expres-
sion level of CHS in the bud stage increased continuously and reached the highest level
in the early flowering stage, and then decreased in the flowering stage (Figure 8a). CHI
shows higher expression in the bud stage than CHS (Figure 8a). The expression of F3H in
the flowering period was highest, and then decreased (Figure 8b). These upstream genes
have low expression in the blooming period, so we can speculate that the expression of
upstream genes in promoting the biosynthesis of anthocyanin before the blooming period
was completed. The downstream genes ANS and DFR are the genes directly regulating
the synthesis of anthocyanin, which maintain a high expression level in the flower devel-
opment stage (Figure 8).
0.12 1.2
(a) S1 S2 S3 (b) S1 S2 S3
Relative expression level
Relative expression level
0.1 1
0.08 0.8
0.06 0.6
0.04 0.4
0.02 0.2
0 0
CHS CHI F3'5'H DFR F3H F3'H FLS ANS
Genes related with anthocyanin biosynthesis Genes related with anthocyanin biosynthesis
Figure 8. Comparison of expression profiles of eight representative genes measured by qRT-PCR.
4. Discussion
Since the development of high-throughput sequencing technology, transcriptomic
analysis has become a valuable technology to study gene expression and regulation. How-
ever, due to the read length limitation of the second-generation sequencing in different
organisms, the full-length transcript obtained by splicing is not complete. SMRT sequenc-
ing technology has effectively solved this problem.
In the past few years, the sequencing technology of three generations of full-length
transcripts, represented by the PacBio platform, has slowly entered the field of vision.
Compared with RNA-Seq sequencing technology, this sequencing technology avoids PCR
amplification and reduces the cost and sequencing time, realizes the reaction speed and
continuity of DNA polymerase in itself, and can directly measure RNA sequences with
high accuracy [28]. As most non-model organisms lack genome data, it is particularly im-
portant to obtain full-length transcriptional group sequencing data. Full-length transcripts
can greatly promote the basic and applied research on gene function, gene expression reg-
ulation and evolutionary relationships in these species [29]. With the maturity of the third
generation sequencing technology and the great decrease in cost, full-length transcrip-
tional group sequencing technology has been gradually applied in some plant transcrip-
tional group research cases in recent years [30].
In past years, the PacBio platform sequenced the full-length transcriptional group of
tea (Camellia sinensis) [31]. Finally, 213,389 polished consensus sequences were obtained,
223,120 CDS sequences were predicted, 195,062 SSR loci were detected, and 5785 tran-
scription factors belonging to 60 transcription factor families were predicted.
The PacBio RS II platform to analyze the full-length transcription group of sunflow-
ers, the 10.43Gb clean data, was obtained, and 38,302 de-redundant sequences were ob-
tained [32]. The 44 differentially expressed genes were divided into eight families, all of
which were involved in the biosynthesis of flavonoids. This study is the first transcrip-
tome analysis using SMRT sequencing technology in R. simiisi. The sequencing peaks
were gained from samples of leaves using the Pacific Biosciences Iso-Seq platform. APlants 2021, 10, 649 11 of 13
mixed pool of an equal amount of RNA from three developmental stages in R. simsii gen-
erated 40 Gb clean data from the PacBio platform. These data were corrected by Illumina
clean reads after the integration and quality control of data from the two platforms. A
total of 39,510 unigenes were annotated, and 6005 transcription factors were identified.
After sequencing, 833,137 circular consensus (CCS) reads were obtained, including
726,846 full-length reads non-chimeric (FLNC) sequences. The full-length non-chimeric
sequences were clustered to obtain 71,727 consensus sequences, and 71,210 high-quality
consensus sequences were obtained by polishing the consensus sequences. The low-qual-
ity consensus sequences were corrected with the second-generation transcriptome data,
and they were consistent with high-quality. The sequences were merged and subjected to
de-redundancy analysis to obtain 41,112 transcript sequences. Each sample obtained 2844
alternative splicing events, and a total of 44,205 SSR and 36,018 complete CDS regions
were obtained.
Among some of the foremost important ornamental characteristics of Rhododendron
is flower color. Recent studies indicated that (CHS, CHI, F3H, DFR, ANS, FLS, F3’H,
F3’5’H) are the key enzymes involved in the anthocyanin biosynthesis pathway [33]. For
this research, a sum of 67 key enzymes were allocated related to anthocyanin, and to ana-
lyze the expression eight key genes (RhCHS, RhCHI, RhF3H, RhDFR, RhANS, RhFLS,
RhF3’H, RhF3’5’H) involved in the anthocyanin biosynthesis pathway, they were selected
for subsequent analysis. Based on the data of sequencing, eight key enzyme genes were
analyzed. It can be seen that the genes showing obvious differences mainly lie in the pro-
cess from bud to early flowering stage, which is consistent with the significant change in
expression at the early flowering stage, and most of the differentially expressed genes
have shown quite high expression at the bud stage. It can be inferred that the expression
of the flower color synthesis gene is before the formation of flower buds. In order to fur-
ther understand the difference in the expression patterns of the screened structural genes
and transcription factors in the process of color formation, the co-expression patterns of
the screened structural genes were analyzed. The results showed that the expression of
CHS increased continuously at the bud stage, reached the highest level at the beginning
of flowering, and then decreased sharply at the flowering stage. According to the results
[34] in R. pulchrum at S1 stage, five genes (CHS, CHI, F3H, ANS and DFR) were expressed,
and the expression of CHS, F3H and ANS was the highest at the S1 stage and decreased
during the development of the flower. The expression trend of CHI at bud stage was the
same as that of CHS. CHI already showed ultra-high expression at the bud stage, and then
decreased significantly at the flowering stage. The same as other results [35], our results
also shown that the expression of F3H was the highest at the bud stage and then de-
creased, and these upstream genes decreased to the lowest level at the flowering stage.
Downstream genes ANS and DFR are genes that directly regulate anthocyanin synthesis,
maintain high expression at the flower development stage, and show an upward trend
from the bud stage to the flowering stage, but do not change obviously from the early
flowering stage to the flowering stage, indicating that the coloring stage was completed
before the early flowering stage. The expression levels of DFR, FLS and ANS were mark-
edly higher at early stages than at later stages, according to an analysis of anthocyanin
biosynthesis-related genes [36]. As a key gene involved in the synthesis of flavonoids, the
expression of the FLS gene reached the highest level from the bud stage to the early flow-
ering stage and then decreased during the development of petals, indicating that the bio-
synthesis of flavonoids was completed at the early flowering stage, and flavonoids af-
fected the formation of flower color. This study has provided enriched information about
the expression and regulation of genes from the bud to flowering stage of R. simiisi. In
addition, this study provided for the first time a full length transcriptome of R. simsii using
the SMRT sequencing method.Plants 2021, 10, 649 12 of 13
5. Conclusions
In this study, we first used PacBio platform based third-generation sequencing tech-
nology combined with full-length transcriptome sequencing of a mixed petal sample from
three developmental stages of Rhododendron simiisi. A total of 41,112 sequences were ob-
tained. The full-length transcripts were compared with major databases, and 39,510 se-
quences were annotated. KEGG has obtained a relatively complete biosynthetic pathway
of anthocyanins of Rhododendron, which provides the basis for follow-up studies of antho-
cyanin metabolism in Rhododendron. By functional annotation analysis of full-length tran-
scripts, 67 key enzyme genes were screened out. These genes may be related to the for-
mation of R. simiisi. These structural genes and regulatory genes are the important re-
search objects of our next differential gene expression analysis. The transcriptome design
in this research will assist future research on functional genomics and facilitate support
for advanced genetic engineering of R. simiisi.
Supplementary Materials: The following are available online at www.mdpi.com/2223-
7747/10/4/649/s1, Table S1: Summary of the predicted alternative splicing (AS) events, Table S2:
Summary of lncRNA predicted by CPC, CNCI, CPAT, and Pfam protein structure domain analysis,
Table S3: Summary of identified TFs, Table S4: Summary of the transcripts annotated to the
reference canonical pathways in the KEGG database, Table S5: Summary of the genes in
anthocyanin biosynthesis pathway.
Author Contributions: C.Z. designed the experiments and supervised the research work. Q.L.
executed the experiments and wrote the manuscript. F.L. analyzed the results and formatted the
manuscript. Y.H. collected the samples. S.F. carried out data compilation. All authors read and
approved the final manuscript. All authors have read and agreed to the published version of the
manuscript.
Funding: This research is financially supported by Shanghai Sciences and Technology Commission
Project No: 18DZ2283500.
Institutional Review Board Statement: Not applicable
Informed Consent Statement: Not applicable
Data Availability: Data are available at the SRA portal (http://www.ncbi.nlm.nih.gov/biopro-
ject/678851 (accessed on 20 March 2021) of NCBI, accession number: PRJNA678851.
Conflicts of Interest: We confirm that all the authors in our manuscript have no conflicts of interest.
References
1. Cai, L.; Neilsen, J.; Dao, Z.L.; Ma, Y.P. Rhododendron longipedicellatum (Ericaceae), a new species from Southeastern Yunnan,
China. Phytotaxa 2016, 282, 296–300.
2. Proestos, C.; Boziaris, I.S.; Nychas, G.J.; Komaitis, M. Analysis of flavonoids and phenolic acids in Greek aromatic plants:
Investigation of their antioxidant capacity and antimicrobial activity. Food Chem. 2006, 95, 664–671.
3. Castañeda-Ovando, A.; Sedo, O.; Havel, J.; Pacheco, L.; Galán-Vidal, C.A.; López, E.C. Identification of anthocyanins in red
grape, plum and capulin by MALDI-ToF MS. J. Mex. Chem. Soc. 2012, 56, 378–383.
4. Fang, Z.Z.; Zhou, D.R.; Ye, X.F.; Jiang, C.C.; Pan, S.L. Identification of candidate anthocyanin-related genes by transcriptomic
analysis of ‘Furongli’plum (Prunus salicina Lindl.) during fruit ripening using RNA-seq. Front. Plant Sci. 2016, 7, 1338.
5. Mizuta, D.; Nakatsuka, A.; Ban, T.; Miyajima, I.; Kobayashi, N. Pigment composition patterns and expression of anthocyanin
biosynthesis genes in Rhododendron kiusianum, R. kaempferi, and their natural hybrids on Kirishima Mountain Mass, Japan.
J. Jpn. Soc. Hortic. Sci. 2013, 83, 156–162.
6. Khoo, H.E.; Azlan, A.; Tang, S.T.; Lim, S.M. Anthocyanidins and anthocyanins: Colored pigments as food, pharmaceutical
ingredients, and the potential health benefits. Food Nutr. Res. 2017, 61, 1361779.
7. Zeng, J.; Chen, J.; Kou, Y.; Wang, Y. Application of EST-SSR markers developed from the transcriptome of Torreya grandis
(Taxaceae), a threatened nut-yielding conifer tree. PeerJ 2018, 6, e5606.
8. Peng, Z.; Hu, Y.; Xie, J.; Potnis, N.; Akhunova, A.; Jones, J.; Liu, S. Long read and single molecule DNA sequencing simplifies
genome assembly and TAL effector gene analysis of Xanthomonas translucens. BMC Genom. 2016, 17, 1–19.
9. Zhang, J.; Liu, C.; He, M.; Xiang, Z.; Yin, Y.; Liu, S.; Zhuang, Z. A full-length transcriptome of Sepia esculenta using a
combination of single-molecule long-read (SMRT) and Illumina sequencing. Mar. Genom. 2019, 43, 54–57.Plants 2021, 10, 649 13 of 13
10. Chen, J.; Li, R.; Xia, Y.; Bai, G.; Guo, P.; Wang, Z.; Siddique, K.H. Development of EST-SSR markers in flowering Chinese cabbage
(Brassica campestris L. ssp. chinensis var. utilis Tsen et Lee) based on de novo transcriptomic assemblies. PLoS ONE 2017, 12,
e0184736.
11. Wang, S.; Wang, X.; He, Q.; Liu, X.; Xu, W.; Li, L.; Wang, F. Transcriptome analysis of the roots at early and late seedling stages
using Illumina paired-end sequencing and development of EST-SSR markers in radish. Plant Cell Rep. 2012, 31, 1437–1447.
12. Yagi, M.; Yamamoto, T.; Isobe, S.; Hirakawa, H.; Tabata, S.; Tanase, K.; Onozaki, T. Construction of a reference genetic linkage
map for carnation (Dianthus caryophyllus L.). BMC Genom. 2013, 14, 734.
13. Chaisson, M.J.; Huddleston, J.; Dennis, M.Y.; Sudmant, P.H.; Malig, M.; Hormozdiari, F.; Eichler, E.E. Resolving the complexity
of the human genome using single-molecule sequencing. Nature 2015, 517, 608–611.
14. Levy, S.E.; Myers, R.M. Advancements in next-generation sequencing. Annu. Rev. Genom. Hum. Genet. 2016, 17, 95–115.
15. Jiao, W.B.; Schneeberger, K. The impact of third generation genomic technologies on plant genome assembly. Curr. Opin. Plant
Biol. 2017, 36, 64–70.
16. Slatko, B.E.; Gardner, A.F.; Ausubel, F.M. Overview of next-generation sequencing technologies. Curr. Protoc. Mol. Biol. 2018,
122, e59.
17. Wang, Z.; Sun, X.; Zhao, Y.; Guo, X.; Jiang, H.; Li, H.; Gu, Z. Evolution of gene regulation during transcription and translation.
Genome Biol. Evol. 2015, 7, 1155–1167.
18. Xie, J.; Zuo, J.; Huang, Y.; Li, C.; Chen, Y. The origin and germplasm collection for cultivated Dendrobium officinale K. Kimura
& Migo individuals revealed by EST-SSR markers. Genet. Resour. Crop Evol. 2020, 67, 1209–1219.
19. Wang, J.; Zhu, J.; Zhang, Y.; Fan, F.; Li, W.; Wang, F.; Yang, J. Comparative transcriptome analysis reveals molecular response
to salinity stress of salt-tolerant and sensitive genotypes of indica rice at seedling stage. Sci. Rep. 2018, 8, 1–13.
20. Kanehisa, M.; Goto, S.; Kawashima, S.; Okuno, Y.; Hattori, M. The KEGG resource for deciphering the genome. Nucleic Acids
Res. 2004, 32, D277–D280.
21. Ashburner, M.; Ball, C.A.; Blake, J.A.; Botstein, D.; Butler, H.; Cherry, J.M.; Harris, M.A. Gene ontology: Tool for the unification
of biology. Nat. Genet. 2000, 25, 25–29.
22. Zheng, L.; Jiao, W.; Song, H.; Qu, H.; Li, D.; Mei, H.; Tong, Q. miRNA-558 promotes gastric cancer progression through
attenuating Smad4-mediated repression of heparanase expression. Cell Death Dis. 2016, 7, e2382.
23. Sun, L.; Luo, H.; Bu, D.; Zhao, G.; Yu, K.; Zhang, C.; Zhao, Y. Utilizing sequence intrinsic composition to classify protein-coding
and long non-coding transcripts. Nucleic Acids Res. 2013, 41, e166.
24. Kong, L.; Zhang, Y.; Ye, Z.Q.; Liu, X.Q.; Zhao, S.Q.; Wei, L.; Gao, G. CPC: Assess the protein-coding potential of transcripts
using sequence features and support vector machine. Nucleic Acids Res. 2007, 35, W345–W349.
25. Finn, R.D.; Coggill, P.; Eberhardt, R.Y.; Eddy, S.R.; Mistry, J.; Mitchell, A.L.; Salazar, G.A. The Pfam protein family’s database:
Towards a more sustainable future. Nucleic Acids Res. 2016, 44, D279–D285.
26. Wu, Y.; Zhang, L.; Wang, Y.; Li, H.; Ren, X.; Wei, F.; Hao, X. Long noncoding RNA HOTAIR involvement in cancer. Tumor Biol.
2014, 35, 9531–9538.
27. Beier, S.; Thiel, T.; Münch, T.; Scholz, U.; Mascher, M. MISA-web: A web server for microsatellite prediction. Bioinformatics 2017,
33, 2583–2585.
28. Byrne, A.; Cole, C.; Volden, R.; Vollmers, C. Realizing the potential of full-length transcriptome sequencing. Philos. Trans. R. Soc.
B 2019, 374, 20190097.
29. Wu, L.; Zhang, X.; Zhao, Z.; Wang, L.; Li, B.; Li, G.; Rao, W. Full-length single-cell RNA-seq applied to a viral human cancer:
Applications to HPV expression and splicing analysis in HeLa S3 cells. Gigascience 2015, 4, 51.
30. Ozsolak, F. Third-generation sequencing techniques and applications to drug discovery. Expert Opin. Drug Discov. 2012, 7, 231–
243.
31. Wei, C.; Yang, H.; Wang, S.; Zhao, J.; Liu, C.; Gao, L.; Sun, J. Draft genome sequence of Camellia sinensis var. sinensis provides
insights into the evolution of the tea genome and tea quality. Proc. Natl. Acad. Sci. USA 2018, 115, E4151–E4158.
32. Zhao, L.; Zhang, H.; Kohnen, M.V.; Prasad, K.V.; Gu, L.; Reddy, A.S. Analysis of transcriptome and epitranscriptome in plants
using PacBio Iso-Seq and nanopore-based direct RNA sequencing. Front. Genet. 2019, 10, 253.
33. Li, L.; Zhai, Y.; Luo, X.; Zhang, Y.; Shi, Q. Comparative transcriptome analyses reveal genes related to pigmentation in the petals
of red and white Primula vulgaris cultivars. Physiol. Mol. Biol. Plants 2019, 25, 1029–1041.
34. Soza, V.L.; Lindsley, D.; Waalkes, A.; Ramage, E.; Patwardhan, R.P.; Burton, J.N.; Hall, B. The Rhododendron genome and
chromosomal organization provide insight into shared whole-genome duplications across the heath family (Ericaceae). Genome
Biol. Evol. 2019, 11, 3353–3371.
35. Han, M.; Yang, C.; Zhou, J.; Zhu, J.; Meng, J.; Shen, T.; Li, H. Analysis of flavonoids and anthocyanin biosynthesis-related genes
expression reveals the mechanism of petal color fading of Malus hupehensis (Rosaceae). Braz. J. Bot. 2020, 43, 81–89.You can also read