Four layer ConvNet to facial emotion recognition with minimal epochs and the significance of data diversity - Nature
←
→
Page content transcription
If your browser does not render page correctly, please read the page content below
www.nature.com/scientificreports
OPEN Four‑layer ConvNet to facial
emotion recognition with minimal
epochs and the significance of data
diversity
Tanoy Debnath1, Md. Mahfuz Reza1, Anichur Rahman1,2, Amin Beheshti3,
Shahab S. Band4* & Hamid Alinejad‑Rokny5,6,7*
Emotion recognition is defined as identifying human emotion and is directly related to different
fields such as human–computer interfaces, human emotional processing, irrational analysis,
medical diagnostics, data-driven animation, human–robot communication, and many more. This
paper proposes a new facial emotional recognition model using a convolutional neural network.
Our proposed model, “ConvNet”, detects seven specific emotions from image data including anger,
disgust, fear, happiness, neutrality, sadness, and surprise. The features extracted by the Local
Binary Pattern (LBP), region based Oriented FAST and rotated BRIEF (ORB) and Convolutional
Neural network (CNN) from facial expressions images were fused to develop the classification model
through training by our proposed CNN model (ConvNet). Our method can converge quickly and
achieves good performance which the authors can develop a real-time schema that can easily fit the
model and sense emotions. Furthermore, this study focuses on the mental or emotional stuff of a
man or woman using the behavioral aspects. To complete the training of the CNN network model,
we use the FER2013 databases at first, and then apply the generalization techniques to the JAFFE
and CK+ datasets respectively in the testing stage to evaluate the performance of the model. In the
generalization approach on the JAFFE dataset, we get a 92.05% accuracy, while on the CK+ dataset,
we acquire a 98.13% accuracy which achieve the best performance among existing methods. We also
test the system’s success by identifying facial expressions in real-time. ConvNet consists of four layers
of convolution together with two fully connected layers. The experimental results show that the
ConvNet is able to achieve 96% training accuracy which is much better than current existing models.
However, when compared to other validation methods, the suggested technique was more accurate.
ConvNet also achieved validation accuracy of 91.01% for the FER2013 dataset. We also made all the
materials publicly accessible for the research community at: https://github.com/Tanoy004/Emotion-
recognition-through-CNN.
The face is also known as the mental core. As an assortment of facial gestures, the face can give several mini-
mal signals. These exquisite signals can make human–machine interaction more secure and harmonious when
interpreted by computers. A good source of knowledge for ordering an individual’s true e motions1 was argued
for facial expressions. Recognition of facial expression (FER) is one of the most critical non-verbal processes
by which human–machine interface (HMI) systems can understand2 human intimate emotions and intentions.
1
Department of Computer Science and Engineering, Mawlana Bhashani Science and Technology University,
Tangail, Bangladesh. 2Department of Computer Science and Engineering, National Institute of Textile Engineering
and Research (NITER), Constituent Institute of Dhaka University, Savar, Dhaka 1350, Bangladesh. 3Department
of Computing, Macquarie University, Sydney, NSW 2109, Australia. 4Future Technology Research Center,
CollegeofFuture, National Yunlin University of Science and Technology, 123 University Road, Section 3, Douliou,
Yunlin 64002, Taiwan. 5BioMedical Machine Learning Lab (BML), The Graduate School of Biomedical Engineering,
UNSW Sydney, Sydney, NSW 2052, Australia. 6UNSW Data Science Hub, The University of New South Wales
(UNSW Sydney), Sydney, NSW 2052, Australia. 7Health Data Analytics Program, Department of Computing,
AI-Enabled Processes (AIP) Research Centre, Macquarie University, Sydney 2109, Australia. *email:
shamshirbands@yuntech.edu.tw; h.alinejad@unsw.edu.au
Scientific Reports | (2022) 12:6991 | https://doi.org/10.1038/s41598-022-11173-0 1
Vol.:(0123456789)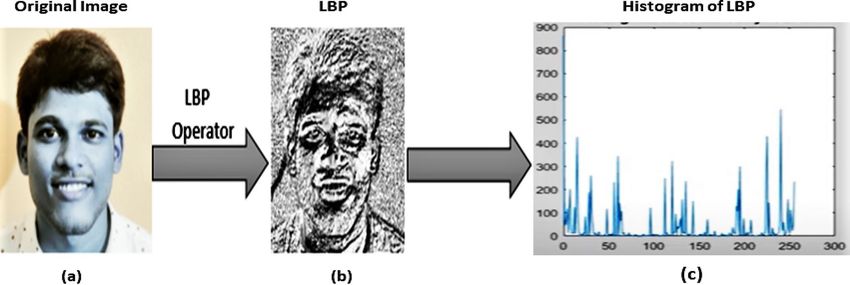
www.nature.com/scientificreports/
Figure 1. A simple structural view of facial expression recognition system.
This scheme is a classification task. The classifier takes as input a set of characteristics that are derived from the
input image, which is simply shown in Fig. 1.
Gabor wavelet t ransform3, Haar wavelet t ransform4, Local Binary Pattern (LBP), and Active Presence Mod-
els (AAM)5 are the feature extraction methods based on static images. Whereas dynamic-based6–8 approaches
assume the temporal association in the sequence of input facial expression within clinging frames. Support
Vector Machine (SVM), Hidden Markov Model, AdaBoost, and Artificial Neural Networks (ANN)9 are widely
used schemes for facial expression recognition. A major advancement in the field of deep learning and the
implementation of CNN has been quite p romising10–12. However, a massive issue with the use of deep learning
is that a large amount of data is required to learn successful models.
While some improvement in the identification of facial expression has been made by the CNN algorithm,
some detachments are still present, including too long training times and low recognizing rates in the complex
environment. In existing databases, two challenges have been observed in deep learning achievements in FER
methods: (1) a low number of images, and (2) images taken from heavily structured conditions. These concerns
inspired the creation of FER techniques focused on the set of Web i mages13,14. The present work focuses mainly
on the creation of a multimodal, intelligent HMI system that operates in a real-time context.
This research aims to determine the emotion of a facial emotional input image. In this paper the authors do a
more reliable and detailed study on deep learning both for static and dynamic FER tasks until 2020. This study is
concerned with the creation of an automated facial expression recognition (AFER) system in the domain of facial
expression using Convolutional Neural Networks (CNNs) and improving the accuracy of this mission. Orthodox
machine learning algorithms used for handcrafted features typically have equivalents that do not have the dura-
bility to reliably interpret a task15. This is a fair starting point for us to examine the use of fused LBP-ORB and
CNN features, since with CNN-based models16, we have obtained the best solutions to recent FER-relevant tasks.
Facial recognition requires several phases: detection of face images, preprocessing of face images, retrieval
of facial features, alignment of face images, and identification of face images. There are primarily two types of
extraction of features: one is geometric attribute extraction, and the other is a procedure which focused on total
statistical characteristics. To describe the location of facial organs as the features of the c lassification17, the geo-
metrical feature-based approach is widely used.
This paper aims at creating a method for the use of CNN to build a FER scheme. The presented model can
be used in real-time using a webcam to categorize human faces. The contributions to this paper are as follows:
• The authors suggest a CNN method for recognizing seven facial expressions and real-time detection of facial
expressions using the fusion of Convolutional Neural Network (CNN), Local Binary Pattern (LBP) features
and Oriented FAST and rotated BRIEF (ORB).
• The authors propose a four-layer ‘ConvNet’ model for this system with the best uses of CNN parameters.
• This research reveals that combining images from different databases helps to increase generalization and to
improve the accuracy of teaching.
• It can contain enhanced testing techniques, such as preparation, testing, and validating processes, and pro-
vides findings that reflect greater consistency by longer training sets instead of training and testing sets.
• The performance of the “ConvNet” architecture is evaluated on both large and small datasets. Our system
appears to be capable of attaining excellent performance in both situations, according to the results.
• This work achieves a training accuracy of over 95% in a minimal number of epoch, showing that the model
is well adjusted to the method. The classification accuracy obtained by the generalization techniques with
three datasets are 91.05%, 92.05% and 98.13%, respectively.
This work aims to create a model that can classify seven distinct emotions: happy, sad, surprise, angry, disgust,
neutral, and fear, and to achieve better accuracy than the b aseline18. Besides this, the main goal of this research
is to examine and understand the advantages of using deep convolutional neural network models over other
deep learning models.
Background knowledge and literature reviews
Background study. Analyze of facial expression. Automatic facial expression analysis (AFEA) can be used
in many areas, including relational and semantic communication, clinical psychology, psychiatry, neurology,
pain assessment, lie detection, intelligent settings, and multimodal human–computer interface (HCI). Face col-
lection, facial data extraction and representation, and recognition of facial expression are three steps of the
standard approach to AFEA composition, as depicted in Fig. 2. There are mainly two types of techniques for
facial feature extraction: geometric or predictive feature-based methods and methods based on appearances.
The authors used the combination of statistical appearance-based and geometric feature-based approaches in
this article.
Scientific Reports | (2022) 12:6991 | https://doi.org/10.1038/s41598-022-11173-0 2
Vol:.(1234567890)
www.nature.com/scientificreports/
Figure 2. The basic framework of applications in many areas for automatic facial expression analysis.
Figure 3. Summary flowchart for the three phases of the Facial Expression Recognition (FER) method.
Facial emotion recognition (FER). Face detection is a key role in FER. There are different strategies to face rec-
ognition, including the expression-based approach, the framework approach, the feature-based approach, and
the neighborhood graph a pproach19. The three-stage flow map of the facial expression recognition process seen
in the Fig. 3.
Structure of CNN. At first, we see a simple CNN template with several building blocks that we can easily
understand and correlate to the proposed CNN model. Three types of layers make up a basic CNN as illustrated
in Fig. 4, input, hidden, and output. The data enters the CNN via the input layer and then travels through many
hidden levels before reaching the output layer. The network’s prediction is reflected via the output layer. In terms
of loss or error, the network’s output is compared to the actual labels.
The hidden layers in the network act as a basic building element for data transformation. The four sub-func-
tions: layer function, Pooling, Normalization and Activation can be dissected from each layer. The Convolutional
neural network architecture consists of the following layers20. We also discuss the CNN model parameters in
the perspective of our study.
• Convolution layer
In the case of a Convolutional Neural Network, the primary goal of convolution is to extract features from
the input picture. By learning image features (i.e., filtering with tiny squares of input data), convolution pre-
serves the spatial relationship between pixels. The terms ’filter’, ’kernel’, and ’feature detector’ are used by CNN.
The ’Convolved Feature’ or ’Activation Map’ or ’Feature Map’ is the matrix created by sliding the filter across the
picture and computing the dot product. Filter size and stride (the number of pixels after which the filter should
be changed) are selected in this layer. (W–F + 2P)/S + 1 = O is the output of the convolutional layer, where F, P, S
means spatial extent, stride and padding respectively. Neurons do not "fit" smoothly and uniformly across the
input if stride is not chosen properly. As a result, zero padding is utilized throughout the image in order to fit
neurons properly.
• ReLu layer
Scientific Reports | (2022) 12:6991 | https://doi.org/10.1038/s41598-022-11173-0 3
Vol.:(0123456789)
www.nature.com/scientificreports/
Figure 4. The template for a basic CNN (a simple CNN template with several building blocks).
Every negative value from the filtered picture is eliminated and replaced with zero in this layer. This is done
to prevent the values from adding up to zero. The Rectified Linear Unit transform function only activates a node
if the input exceeds a specific threshold; else, the output is zero. The value of the activation function of ReLu is
that its gradient is always equal to 1 (shown in Eq. 1), meaning that during back-propagation, most of the error
ack21,22.
is transferred b
f (x) = max(0, x) (1)
• Pooling layer
A pooling layer’s purpose is to minimize the spatial dimensionality of the corrected feature map, resulting in
a more compact feature extraction. A pooled featured map is the result of this pooling layer. The two most com-
mon pooling strategies are maximum pooling and mean pooling. In the Max Pooling techniques, the maximum
parameter is taken out at each step and the rest is lowered. Along with, the network is simply down-sampled by
this. To calculate pooling layer, the formula is (I + 2P − F)/S + 1 = O, where I, S, P, F means input matrix, stride,
padding and filter respectively.
• Fully connected layer
Fully Connected Layer remaps a pooled feature map from a two-dimensional structure to a one-dimensional
vector, or feature vector. The result is a pooled feature map that has been "flattened". For classification, this feature
vector acts as a standard Fully connected layer.
• Softmax
Softmax is implemented through a neural network layer just before the output layer. As the output layer, the
Softmax layer must have the same number of nodes.
• Batch normalization
Batch normalizer speeds up the training process and adds a transition which keeps the mean activation near
0 and the standard activation deviation close to 1.
Literature reviews
Facial communication studies have been carried out for years. But for any experiment, there was still room for
progress. That is why this topic is convenient. The key objective of the researchers is to enhance the precision of
a basic data collection FER2013 in Ref.23. The authors have used CNN as the methodology for their proposed
model to define seven critical emotions. While overall accuracy has been obtained at 91%, the identification rate
is only 45% and 41% respectively in classifying disgust and fear.
The authors of this paper24 propose a method that combines orientated FAST and rotated BRIEF (ORB)
characteristics with facial expression-derived Local Binary Patterns (LBP) features. Finally, a Support Vector
Machine is used to classify the combined characteristics (SVM). The suggested technique is tested on various
Scientific Reports | (2022) 12:6991 | https://doi.org/10.1038/s41598-022-11173-0 4
Vol:.(1234567890)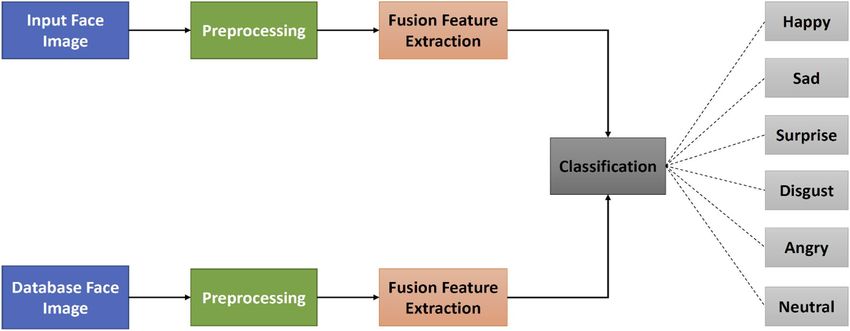
www.nature.com/scientificreports/
difficult databases, including the Cohn–Kanade database (CK+), the Japanese Female Facial Expressions database
(JAFFE), and the MMI database, with accuracy rates of 93.2%, 88.5%, and 79.8% respectively.
In Ref.25, the writers have identified facial expressions based on CNN. In comparison to other approaches,
the proposed FER approach is a major challenge in machine learning, focused on mixed instances taken from
multiple datasets. Experimental results reveal that the six universal expressions can be specifically defined by
the FER process. In the recent past, a multimodal speech emotion recognition and classification techniques have
been proposed by Christy et al.26. For classification and prediction, algorithms such as linear regression, decision
tree, random forest, support vector machine (SVM) and convolutional neural networks (CNN) are used in this
article. The authors tested their model with the RAVDEES dataset and, compared to decision tree, random forest
and SVM, CNN showed 78.20% accuracy in identifying emotions.
In the discussion of the prediction system or algorithm, the a uthors27 used a large milking dataset to test
multiple machine learning-based prediction algorithms to find the best predictive models of sub-clinical mastitis.
The Z transformation approach was used to offer a platform for the models developed to be applied to additional
farms. The non-transformed milking dataset and a Z-standardized dataset were both subjected to several predic-
tion methods. Gradient-Boosted Tree (GBT) and Deep Learning (DL) outperform other models in these systems.
In terms of predicting subclinical bovine mastitis, GBT was the most accurate model (with an accuracy of 84.9
percent). These results show how these models may be used to predict subclinical mastitis in a variety of bovine
herds, regardless of size or sampling technique.
Though there are some limitations to this study, such as the models not being converted to a web applica-
tion for easy access and use by biologists and clinicians, it does show that the two prediction models (GBT and
DL) can accurately forecast sub-clinical mastitis based on multiple milking variables, confirming the power of
machine-based prediction in solving one of the oldest problems in the dairy cattle industry. In a residual block
based CNN method, the first part of this w ork28 introduces a unique idea of electrode-frequency distribution
maps (EFDMs) based on a short-time Fourier transform (STFT). For automated feature extraction and emotion
detection with EFDMs, a residual block based deep convolutional neural network (CNN) is suggested. Based on
a short length of EEG data on SEED, the suggested technique earned an average classification score of 90.59%,
which is 4.51% higher than the baseline method. Then, using deep model transfer learning and a few data, the
pre-trained model was applied to DEAP, yielding an average accuracy of 82.84%.
Wang et al.29 proposed a novel concept of EFDMs with STFT based on multiple channel EEG signals. The
pre-trained model was then introduced to DEAP with a few samples by profound model transmission, resulting
in 82.84% accuracy on average. Jung and a ssociates7 investigated FER with a profound learning approach, which
integrates two deep networks that derive faces appearance (using convolutional layers) and geometric features
from face landmarks (using completely linked layers), with a 97.3% accuracy of CK+ findings. The authors
suggested a computer vision FER method in Ref.30. In the process, the gray-scale face picture was consolidated
into a 3-channel input with the corresponding basic LBP and an average LBP feature map. This thesis won the
Emotiw 2017 award with the best submission reaching 60.34% accuracy. Francesca Nonis et al.31 suggested 3D
approaches and problems in FER Algorithms. This research would address the problem of facial identity through
the interpretation of human feelings, focusing on 3D approach, grouping and arranging all the works and differ-
ent techniques. The average accuracy of recognition of expressions varies from 60 to 90%. Certain expressions,
such as anger and fear, have usually the lowest recognition levels.
Smitha Rao et al.32 recently proposed a CNN-LSTM based Neural Network for six fundamental emotions,
Angry, Happy, Sad, Fear, Disgust, and Neutral, which was trained on the CREMA-D dataset and evaluated on
the RAVDEES dataset. The study focuses on the usage of LSTM networks, which are capable of employing a
sequence of data to help in the overall prediction of emotions in a movie. On the CREMA-D dataset, they attained
an accuracy of 78.52%, while on the RAVDEES dataset, they achieved an accuracy of 63.35%.
A facial expression recognition system has been introduced by N. V eeranjaneyulu33 in which facial charac-
teristics by use of deep neural features much better than handcrafted ones are. The extraction function is con-
ducted using the VGG16 algorithm and deep CNN models are classed. The suggested accuracy of the system is
demonstrated by the CK+ dataset. In Ref.34, the authors have introduced a 3-dimensional neural video emotion
detection network. The findings are contrasted with cross-validation approaches. The crafted 3D-CNN generates
97.56% with the cross-validation of Leave-on-Sujet-Out, and 100% with 10 times CK+ and 84.17% with 10 times
Cross-validation on Oulu-CASIA. Deep learning methods for facial recognition are presented in this paper35
for effective identification and detection. The face characteristics, on the other hand, are collected in real time
and analyzed with haar cascade detection. Face detection, identification, and emotion classification are the three
main aims of the proposed study. Finally, using the KDEF dataset, the accuracy of automated face identification
and recognition is assessed at 63.88%.
The analysis of facial expression recognition has some drawbacks, according to the authors. Such as the
model’s use and lack of friendliness, inability to catch feelings or actions in complex contexts, participant short-
ness with a need for more accuracy, a deficit in detecting effectiveness about EEG signals, and so on. Although
there has been more research on combining impact identification and usability testing, their functional applica-
bility and interference with user experience testing still need to be analyzed further. In Ref.36, without needing
any pre-processing or feature extraction tasks, the authors demonstrate the classification of FER based on static
images, using CNNs. In a seven-class classification assignment, the authors obtained a test accuracy of 61.7%
on FER2013 compared to 75.2% in the state-of-the-art classification.
Scientific Reports | (2022) 12:6991 | https://doi.org/10.1038/s41598-022-11173-0 5
Vol.:(0123456789)
www.nature.com/scientificreports/
Figure 5. The basic LBP operator which labels the pixels in the image.
Proposed architecture and methods
Convolutional Neural Networks are a form of deep neural network that is used for computer vision and visual
image processing. However, conventional algorithms face certain serious issues or questions, such as luminous
variance and location variance, etc. The approach to addressing the problems of conventional methods is to
apply the CNN algorithm to the classification of emotions. In contrast, our model is sequentially structured. We
recognize that Sequence Modeling has the ability to model, analyze, make predictions or produce some form of
sequential data. In comparison to the traditional form, the algorithm’s major distinctions are:
1. Feature extraction with LBP
With the use of Local Binary Pattern (LBP), image feature map can be extracted, as the feature extractors
are generated during the training and testing process.
2. Differences of mathematical model
Typically, the linear classifier is classified by linear transformation. This is commonly referred to as the
traditional form. In contrast, to discern variations in the classification process, CNN and other deep learn-
ing algorithms usually incorporate linear conversion with nonlinear features such as sigmoid and rectified
linear unit functions (ReLU). We also take the advantages of strides and padding parameters in our model
architecture.
3. The deeper structure
The traditional approach usually conducts only one layer of an operation via the linear classifier: SVM has
just one weight set, for instance (shown in Eq. 2). However, in the course of classification, CNN and other deep
learning algorithms perform several layers of operation. As a two-dimensional array, CNN adopts input.
S = W × xi + b (2)
where the classification score is S, W is the matrix of weights, and b is bias.
Local binary pattern
Local Binary Pattern (LBP) is a term used to describe the texture properties of pictures on a local level. The major
benefit of the Local binary pattern is its rotation and gray invariance. LBP is a basic technique for detecting
characteristics in an image that is resistant to lighting fluctuations. It is a commonly utilized approach for feature
extraction in various object identification and facial expression detection algorithms because to its simplicity
and durability.
The Local Binary Pattern is an effective texture classifier. The binary operator labels the pixels in the image
by comparing the center pixel value with the 3 × 3 neighborhood of each pixel value to create an 8-bit binary
number, which is then transformed to a decimal value. The binary-valued picture patch that results is used to
create a local image descriptor37. The following equation is used to calculate LBP code for a given pixel at (Xc, Yc):
7
1, x ≥ 0
LBPP, R(Xc, Yc) = 2 n S(in − ic), S(x) = (3)
0, x < 0
n=0
where, ic = gray value of center pixel, in = gray value of neighboring pixel of i c, P = 8 maximum of 8 neighbors of
center pixel.
R = 1 for selected box of 3 × 3.
As a result, a pixel may have a total of 28 = 256 distinct values assigned to it. For the center pixel’s 8 neighbors,
and are the gray values at and, respectively, and is 1 if and 0 otherwise. An original LBP operator that is shown
in Fig. 5:
The LBP code is obtained by tracing the bins in a clockwise circle. These feature vectors serve as the classifica-
tion process’s input. Even if the lighting circumstances change, the relative pixel difference between the central
pixel and the adjacent pixels remains constant in LBP, which is the major advantage of efficient LBP. This feature
of the LBP makes it ideal for real-time applications. In Fig. 6, the notation (P, R) represents a neighborhood of
P evenly spaced sampling points on a circle of radius R that constitute a circularly symmetric neighbor set. The
second specified uniform patterns: an LBP is considered ‘uniform’ if it has no more than one 0–1 and one 1–0
transition when examined as a circular bit string. For example, the numbers 00000000, 001110000, and 11100001
are all uniform patterns.
Scientific Reports | (2022) 12:6991 | https://doi.org/10.1038/s41598-022-11173-0 6
Vol:.(1234567890)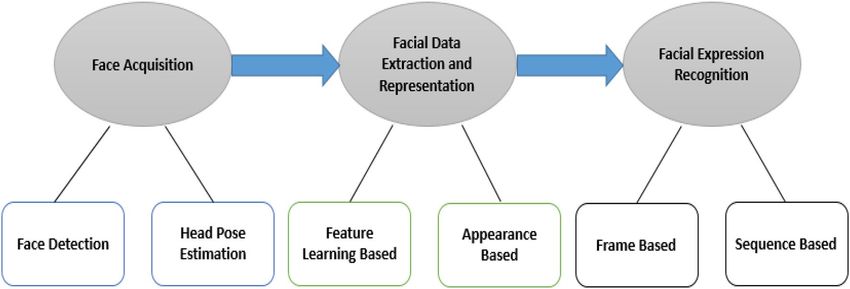
www.nature.com/scientificreports/
Figure 6. Three examples of the extended LBP which makes it ideal for real-time applications.
After using the LBP operator to label an image, a histogram of the labeled image fl (x, y) may be defined as
follows:
Hi = x, yI fl x, y = i , i = 0, 1, . . . , n − 1 (4)
where n is the number of distinct labels generated by the LBP operator, and:
1, Aistrue
I(A) =
0, Aisfalse (5)
Region‑based ORB. Traditional ORB extracts a large number of feature points to improve accuracy, but the
excessively dense feature points are difficult for feature description. To tackle this challenge, we used region divi-
sion in the classic ORB in a unique way. The number of feature points to be extracted for each region is calculated
using the total number of feature points to be extracted and the number of regions to be divided in this updated
ORB algorithm. The following are the measures to take:
• Divide the pictures evenly into X × Y areas of equal size. The division’s row and column are denoted by X
and Y, respectively. The feature points are scattered at random in the separated regions, which are labeled
{h1, h2,…, h X×Y}.
• Set a threshold T.
n
T= (6)
XY
where, the number of feature points is n
• In each region, feature points are recognized; if the number of features is greater than T, T is chosen as the
feature number. If the number of features is less than T, lower the threshold and repeat the process.
• When the number of feature points is more than n, the best feature points are chosen using the nonmaximal
suppression approach.
• The number of feature points must meet the conditions before all regions are covered.
CNN model overview. The proposed model consists of four layers of convolution together with two layers
that are fully connected which we can see in the Fig. 7. The vectors that we acquire feature vectors after convolu-
tion from each filter. The LBP feature map will be fused with this feature vector to create a combined convoluted
feature map. In addition, the convolution layer has weights that need to be taught, whereas the pooling layers use
a fixed function to convert the activation. The Rectified Linear Unit (ReLU) is used to provide non-linearity to
the entire network while having no effect on the convolutional layer’s receptive fields. The efficiency of the con-
volution layer goes through loops. Furthermore, model output is calculated on a training dataset with the loss
feature and learning parameters (kernels and weights) are adjusted by back-propagation with the loss. This work
requires to incorporate or delete certain layers during training cycles, such as Max Pooling or Convolution layer,
to build something unique and useful under specific kernels and weights for the output of a model. The output
is pooled, which is basically a non-linear down-sampling process in the spatial dimensions.
Pooling lowers, the representation’s spatial size, which helps to reduce parameters and calculations, and there-
fore control over-fitting. Finally, two completely connected layers are utilized to remap the pooled feature map
from a two-dimensional structure to a one-dimensional vector, or feature vector. The result is a pooled feature
map that has been "flattened." For classification, this feature vector serves as a standard Fully connected layer.
Scientific Reports | (2022) 12:6991 | https://doi.org/10.1038/s41598-022-11173-0 7
Vol.:(0123456789)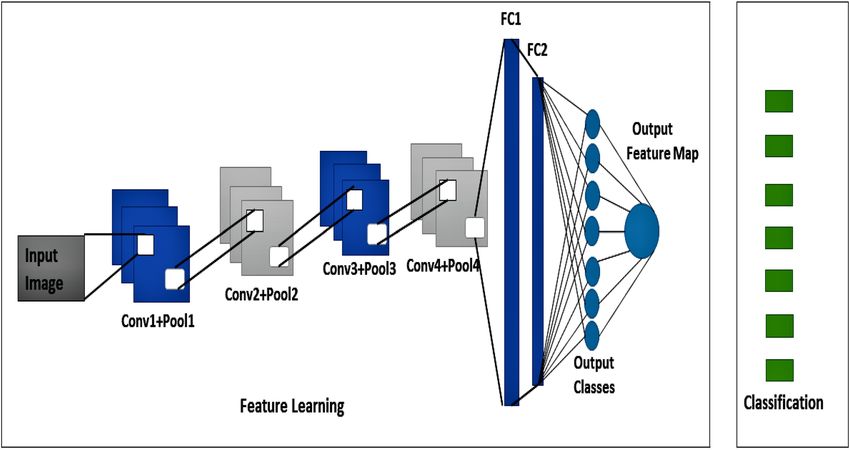
www.nature.com/scientificreports/
Figure 7. The graphical representation of the proposed CNN model for facial expression recognition.
Fine tuning for proposed CNN. Not only does a fine-tuning methodology replace the pre-trained model’s fully
connected layers with a new set of fully connected layers to train up on a given dataset, but it also fine-tunes all or
part of the kernels in the pre-trained convolutional layer base by way of backpropagation. The hyper-parameters
that control the output size of the convolutional layer are padding, stride, batch size, filter, sliding window and
learning rate parameter. Padding is required to add zeros to the border of the input. The allocation of width and
height parameters is controlled by stride. Small stride sizes lead to quite heavily over-lapping receptive fields and
large output. The receptive fields overlap less with larger strides, resulting in output with smaller dimensions. It
is possible to fine-tune all the layers in the convolutional base or set some earlier layers while fine-tuning much
of the deeper layers. In this work, the proposed model consists of four layers of convolution together with two
layers that are completely connected. This task would only need to train the high-level detailed feature block the
essence and the completely connected layers that regard as a classifier. In contrast, since we have just 7 emotions,
the authors reset the Softmax ranking to 7 grades from 1000 ranks.
Pipeline for proposed CNN. The network with a layer for processing the input. Here are four convolution and
additional pooling layers and two fully connected layers that is completely associated at the end. A ReLU layer,
batch normalization, and a dropout layer is used for any convolution and a fully connected layer of all the four
network structures. The additional dense layer is used at the end of the four convolution layers which are associ-
ated with the two fully connected layers. Besides, the overall pipeline for the proposed CNN model is architec-
tured on the following Fig. 8.
Proposed methodology
Datasets. For our purposes, we can use the Extended Cohn-Kanade (CK +), JAFFE, and FER2013 Dataset.
The FER2013 dataset, on the other hand, has a resolution of just 48 × 48. As a result, it may be used to compare
the performance of both methods in low-light situations. It also includes a dedicated public and private dataset
for validation and testing. JAFFE and FER2013 datasets have Grayscale image. On the other hand, both RGB and
Grayscale images are available in CK+. For the sake of simplicity, all of them must be in grayscale.
FER2013 database. The data collection used for the application was the FER2013 dataset from the Kaggle
challenge on FER201338. The database is used to incorporate the Facial Expression detection framework. The
dataset consists of 35,887 pictures, split into 3589 experiments and 28,709 images of trains. The dataset includes
another 3589 private test images for the final test. Figure 9 shows the expression distribution of the FER2013
dataset.
We have created some real-time own test images for recognizing emotions. Figure 10 shows the examples of
seven basic emotions from the own test image dataset39.
Japanese female facial expressions (JAFFE) database. JAFFE’s database has 213 pictures, each with
3 or 4 sample instances of 7 facial emotions (six fundamental facial emotions and one neutral emotion) from
10 distinct Japanese female participants with a resolution of 256 × 25640, which are gray. In our experiment, we
utilized a total of 213 pictures to assess the suggested algorithm (anger: 30 images; disgust: 29 images; fear: 32
images; happiness: 31 images; neutral: 30 images; sad: 31 images; and surprise: 30 images).
Scientific Reports | (2022) 12:6991 | https://doi.org/10.1038/s41598-022-11173-0 8
Vol:.(1234567890)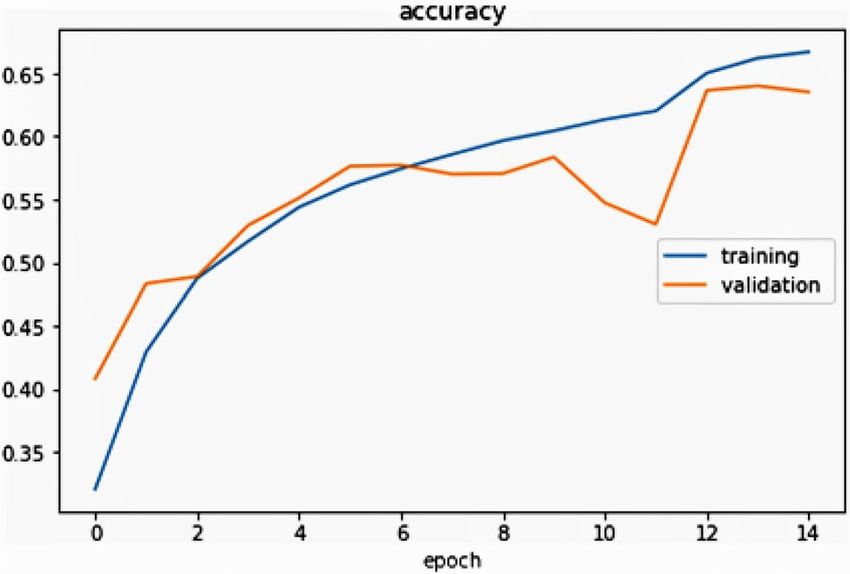
www.nature.com/scientificreports/
Figure 8. The structural pipeline of the proposed CNN model for facial expression recognition.
Figure 9. Seven facial expressions distribution of the FER2013 dataset.
The extended Cohn–Kanade (CK+) database. The CK+ database comprises 593 sequences from 123
people aged 18 to 30. Anger (45), neutral (18), disgust (59), fear (25), happiness (69), sadness (28), and surprise
(83) are used to classify 327 sequences41. We selected 309 sequences from our trials that were classified as one of
the six fundamental facial expressions, eliminating contempt.
The five major points of the proposed methodology are discussed here:
Scientific Reports | (2022) 12:6991 | https://doi.org/10.1038/s41598-022-11173-0 9
Vol.:(0123456789)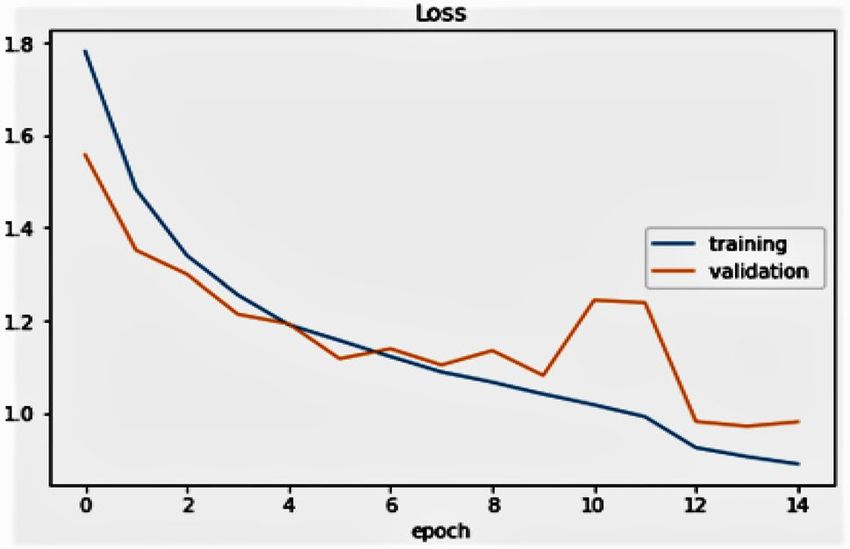
www.nature.com/scientificreports/
Figure 10. The examples of seven basic emotions for the validation purpose. . (Figure adapted from our own
test images39)
Figure 11. System flowchart of the proposed method (fusion feature extraction and fusion approaches with the
proposed ConvNet Model) for emotion classification.
Recognition of facial expression. The FER mechanism has three steps. Firstly, the step of prepossess-
ing is to prepare the dataset into a shape. The new form will run and produce effective results on a generalized
algorithm. Secondly, the face is identified from the images collected in real-time in the feature extraction step.
Finally, to group the picture into one of seven classes, the emotion classification stage consists of applying the
CNN algorithm. Moreover, these main phases are represented using a flowchart. The system flowchart of emo-
tion classification for the FER approach is seen in Fig. 11.
Preprocessing. Preprocessing is a required step in computer vision for image processing. The picture entered
in the dataset may include noise and some light, scale and color variations. Apart from this, any preprocessing
operations in the Ref.42 picture have been performed in order to produce more reliable and quicker performance
with the CNN approach. In the transformation of the image, the following preprocessing techniques are used:
• Normalization An image is normalized to eliminate differences and to produce an improved image of the
face.
• Gray scaling Gray scaling is an image transformation method whose pixel value depends upon the strength
of the image’s light. As colored images are hard to process by an algorithm, gray scaling is completed. Based
on our knowledge with classifying facial expressions regardless of skin color, facial expression recognition
using CNN must also be conducted independently of the color information of the input image. The input
picture is merely converted to a 1-channel gray image in this article.
• Redimensioning The image is redimensioned to delete the unnecessary portion of the image. Undoubtedly,
this decreases the required memory and increases the speed of c alculation43.
Face detection. Face identification is the foundational step for every Facial Expression Recognition System.
It is an efficient solution to object detection proposed in their article, “Rapid Object Detection using a Boosted
Cascade of Simple Features”44 in 2001, by Paul Viola and Michael Jones. Classifiers that detect an object in a
picture or video where many positive as well as negative images learn a cascade function. In addition, Haar cas-
cades in images have proven to be a powerful means of object detection and provide high precision. Three dark
regions on the forehead, such as the eyebrows, are detected by Haar features. Haar cascades delete the unwanted
background data from the picture effectively and detect the face area from the picture. OpenCV introduced the
face detection mechanism with Haar cascade classifiers. Facial Component detection of a happy image is seen in
Fig. 12. This approach used rectangular characteristics45.
Feature extraction. Because of its simplicity and durability, we utilize Local Binary Pattern as a feature
extraction approach, which is extensively used for feature extraction in various object identification algorithms
as well as facial expression recognition with efficient classification result. We see that “uniform” patterns make
up the great majority of patterns for each image in our collection. The following steps are now used to implement
feature extraction:
Scientific Reports | (2022) 12:6991 | https://doi.org/10.1038/s41598-022-11173-0 10
Vol:.(1234567890)www.nature.com/scientificreports/
Figure 12. Different facial component selection of a happy image in a face detection process.
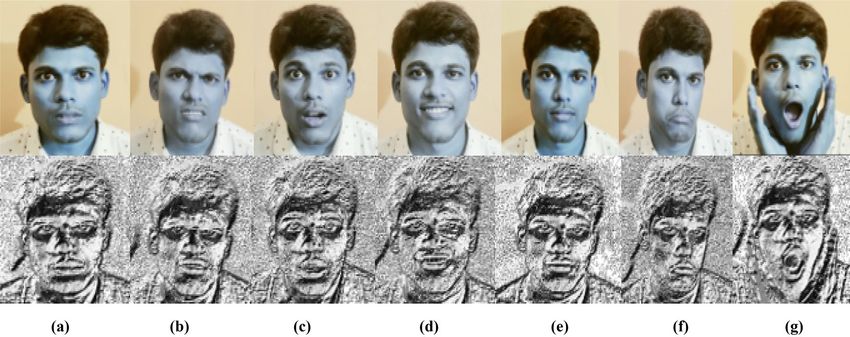
Figure 13. (a) The detected face from original image. (b) LBP of image. (c) Feature histogram of LBP image. .
(Figure adapted from our own test i mages39).
Figure 14. Original LBP features of facial expressions. (a) Happy (b) Angry (c) Fear (d) Sad (e) Disgust (f)
Surprise (g) Neutral. . (Figure adapted from our own test images39).
(1) Split the image of the face into small segments.
(2) For each region, calculate the LBP histogram. Each region’s LBP histogram is obtained by scanning it with
the LBP operator.
(3) Combine the LBP feature histograms of each region into a single feature vector.
The LBP histogram is a good indicator of changes in appearance as it combines information about shape,
position and texture. The feature vector must be decreased for the classification to be faster based on linear pro-
gramming approaches. Figures 13 and 14 indicates the LBP characteristics and how LBP operator can convert
an original image to LBP image, and discovers an LBP image characteristic histogram.
Scheme for feature fusion. Prior to feature fusion, feature normalization is used to improve the recogni-
tion rate. The LBP features are standardized to a range of 0–1 in this article, and the LBP and ORB features are
normalized using the following formula:
Scientific Reports | (2022) 12:6991 | https://doi.org/10.1038/s41598-022-11173-0 11
Vol.:(0123456789)www.nature.com/scientificreports/
Algorithm Accuracy (%) Computational complexity
Alexnet46 55–88 O4̂
VGG47 65–68 O9̂
48
GoogleNet 82–88 O5̂
Resnet 72–74 O1̂6
FER (our proposed) 75–96 O4̂
Table 1. Accuracy Comparison with related network.
l
L= , (7)
max(l)
where, l denotes a feature’s value. Since one type of feature cannot describe all visual characteristics, feature
fusion is commonly used. The LBP and ORB descriptors are fused in this article using the Z-score approach.
J
2
σ = fi − µ ,
j
J
j fj
µ= , (8)
J
(x j−µ )
fj = K ,
σ +C
fj is the fusion feature data. In the following trials, K is a factor multiplied
where, fj is an LBP or ORB feature, and
by
fj , and K is 100.
Emotion classification. Here, the device classifies the picture into one of the seven universal expressions as
entitled in the dataset—Happy, Sad, Anger, Surprise, Disgust, Fear, and Neutral. The training was carried out
using CNN, which is a collection of neural networks. On the training range, the dataset was trained first. Before
feeding it into CNN, the process of feature extraction was not performed on the results. The method followed
was to experiment on the CNN with various architectures, to obtain better accuracy with the validation set. The
step of classification of emotion consists of the following stages:
• Data splitting:
• The dataset was separated into three categories: training, public testing, and private testing. A training and
public test set was used for the generation of a model and a private test set was used for the validation of the
model.
• Model training and generation:
• The design of the neural network was addressed in-depth in the layout of CNN section earlier. Here we can
see that the proposed model was set to the network and that after training on datasets, the model updates
will be generated and applied to the previous structure with the. json file.
• Evaluation of model:
• The updates of the model produced during the training process were evaluated on the validation set consist-
ing of 3589 images.
• Using the CNN model to classify test dataset as well as real-time images:
• The transfer learning theory can be used to recognize the emotion in images here in real-time. The model
developed during the training phase consists of the corresponding weights and values that can be used to
detect new facial expressions. Since the created model already contains weights, it can certainly be said that
FER is faster for real-time pictures.
Experiments and results analysis
Accuracy and complexity. Since the proposed model has been trained on a composite dataset, training
accuracy above 95% and validation accuracy above 91% has been reached, which would be 95% after perform-
ing several epochs. It can be mentioned earlier that just after 30 epochs, the CNN model has a training accuracy
of 95%, whereas CNN has taken further epochs to reach greater accuracy. A slight comparison of the sug-
gested approach with other related works is seen in the Table 1. From the table, it can be ensured that the CNN
approach is much better than adjusting any other technique or approach to the recognition of human emotions,
and our proposed model demonstrates better work.
The performance of the system established for facial emotion recognition from images was measured using
three metrics: accuracy, specificity, and sensitivity. The number of correctly classified data is divided by the
Scientific Reports | (2022) 12:6991 | https://doi.org/10.1038/s41598-022-11173-0 12
Vol:.(1234567890)www.nature.com/scientificreports/
Angry (%) Disgust (%) Fear (%) Happy (%) Sad (%) Surprise (%) Neutral (%)
Angry 91.1 0.2 0.2 0 4.2 3.8 2.5
Disgust 5.3 89.7 3.0 2.6 1.0 0 2.4
Fear 0.24 2 88.6 3.4 5.9 1.16 0.7
Happy 1.5 0 2.1 95.9 0 0 0.5
Sad 1.0 5.3 4.2 0 88.9 0 0.6
Surprise 0.24 3.0 0.63 0 0.53 94.6 1.0
Neutral 2.12 3.8 3.27 0.3 0.79 0.44 92.3
Table 2. Confusion matrix of 7 class facial emotion recognition results obtained by ConvNet with LBP on the
FER2013 validation test dataset. Significant values are in bold.
total number of the data to calculate accuracy. True-positive (TP), true-negative (TN), false-positive (FP), and
false-negative (FN) performance characteristics were used to compute the metrics as specified by Eqs. (9–11).
TN + TN
Accuracy = , (9)
TP + FP + FN + TN
TP
Sensitivity = , (10)
TP + FN
TN
Specificity = . (11)
TN + FP
The classification accuracy is used to evaluate the system’s overall effectiveness, which we focused on after-
ward employing generalization techniques and compared to state-of-the-art methodologies or measurement.
The authors also compared the computational complexity of the related network. The method of calculating
the computational complexity of our proposed method in Table 1 is as:
We see that for each layer a matrix multiplication and an activation function are computed. We know that
naive matrix multiplication has an asymptotic run-time of O(n3) and if g(x) is an activation function which is
an element-wise function, we also know that it has a run-time of O(n). When analyzing matrix algorithms, it’s
common to assume that the matrices are quadratic; that is, they have the same number of rows as columns. By
doing this, we find that:
n(mul) = nlayers × n3 . (12)
If we once again assume that there are the same number of neurons in each layer, and that the number of
layers equal the number of neurons in each layer we find:
n(mul) = O n × n3 = O (n4 ). (13)
The same can be done for the activations:
n g = nlayers × n = O n2 . (14)
So, for the proposed model, the total run-time becomes:
O n4 + n2 ⇔ O n4 ∵ ∀n ≥ 1|n4 + n2 ≤ 2n4 . (15)
In the other network, there are a number of layers present in the architecture. The number of minimum con-
volution layers are 8, 16, 22, 50 for AlexNet, VGG, GoogleNet, and ResNet respectively. So, in their perspective,
the time complexity was calculated with the above approach.
The confusion matrix based on the FER2013 validation test dataset shown on below in Table 2. It can be seen
that the accuracy for most expressions is well mannered. As the epoch increases in a consistent manner during
each training cycle, the model will be well-suited and perform well during the real-time testing period. The bold
numbers of each class indicate that the research data has been well categorized. In addition, the numbers on
each side of the diagonal show the number of pictures that have been inappropriately listed. As these numbers
are smaller than the numbers on the diagonal, it can be inferred that the algorithm performed properly and
obtained state-of-the-art o utcomes43.
Loss and accuracy over time. It can be ensured that the loss reduces, and that the accuracy increases with
each epoch. Training and test accuracy for training and validation losses collected using CNN for the FER2013
dataset are given in the Table 3. From the table, it can be ensured that as the epoch increases it shows a better
accuracy rate for both the training and validation.
Scientific Reports | (2022) 12:6991 | https://doi.org/10.1038/s41598-022-11173-0 13
Vol.:(0123456789)www.nature.com/scientificreports/
Epoch Training accuracy Validation accuracy
1 34.14 44.04
2 47.87 50.40
3 53.05 53.91
4 56.14 56.76
5 58.87 58.32
6 60.35 56.98
7 62.28 59.32
8 63.88 61.44
… …
15 77.32 76.14
… …
30 96.48 91.05
Table 3. Accuracy per epoch
Figure 15. Graphical view of training and validation accuracy per epoch.
Accuracy and loss graph. The authors recognize that the accuracy of training and validation are assessed
to determine a model fitting. If there is a large difference between the two, the model is over-fitting. The accuracy
of the validation should be equal to or marginally less than the accuracy of the preparation to be a better model.
This work is also seen in Fig. 15, as the epoch improves the training accuracy is marginally higher than validation
accuracy as the authors extended the layers and eventually introduced a few more convolution layers and several
entirely related layers, rendering the network both larger and broader. It seems like the lack of preparation can
still be smaller than the loss of validation.
In Fig. 16, the authors show the corresponding training versus validation failure. This means that the train-
ing loss reduces as the epoch grows, and the validation loss increases. In addition, the validation data are always
expected to decrease as the weights are adapted. Here, as the epoch grows in higher-order then we can expect
a lower rate of validation loss than the training loss which we have already seen in the last stages of the figure.
Therefore, this model is well suited to the training results.
System validation. The generalization approach was used to further validate the system’s performance. The
word "generalization" refers to a model’s capacity to respond to new data. This method can digest new data and
generate accurate predictions after being trained. For generalization, this study employed the JAFFE and CK+
image datasets. The confusion metrics for the generalization findings are shown in Tables 4, and 5, respectively.
Tables 4 and 5 shows that, with the exception of sadness, 7-class facial expressions are very accurately rec-
ognized, with an accuracy of above 92%. Here, we find that the efficiency of recognition is 92.05% for JAFFE
dataset and 98.13% for CK+ dataset. A comparison of our results with those of related state of art methods are
shown in Table 6.
Conclusion and future work
Fusion features were employed in the proposed study, and the input data were fused using LBP, ORB and CNN
features. Based on the CK+ dataset, the proposed technique was found to have a better accuracy (98.13%) than
other recent methods. In comparison to the current techniques, the other datasets equally obtained the best
accuracy. The FER2013 also outperforms the previous studies in terms of classification accuracy. This method
Scientific Reports | (2022) 12:6991 | https://doi.org/10.1038/s41598-022-11173-0 14
Vol:.(1234567890)www.nature.com/scientificreports/
Figure 16. Graphical view of training and validation loss per epoch.
Angry (%) Disgust (%) Fear (%) Happy (%) Sad (%) Surprise (%) Neutral (%)
Angry 92.10 2.32 0 0 2.58 0 3.0
Disgust 5.42 88.48 3.42 0 2.68 0 0
Fear 0 1.13 89.19 0 5.48 4.25 0
Happy 0 0 0 95.54 2.12 0 2.34
Sad 1.45 2.29 1.68 1.21 91.88 0 0.49
Surprise 0 0 1.66 2.13 1.54 94.67 0
Neutral 1.12 3.8 1.27 0.3 0.79 0.44 92.32
Table 4. Confusion matrix of 7 class facial emotion recognition results obtained by ConvNet with LBP on the
JAFFE dataset. Significant values are in bold.
Angry (%) Disgust (%) Fear (%) Happy (%) Sad (%) Surprise (%) Neutral (%)
Angry 98.61 0 1.33 0 0.96 0 0
Disgust 0 96.46 0.27 0 1.97 2.30 0
Fear 0 0 99.60 0 0 0.40 0
Happy 0.31 1.95 0.32 97.51 0.30 0 1.61
Sad 1.11 1.29 0 1.10 96.40 0 1.03
Surprise 0.25 0 0 0.23 1.89 97.28 0.35
Neutral 1.12 1.80 1.27 1.97 2.17 0.42 98.25
Table 5. Confusion matrix of 7 class facial emotion recognition results obtained by ConvNet with LBP on the
CK+ dataset. Significant values are in bold.
will be the same for trials using the MMI database as all of the facial expression pictures in the three datasets
were taken from video sequences. As a result, the classification accuracy will be comparable. The identification
rate will be better if we apply five or ten-fold cross validation techniques.
The authors have found seven distinct and unique emotion classes (fear, happy, angry, disgust, surprise, sad
and neutral) in this article for emotion classification. There is no overlap between groups as our model perfectly
fits the data. The presented research has achieved a very good average classification accuracy of emotions over
92% and also achieved 96% for random division of data in a minimal number of epochs. Based on the results
from existing research studies, our model has been reflecting better in the real-time. The authors, however, plan
to work with complex type or mixed group of emotions, such as shocked with pleasure, surprised by frustration,
dissatisfied by anger, surprised by sorrow, and so on.
In this analysis, the authors conclude that due to certain variables, their proposed model is only on average.
For the future, we will continue to focus on enhancing the consistency of each CNN model and layer and also
try to examine new feature or method to be fused with CNN. The future study involves examining multiple
forms of human variables such as personality characteristics, age, and gender that affect the efficiency of emotion
detection. Because of the increasing availability of large medical data, machine learning techniques are being
used to reveal hidden healthcare trends61–67. Deep neural networks, in particular, have recently been employed
Scientific Reports | (2022) 12:6991 | https://doi.org/10.1038/s41598-022-11173-0 15
Vol.:(0123456789)www.nature.com/scientificreports/
References Methods Dataset Accuracy
Zhou et al.49 CNN + MVFE-LightNet FER2013 68.4%
Ziyang Yu et al.50 CNN + music algorithm FER2013 62.1%
P. Ferandez et al.51 FERAtt CK+ 82.11%
N. Christou and N. Kanojiya23 CNN FER2013 91%
EEG data on SEED 90.59%
F. Wang et al.29 EFDMs + EEG + CNN
DEAP 82.84%
F. Nonis et al.31 3d approaches BU-3DFE 60% to 90%
JAFFE 88.5%
Ben Niu et al.52 SVM + LBP + ORB CK+ 93.2%
MMI 79.8%
CK+ 96.46%
Ji-Hae Kim et al.53 LBP + deep neural network
JAFFE 91.27%
aik54
Sawardekar and N LBP + CNN CK+ 90%
Fei Wang et al.28 EEE based EFDMs Cross datasets 82.84%
Hongli Zhang et al.9 CNN + image edge computing FER2013 + LFW 88.56%
JAFFE 76.74%
Ke Shan et al.55 KNN + CNN
CK+ 80.30%
Pham and Quang56 CNN + FPGA FER2013 66%
Guohang Zeng et al.57 Deep learning + handcrafted feature CK+ 97.35%
eng58
Shan Li and D Deep learning All facial dataset 45% to 95%
59
FER2013 68.60%
Zuheng Ming et al. FaceLiveNet
CK + 98%
alushi35
Hussain and B Deep learning KDEF 88%
CREMA-D 78.52%
Smitha Rao et al.32 CNN + LSTM
RAVDEES 63.35%
JAFFE 92.4%
Khalid Bhatti et al.60 Deep features + extreme learning CK 91.4%
FER2013 62.7%
FER2013 91.01%
Proposed method Fusion features (CNN + LBP + ORB) + ConvNet JAFFE 92.05%
CK + 98.13%
Table 6. Comparison among existing methods in the Facial Emotion Recognition.
in healthcare a pplications68. Therefore, the proposed model has a great potential to be applicable on healthcare
imaging data analysis.
Furthermore, the authors also focus on the mental or emotional stuff of a man or woman which helps as a
consultant and leads the situation depending on behavioral things. Apart from this, we will attempt to refine
the model more accurately such that a more natural method of recognition of facial expression can be provided.
Data availability
Extended Cohn–Kanade (CK+) and FER2013 datasets are publicly available datasets. Japanese Female Facial
Expression (JAFFE) is not publicly available; however, we have been granted access to JAFFE dataset from pub-
lisher/author for training and testing purpose of our model.
Received: 10 May 2021; Accepted: 6 April 2022
References
1. Ekman, R. What the Face Reveals: Basic and Applied Studies of Spontaneous Expression Using the Facial Action Coding System (FACS)
(Oxford University Press, 1997).
2. Nwosu, L.,Wang, H., Lu, J., Unwala, I., Yang, X., Zhang, T. Deep convolutional neural network for facial expression recognition
using facial parts. In 2017 IEEE 15th Intl Conf on Dependable, Autonomic and Secure Computing, 15th Intl Conf on Pervasive Intel-
ligence and Computing, 3rd Intl Conf on Big Data Intelligence and Computing and Cyber Science and Technology Congress (DASC/
PiCom/DataCom/Cyber SciTech) 1318–1321 (IEEE, 2017).
3. Yang, B., Xiang, X., Xu, D., Wang, X. & Yang, X. 3d palm print recognition using shape index representation and fragile bits.
Multimed. Tools Appl. 76(14), 15357–15375 (2017).
4. Kumar, N. & Bhargava, D. A scheme of features fusion for facial expression analysis: A facial action recognition. J. Stat. Manag.
Syst. 20(4), 693–701 (2017).
5. Tzimiropoulos, G. & Pantic, M. Fast algorithms for fitting active appearance models to unconstrained images. Int. J. Comput. Vis.
122(1), 17–33 (2017).
Scientific Reports | (2022) 12:6991 | https://doi.org/10.1038/s41598-022-11173-0 16
Vol:.(1234567890)www.nature.com/scientificreports/
6. Zhao, G. & Pietikainen, M. Dynamic texture recognition using local binary patterns with an application to facial expressions. IEEE
Trans. Pattern Anal. Mach. Intell. 29(6), 915–928 (2007).
7. Ahmadinia, M. et al. Energy-efficient and multi-stage clustering algorithm in wireless sensor networks using cellular learning
automata. IETE J. Res. 59(6), 774–782 (2013).
8. Zhao, X., Liang, X., Liu, L., Li, T., Han, Y., Vasconcelos, N., Yan, S. Peak-piloted deep network for facial expression recognition. In
European Conference on Computer Vision 425–442 (Springer, 2016).
9. Zhang, H., Jolfaei, A. & Alazab, M. A face emotion recognition method using convolutional neural network and image edge
computing. IEEE Access 7, 159081–159089 (2019).
10. Goodfellow, I. J., Erhan, D., Carrier, P. L., Courville, A., Mirza, M., Hamner, B., Cukierski, W., Tang, Y., Thaler, D., Lee, D.-H. et
al. Challenges in representation learning: A report on three machine learning contests. In International Conference on Neural
Information Processing 117–124 (Springer, 2013).
11. Yu, Z. & Zhang, C. Image based static facial expression recognition with multiple deep network learning. In Proceedings of the
2015 ACM on International Conference on Multimodal Interaction 435–442 (2015).
12. Niu, H. et al. Deep feature learnt by conventional deep neural network. Comput. Electr. Eng. 84, 106656 (2020).
13. Pantic, M., Valstar, M., Rademaker, R., & Maat, L. Web-based database for facial expression analysis. In 2005 IEEE International
Conference on Multimedia and Expo 5 (IEEE, 2005).
14. Wang, X., Feng, X., & Peng, J. A novel facial expression database construction method based on web images. In Proceedings of the
Third International Conference on Internet Multimedia Computing and Service 124–127 (2011).
15. Mayer, C., Eggers, M. & Radig, B. Cross-database evaluation for facial expression recognition. Pattern Recognit. Image Anal. 24(1),
124–132 (2014).
16. Tang, Y. Deep learning using linear support vector machines. arXiv preprint arXiv:1306.0239 (2013).
17. Gan, Y. Facial expression recognition using convolutional neural network. In Proceedings of the 2nd International Conference on
Vision, Image and Signal Processing 1–5 (2018).
18. Li, C.-E. J. & Zhao, L. Emotion recognition using convolutional neural networks. In Purdue Undergraduate Research Conference
63 (2019).
19. Lv, Y., Feng, Z., & Xu, C. Facial expression recognition via deep learning. In 2014 International Conference on Smart Computing
303–308 (IEEE, 2014).
20. Mollahosseini, A., Chan, D., & Mahoor, M. H. Going deeper in facial expression recognition using deep neural networks. In 2016
IEEE Winter Conference on Applications of Computer Vision (WACV) 1–10 (IEEE, 2016).
21. Hahnloser, R. H., Sarpeshkar, R., Mahowald, M. A., Douglas, R. J. & Seung, H. S. Digital selection and analogue amplification
coexist in a cortex-inspired silicon circuit. Nature 405(6789), 947–951 (2000).
22. Patil, M. N., Iyer, B., & Arya, R. Performance evaluation of PCA and ICA algorithm for facial expression recognition application.
In Proceedings of Fifth International Conference on Soft Computing for Problem Solving 965–976 (Springer, 2016).
23. Christou, N. & Kanojiya, N. Human facial expression recognition with convolution neural networks. In Third International Congress
on Information and Communication Technology 539–545 (Springer, 2019).
24. Niu, B., Gao, Z. & Guo, B. Facial expression recognition with LBP and ORB features. Comput. Intell. Neurosci. 2021, 1–10 (2021).
25. González-Lozoya, S. M. et al. Recognition of facial expressions based on cnn features. Multimed. Tools Appl. 79, 1–21 (2020).
26. Christy, A., Vaithyasubramanian, S., Jesudoss, A. & Praveena, M. A. Multimodal speech emotion recognition and classification
using convolutional neural network techniques. Int. J. Speech Technol. 23, 381–388 (2020).
27. Niu, H. et al. Deep feature learnt by conventional deep neural network. Comput. Electr. Eng. 84, 106656 (2020).
28. Wang, F. et al. Emotion recognition with convolutional neural network and EEG-based EFDMs. Neuropsychologia 1(146), 107506
(2020).
29. Wang, F. et al. Emotion recognition with convolutional neural network and eeg-based efdms. Neuropsychologia 146, 107506 (2020).
30. Canedo, D. & Neves, A. J. Facial expression recognition using computer vision: A systematic review. Appl. Sci. 9(21), 4678 (2019).
31. Nonis, F., Dagnes, N., Marcolin, F. & Vezzetti, E. 3d approaches and challenges in facial expression recognition algorithms—A
literature review. Appl. Sci. 9(18), 3904 (2019).
32. Hans, A. S. A. & Smitha, R. A CNN-LSTM based deep neural networks for facial emotion detection in videos. Int. J. Adv. Signal
Image Sci. 7(1), 11–20 (2021).
33. Bodapati, J. D. & Veeranjaneyulu, N. Facial emotion recognition using deep cnn based features (2019).
34. Haddad, J., Lézoray, O., & Hamel, P. 3d-cnn for facial emotion recognition in videos. In International Symposium on Visual Com-
puting 298–309 (Springer, 2020).
35. Hussain, S. A. & Ahlam, S. A. A. B. A real time face emotion classification and recognition using deep learning model. J. Phys.
Conf. Ser. 1432(1), 012087 (2020).
36. Singh, S. & Nasoz, F. Facial expression recognition with convolutional neural networks. In 2020 10th Annual Computing and
Communication Workshop and Conference (CCWC) 0324–0328 (IEEE, 2020).
37. Shan, C., Gong, S. & McOwan, P. W. Facial expression recognition based on local binary patterns: a comprehensive study. Image
Vis. Comput. 27(6), 803–816 (2009).
38. https://www.kaggle.com/msambare/fer2013. In FER-2013|Kaggle. Accessed 20 Feb 2021.
39. https://github.com/Tanoy004/Facial-Own-images-for-test. Accessed 20 Feb 2021.
40. Lyons, M., Akemastu, S., & Kamachi, M. Coding facial expressions with Gabor wavelets. In Proceedings of the ird IEEE International
Conference on Automatic Face and Gesture Recognition 200–205 (Nara, 1998).
41. Lucey, P., Cohn, J. F., Kanade, T., Saragih, J., Ambadar, Z., & Matthews, I. The extended cohn-kanade dataset (ck+): A complete
dataset for action unit and emotion-specified expression. In Proc. IEEE Comput. Soc. Conf. Comput. Vis. Pattern Recognit. Work-
shops (CVPRW), San Francisco, CA, USA 94–101 (2010).
42. Yang, B., Cao, J., Ni, R. & Zhang, Y. Facial expression recognition using weighted mixture deep neural network based on double-
channel facial images. IEEE Access 6, 4630–4640 (2017).
43. Talegaonkar, I., Joshi, K., Valunj, S., Kohok, R., & Kulkarni, A. Real time facial expression recognition using deep learning. Avail-
able at SSRN 3421486 (2019).
44. Viola, P. & Jones, M. Rapid object detection using a boosted cascade of simple features. In Proceedings of the 2001 IEEE Computer
Society Conference on Computer Vision and Pattern Recognition. CVPR 2001, 1 I–I (IEEE, 2001).
45. Mohan, A., Papageorgiou, C. & Poggio, T. Example-based object detection in images by components. IEEE Trans. Pattern Anal.
Mach. Intell. 23(4), 349–361 (2001).
46. Wu, Y.-L., Tsai, H.-Y., Huang, Y.-C., & Chen, B.-H. Accurate emotion recognition for driving risk prevention in driver monitoring
system. In 2018 IEEE 7th Global Conference on Consumer Electronics (GCCE) 796–797 (IEEE, 2018).
47. Kumar, A. & Garg, G. Sentiment analysis of multimodal twitter data. Multimed. Tools Appl. 78(17), 24103–24119 (2019).
48. Giannopoulos, P., Perikos, I., & Hatzilygeroudis, I. Deep learning approaches for facial emotion recognition: A case study on fer-
2013. In Advances in Hybridization of Intelligent Methods. 1–16 (Springer, 2018).
49. Yue, Z., Yanyan, F., Shangyou, Z. & Bing, P. Facial expression recognition based on convolutional neural network. In 2019 IEEE
10th International Conference on Software Engineering and Service Science (ICSESS) 410–413 (2019). https://d oi.o
rg/1 0.1 109/I CSES
S47205.2019.9040730.
Scientific Reports | (2022) 12:6991 | https://doi.org/10.1038/s41598-022-11173-0 17
Vol.:(0123456789)You can also read