Finding the Facts on Methane Emissions: A Guide to the Literature - Prepared for Prepared by ICF International 9300 Lee Highway Fairfax, VA 22031 ...
←
→
Page content transcription
If your browser does not render page correctly, please read the page content below
Finding the Facts on
Methane Emissions: A
Guide to the Literature

April 2016

Prepared for

The Natural Gas Council

Prepared by
ICF International
9300 Lee Highway
Fairfax, VA 22031
Sponsors’ Note

The purpose of this report is to show the range and results of methane studies in the public
literature. The results and findings in the studies referenced in this report vary significantly.
Scientific methods and uncertainty principles need to be employed rigorously in evaluating these
studies. Given the significant variation in results, we caution against the use of any single study
as the basis for policy choices that have potential implications for U.S. energy/environmental
policy and the U.S. economy.

Neither this report nor the studies discussed herein represent the positions of the sponsors, the
Natural Gas Council as a group, or as individual organizations.

Finding the Facts on Methane Emissions: A Guide to the Literature

Contents

1. Executive Summary .................................................................................................................... 1‐1
2. Introduction ............................................................................................................................... 2‐1
   2.1. Uses and Markets for Natural Gas ............................................................................................. 2‐3
   2.2. The Natural Gas Value Chain and Sources of Methane ............................................................. 2‐7
3. Introduction to Greenhouse Gases and Other Environmental Factors ......................................... 3‐1
   3.1. Combustion Emissions ............................................................................................................... 3‐1
   3.2. Non‐CO2 Greenhouse Gases and Global Warming Potential .................................................... 3‐1
   3.3. Emissions Measurement and Reporting.................................................................................... 3‐4
4. Federal Reporting of GHG Emissions ........................................................................................... 4‐1
   4.1. EPA Inventory of GHG Emissions ............................................................................................... 4‐1
   4.2. Greenhouse Gas Reporting Program (GHGRP) .......................................................................... 4‐5
5. Measurement and Analysis of Methane Emissions...................................................................... 5‐1
   5.1. On‐Site Direct Measurement Studies ........................................................................................ 5‐1
   5.2. Ambient Air Measurement Studies ........................................................................................... 5‐5
   5.3. Life‐Cycle Analysis (LCA) Studies ............................................................................................... 5‐7
   5.4. Meta‐Analysis .......................................................................................................................... 5‐11
6. Efforts to Reduce Methane Emissions ......................................................................................... 6‐1
   6.1. Federal Voluntary Programs ...................................................................................................... 6‐1
         6.1.1. The Natural Gas STAR (NGS) Program .......................................................................... 6‐1
         6.1.2. Natural Gas STAR International and the Global Methane Initiative (GMI) .................. 6‐1
         6.1.3. The Climate and Clean Air Coalition (CCAC) Oil and Gas Methane Partnership (OGMP)
                 ...................................................................................................................................... 6‐2
         6.1.4. Natural Gas STAR Methane Challenge Program (“Methane Challenge”) .................... 6‐2
   6.2. Industry Voluntary Programs..................................................................................................... 6‐3
         6.2.1. The Center for Sustainable Shale Development (CSSD) ............................................... 6‐3
         6.2.2. Our Nation’s Energy Future Coalition (ONE Future)..................................................... 6‐3
   6.3. Federal and State Regulations ................................................................................................... 6‐4
         6.3.1. NSPS, Subpart OOOO – Standards of Performance for Crude Oil and Natural Gas
                 Production, Transmission and Distribution (2012) ...................................................... 6‐4
         6.3.2. NESHAP, Subpart HH – National Emission Standards for Hazardous Air Pollutants from
                 Oil and Natural Gas Production Facilities (2012).......................................................... 6‐5
         6.3.3. NSPS Proposed Regulations OOOOa (2015) ................................................................. 6‐6
         6.3.4. NSPS for Existing Sources ............................................................................................. 6‐7
   6.4. State Regulation of Methane Emissions .................................................................................... 6‐7
7. Conclusions ................................................................................................................................ 7‐1
8. Appendix .................................................................................................................................... 8‐3

Figures

Figure 2‐1 ‐ Methane Emissions from the Natural Gas Industries Were 2.6% of Total
           GHG Emissions in 2014 (MMTCO2e) ........................................................................................ 2‐1

ICF International                                                           iii                                                               April 2016
Finding the Facts on Methane Emissions: A Guide to the Literature

Figure 2‐2 ‐ Methane Emissions per Unit of Natural Gas Produced Have Declined
           Continuously Since 1990 .......................................................................................................... 2‐2
Figure 2-3 - U.S. Energy Mix – 2014 and 2030 projection ....................................................................... 2‐3
Figure 2‐4 ‐ U.S. Energy Consumption by Sector – 2014 and 2030 projections ........................................ 2‐4
Figure 2‐5 ‐ U.S. Natural Gas Price Trends Have Declined in Recent Years ............................................... 2‐5
Figure 2‐6 – Electricity Generation with Natural Gas is Increasing ........................................................... 2‐6
Figure 2‐7 ‐ Natural Gas Industry Processes and Example Methane Emission Sources ............................ 2‐8
Figure 3‐1‐ Natural Gas has the Lowest Direct CO2 Emissions of All Fossil Fuels ...................................... 3‐1
Figure 4‐1 – Changes to 2016 EPA GHG Inventory for Natural Gas Systems for Emissions
           in 2013 ...................................................................................................................................... 4‐3
Figure 4‐2 ‐‐ Methane Emissions Have Been Declining While Production Increases ................................ 4‐4
Figure 4‐3 – Methane Emissions per Mcf of Production Have Declined Sharply ...................................... 4‐5
Figure 5‐1 – Multiple Studies Shows Life‐cycle Burner Tip Emissions from Gas Lower than
           Coal28 ...................................................................................................................................... 5‐10

Tables

Table 3‐1 – Greenhouse Gas GWPs and Lifetime ...................................................................................... 3‐3
Table 3‐2 ‐ Global Warming Potentials for Methane for Different Lifetimes (including
            feedbacks) ................................................................................................................................ 3‐4
Table 6‐1 – Overview of NSPS OOOO Provisions ....................................................................................... 6‐5
Table 6‐2 ‐ Summary of NESHAP HH Requirements .................................................................................. 6‐6

ICF International                                                            iv                                                                 April 2016
Finding the Facts on Methane Emissions: A Guide to the Literature

Acronyms and Abbreviations

               Acronym / Abbreviation                               Stands For
                        AF                Activity Factor
                        API               American Petroleum Institute
                       AR-4               IPCC Fourth Assessment Report
                       AR-5               IPCC Fifth Assessment Report
                        Bbl               Barrel
                        Bcf               Billion Cubic Feet
                       CCAC               Climate and Clean Air Coalition
                        CH4               Methane
                        CO2               Carbon Dioxide
                       CO2e               Carbon Dioxide Equivalent
                       CSSD               Center for Sustainable Shale Development
                        EF                Emission Factor
                        EIA               U.S. Energy Information Administration
                       EPA                U.S. Environmental Protection Agency
                       FAR                IPCC First Assessment Report
                       GCM                General Circulation Model
                       GHG                Greenhouse Gas
                      GHGRP               Greenhouse Gas Reporting Program
                        GRI               Gas Research Institute
                       GTP                Global Temperature Potential
                       GWP                Global Warming Potential
                       HAP                Hazardous Air Pollutant
                        Hp                Horsepower
                       IPCC               Intergovernmental Panel on Climate Change
                       LCA                Life-cycle Analysis
                       LDC                Local Distribution Companies
                       LNG                Liquefied Natural Gas
                       M&R                Metering and Regulation
                        Mcf               Thousand Cubic Feet
                       MMcf               Million Cubic Feet
                     MMTCH4               Million Metric Tonnes Methane
                     MMTCO2e              Million Metric Tonnes CO2 equivalent
                     NESHAP               National Emission Standards for Hazardous Air Pollutants

ICF International                                       v                                            April 2016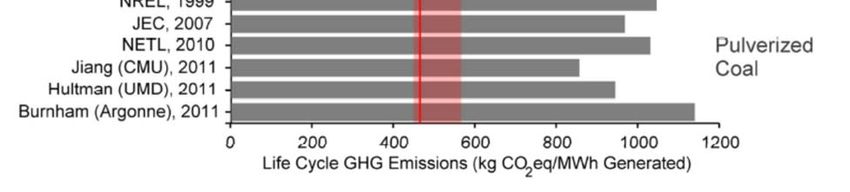
Finding the Facts on Methane Emissions: A Guide to the Literature

               Acronym / Abbreviation                             Stands For
                       NGS                Natural Gas STAR
                       NSPS               New Source Performance Standards
                       SAR                IPCC Second Assessment Report
                        scf               Standard Cubic Feet
                        scfd              Standard Cubic Feet per Day
                        scfh              Standard Cubic Feet per Hour
                       scfm               Standard Cubic Feet per Minute
                       TAR                IPCC Third Assessment Report
                       UNEP               United Nations Environmental Programme
                     UNFCCC               United Nations Framework Convention on Climate Change
                       WMO                World Meteorological Organization

ICF International                                      vi                                         April 2016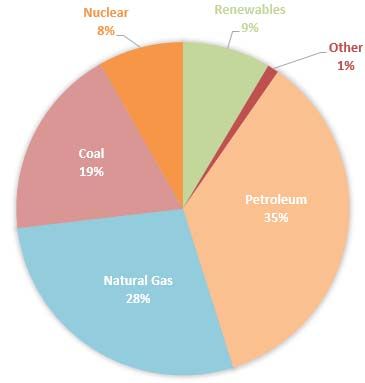
Finding the Facts on Methane Emissions: A Guide to the Literature
Executive Summary
1. Executive Summary
With the dramatically increased development of shale gas resources and a new period of low and
stable natural gas prices, natural gas has taken on an expanded role in the U.S. economy as a low
cost, clean-burning, flexible fuel for many applications. While natural gas has the lowest direct
emissions of all fossil fuels when combusted, concerns have been raised about the emissions of
methane in the gas production, processing, and delivery segments. This heightened interest has
resulted in new studies of the methane emissions profile of natural gas systems by a multitude of
entities, including government, industry, academia and non-government organizations. Many of
these studies are highly technical, some relying on significant assumptions or uncertainties
embedded in the study. Unfortunately, results of some of the studies are contradictory, creating
confusion for policymakers, industry and the general public.
The goal of this report is to examine these analyses through a “study of studies,” and provide
context for their respective conclusions. Therefore this report includes a guide to 75 different
studies. In addition to our study of the literature, and in order to provide perspective on methane
emissions, this report also examines the sources of methane emissions in the natural gas sector,
reviewing recent data on emissions, discussing efforts underway to reduce emissions from
natural gas systems and identifying over-arching conclusions from this activity. Overall, the
report finds that the natural gas industry continues to reduce methane emissions through
voluntary actions and in response to existing regulation by the federal and state governments.
This report addresses the following topics:
The sources of methane from the natural gas industry. (Chapter 2)
Background on greenhouse gases (GHGs). (Chapter 3)
U.S. government sources of data on methane emissions. (Chapter 4)
Recent studies of methane emissions. (Chapter 5)
Voluntary and regulatory efforts to reduce methane emissions. (Chapter 6)
Results and Conclusions
The key results of the study address the role of natural gas in U.S. methane emissions, the
environmental benefits associated with greater use of natural gas, and the results of the overview
of recent studies.
ICF International 1‐1 April 2016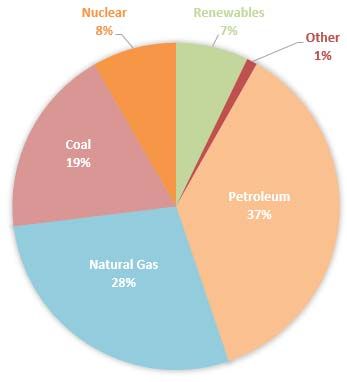
Finding the Facts on Methane Emissions: A Guide to the Literature
Executive Summary
The Role of Natural Gas Systems in U.S. Methane Emissions
The U.S. EPA Inventory of Greenhouse Gas Emissions and Sinks1 is
Combusted vs Non‐
the official inventory of U.S. human-influenced (“anthropogenic”)
Combusted Methane
GHG emissions and the only economy-wide, national inventory of
those GHGs. The EPA Inventory’s most recent report (2016 estimate
Emissions
of 2014 inventory) estimates that methane emissions comprise 10.6% Methane is the primary
of U.S. anthropogenic GHG emissions and methane emissions from component of natural gas –
the natural gas industry comprise 2.6% of total emissions. comprising more than 95% of
the delivered natural gas that
The EPA analysis of natural gas systems is based in large part is used in homes, businesses,
on emission factors developed from discrete samples and industrial facilities and
equipment counts from the 1990s. The most recent edition of electric power plants. When
the Inventory includes many updates with more recent natural gas is efficiently
information, and further updates are expected in the future. combusted to produce
energy and heat in homes,
The Inventory estimates that methane emissions from natural businesses and electric
gas systems were equal to 1.4% of the volume of methane in power plants, any associated
U.S. natural gas produced in 2014.i methane emissions are very
According to the EPA Inventory, methane emissions from the small.
natural gas industry have been declining continuously since In contrast, there are a
the early 1990s. Absolute emissions declined by 15% between variety of circumstances
1990 and 2014. Methane emissions per unit of gas produced when methane is released
declined by 43% over that same period. without combustion: EPA’s
Inventory of Greenhouse
Reasons for the decline in methane emissions include: Gases provides an annual
turnover and replacement of equipment, voluntary actions by snapshot of these emissions.
industry to reduce emissions, and the co-benefit of recent EPA’s GHG Inventory reveals
regulations requiring reductions in volatile organic compound that the largest source of U.S.
(VOC) emissions. methane emissions is
agricultural sources in
Environmental Benefits Associated With Greater Use of
livestock and farming. The
Natural Gas
natural gas industry is
Natural gas, whether produced from shale or other sources, often second, representing about
replaces other fuels or energy sources that emit higher levels of 24% of total U.S. human‐
carbon dioxide and criteria pollutants than are emitted by natural influenced (“anthropogenic”)
methane emissions in 2014,
gas. Its use also contributes to fewer overall emissions by
according to EPA’s GHG
enabling greater penetration of intermittent energy sources such as Inventory.
solar and wind energy.
i
Calculated as methane emissions/(gross natural gas withdrawals * methane content of 83%)
ICF International 1‐2 April 2016Finding the Facts on Methane Emissions: A Guide to the Literature
Executive Summary
Natural gas combustion releases significantly less carbon dioxide and criteria pollutants
such as sulfur dioxide, nitrogen oxides, particulate matter (soot) and mercury compared
to other fossil fuels.
According to the Energy Information Administration, U.S. carbon dioxide emissions are
near 20-year lows, due in large part to increased use of natural gas in the U.S. power
sector.
The most detailed and authoritative life-cycle analyses show that the life-cycle emissions
of natural gas are 40 to 50% lower than coal on a 100-year basis.
The use of natural gas for power generation enables greater penetration of clean,
renewable energy sources that are intermittent. Because natural gas-fired power plants
have the ability to quickly cycle off and on, they provide the dependable partner that solar
and wind energy require in the event that conditions are unfavorable to renewable power
generation.
The meta-analysis of 75 different methane emissions studies identified four major
categories, with the following characteristics:
Direct (“on-site”) measurement studies of emissions from natural gas operations show
that most sources and facilities have emissions lower than the factors utilized in the EPA
inventory, but a small number of sources – referred to as “super emitters” – inflate or
significantly skew the emission profile. Direct measurement studies also show that some
segments and source categories have been under-represented in the inventory, though this
is being addressed in the most recent inventory publication.
Ambient air measurement studies from all sources show a range of results – from
locally higher methane emissions than in the EPA GHG inventory, to much lower
emissions. The results are affected by a variety of uncertainties including weather,
estimates of other sources of methane, and estimates of natural gas production in the
regions being measured.
Life-cycle analyses draw on other sources to provide one integrated measure of
emissions from the entire natural gas value chain, from production to use at the burner
tip. (Sometimes referred to as “site-to-source.”) The most complete studies estimate that
overall emissions from natural gas are significantly lower than emissions from coal.
Meta-analyses examine numerous studies to search for overarching trends, recurring
facts and similar findings. Recent studies are attempting to reconcile the ambient air
studies and the direct measurement studies.
ICF International 1‐3 April 2016Finding the Facts on Methane Emissions: A Guide to the Literature
Introduction
2. Introduction
Methane is a greenhouse gas (GHG) that accounted for 10.6% of total U.S. GHG emissions on a
CO2 equivalent basis in the EPA’s Inventory for 2014, the most recent available. Agricultural
sources in livestock and farming operations are the largest U.S. sources of methane in the EPA
Inventory, accounting for 32% of methane emissions and 3.5% of total U.S. GHG emissions in
2014. The natural gas industries accounted for 24% of methane emissions, or 2.6% of all U.S.
GHG emissions in 2014, according to EPA’s Inventory.
Figure 2‐1 ‐ Methane Emissions from the Natural Gas Industries
Were 2.6% of Total GHG Emissions in 2014 (MMTCO2e)
Total = 6,870 MMTCO2e
Natural Gas, 2.6%
CO2, 80.9%
Other Methane,
8.1%
N2O, 5.9%
High GWP F‐Gases,
2.6%
With the development of shale gas resources and a new period of low and stable natural gas
prices, natural gas has assumed an expanded role in the U.S. economy as a low cost, low
emitting, flexible fuel for many applications. While natural gas has the lowest direct GHG
emissions of all fossil fuels when combusted (see Section 3.1), concerns have been raised about
the emissions of methane in the gas production, processing and delivery segments. Methane is
an odorless and colorless gas that comprises more than 95% of the natural gas that is used in
homes, commercial and industrial facilities, and electric power plants. The primary concern
around methane as a GHG is when it is emitted directly to the atmosphere without combustion.
Natural gas is extracted from diverse geologic reservoirs either as a primary product or as a co-
product of crude oil development. According to the EPA Inventory, methane emissions in 2014
were equal to 1.4% of the methane content of natural gas produced in the U.S. or 5.5 kg CO2e
ICF International 2‐1 April 2016Finding the Facts on Methane Emissions: A Guide to the Literature
Introduction
methane/Mcf of gas produced (gross withdrawals). This rate of Methane emissions per unit of
methane emissions has been declining continuously since 1990, gas produced have declined by
dropping by 42.6% between 1990 and 2014. There are multiple 43% since 1990.
reasons for this decline. First, equipment turnover typically results
in improved performance in most sectors as newer, more efficient, and lower-emitting equipment
replaces older equipment. Second, the natural gas industry has been engaging in voluntary
reduction activities since 1993 that focus on reducing the loss of natural gas from the value
chain. (See Section 6.1). Third, new regulations have taken effect in recent years to require
further reductions in VOC emissions that have a co-benefit of reducing methane emissions. (See
Section 6.3).
Figure 2‐2 ‐ Methane Emissions per Unit of Natural Gas Produced Have Declined Continuously Since
1990
Methane Emissions per Mcf Gas Produced
10
Kg CO2e/ Mscf Gross Withdrawal
8
6
4
2
0
1990 1995 2000 2005 2010
Data Source: EPA Inventory of GHG Emissions, Energy Information Administration
The increased interest in methane emissions from the natural gas industry has resulted in new
studies measuring or estimating the quantity of methane emissions from the natural gas sector
and related environmental implications. Many of these studies are very technical and some are
contradictory. The goal of this report is to provide context for this information, describe the
sources of methane emissions in the natural gas sector, review the recent studies and data
on these emissions, and discuss the implications for natural gas as a low emissions fuel.
The remainder of this chapter provides background on the role of natural gas in the U.S.
economy and an overview of the natural gas value chain and the sources of methane. Chapter 3
provides background on GHGs. Chapter 4 discusses the U.S. government sources of data on
ICF International 2‐2 April 2016Finding the Facts on Methane Emissions: A Guide to the Literature
Introduction
methane emissions. Chapter 5 discusses recent studies that are attempting to improve our
understanding of methane emissions and their implications for natural gas. Chapter 6 discusses
voluntary and regulatory efforts to reduce methane emissions. Chapter 7 provides some
conclusions. The Appendix provides a summary of a larger number of the recent studies.
2.1. Uses and Markets for Natural Gas
Natural gas plays a significant role in the U.S. economy that is important to consider in assessing
the emissions associated with its use. Natural gas is the second largest primary source of energy
in the United States, behind petroleum (oil) and ahead of coal, with a total consumed energy
value of approximately 27.9 quadrillion Btus in 2014. (Figure 2-3.) According to projections of
U.S. energy consumption to the year 2030, performed by the Energy Information Administration
(EIA), natural gas is expected to remain the second largest primary energy source in the country
during this time.
Figure 2-3 - U.S. Energy Mix – 2014 and 2030 projection
Total 2014 Energy Consumption: Total 2030 Energy Consumption:
98.5 quadrillion BTUs 102.9 quadrillion BTUs
Data source: U.S. Energy Information Administration, Annual Energy Outlook, 2015
Moreover, natural gas is unique among the energy sources shown in that it plays a major role in
multiple, diverse sectors of the economy. Figure 2-4 shows that in the United States, coal is
almost exclusively used by the electric power sector to generate electricity, along with hydro and
nuclear power, while petroleum is primarily used for transportation fuels and secondarily as a
ICF International 2‐3 April 2016Finding the Facts on Methane Emissions: A Guide to the Literature
Introduction
petrochemical feedstock and fuel in the industrial sector. Natural gas and its byproducts, by
contrast, are used widely as a fuel in the residential, commercial, power, and industrial sectors, in
addition to significant use as a chemical feedstock to make a variety of goods, such as medical
supplies, plastics, and fertilizer. This diversity of end uses means that natural gas has a direct
and significant impact on many sectors of the broader economy. Figure 2-4 shows that the
forecasted utilization of natural gas as an energy source is expected to increase.
Figure 2‐4 ‐ U.S. Energy Consumption by Sector – 2014 and 2030 projections
Source: Energy Information Administration, Annual Energy Outlook 2015
Figure 2-5 shows historical U.S. natural gas prices from 1997 through the beginning of 2016 and
U.S. EIA projections through 2025. It shows a period of gas prices around $2 per million Btu
(MMBtu) through about 2000, at which point variability increases due to a tight supply/demand
balance. Prices declined somewhat thereafter but then increased gradually through the decade.
There were several sharp peaks related to hurricane disruptions and broader commodity price
fluctuations. Prices have declined sharply since 2008 and remain generally below $3.50/MMBtu
due to the surge in natural gas production from shale gas. The projections show continuing
moderate prices, though the post-2018 projections, from early in 2015, may be on the high side
as they do not include the most recent price and economic growth trends.
ICF International 2‐4 April 2016Finding the Facts on Methane Emissions: A Guide to the Literature
Introduction
Figure 2‐5 ‐ U.S. Natural Gas Price Trends Have Declined in Recent Years
$15
$14
$13
$12
Henry Hub Spt Price ‐ $/MMBtu
$11
$10
$9
$8
$7
$6
$5
$4
$3
$2
$1
$‐
Jan‐1997
Jan‐1998
Jan‐1999
Jan‐2000
Jan‐2001
Jan‐2002
Jan‐2003
Jan‐2004
Jan‐2005
Jan‐2006
Jan‐2007
Jan‐2008
Jan‐2009
Jan‐2010
Jan‐2011
Jan‐2012
Jan‐2013
Jan‐2014
Jan‐2015
Jan‐2016
Jan‐2017
Jan‐2018
Jan‐2019
Jan‐2020
Jan‐2021
Jan‐2022
Jan‐2023
Jan‐2024
Jan‐2025
Data Source: U.S. Energy Information Administration – Natural Gas Monthly, Short Term Energy Outlook,
Annual Energy Outlook 2015
Declining natural gas prices have been a significant driver of increased use of natural gas in the
electricity generating sector. As natural gas prices have declined, the
dispatch cost of highly efficient natural gas combined cycle power plants Higher gas use for power
(NGCC) has become cost-competitive with that of coal plants. This, generation due to lower gas
along with the lower cost of building new natural gas-fired plants and prices has resulted in an 8%
pressure on coal from environmental regulation, has resulted in reduction in power sector CO2
significant growth in gas-fired generation, shown in Figure 2-6. Since emissions since 2005.
coal consumption in the power sector is by far the largest source of U.S.
GHG emissions, the shift from coal to natural gas has resulted in a nationwide 8% reduction in
CO2 emissions from the power sector since 2005. This is an important demonstration of the value
of the low emissions characteristics of natural gas.
ICF International 2‐5 April 2016Finding the Facts on Methane Emissions: A Guide to the Literature
Introduction
Natural gas also plays a critical role in the shift to increased renewable energy. Fast-acting gas-
fired peaking units are key to maintaining electric grid stability during changes in generation
from intermittent renewable generating technologies. As photovoltaic generation increases
market share, a large amount of peaking generation is expected to be required on a daily basis to
meet load in the afternoon and evening as the sun goes down. Base load power plants typically
cannot respond quickly enough to follow these large load shifts and are less efficient at part load.
Figure 2‐6 – Electricity Generation with Natural Gas is Increasing
1,200
1,000
Coal
Million MWh
800
600 Gas
Nuclear
400
200
Other
0
Data source: U.S. Energy Information Administration
Despite measurable improvements in the overall U.S. GHG emissions profile with greater use of
natural gas, some have questioned whether natural gas retains its environmental advantages
when upstream methane emissions are included. The studies discussed in the report address this
concern.
ICF International 2‐6 April 2016Finding the Facts on Methane Emissions: A Guide to the Literature
Introduction
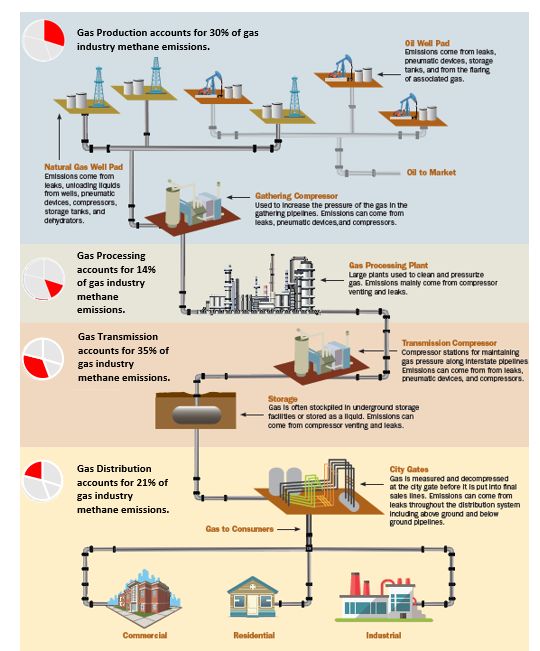
2.2. The Natural Gas Value Chain and Sources of Methaneii
There are many sources of methane emissions across the entire natural gas supply chain. These
emissions are characterized as either:
Fugitive emissions – methane that “leaks” unintentionally from equipment or components
such as flanges, valves, or other equipment.
Vented emissions – methane that is released due to equipment design or operational
procedures, such as from pneumatic device bleeds, blowdowns, and equipment venting.
Uncombusted emissions – small amounts of uncombusted methane in the exhaust of
natural gas combustion equipment in the production, processing and transmission
segments.
Although these sources are sometimes referred to as “leaks”, we use the more narrow technical
definitions in this report. Figure 2-7 illustrates the major segments of the natural gas industry and
examples of the primary sources of methane emissions as gas is produced, processed, and
delivered to consumers.
Natural gas is produced along with oil in most oil wells (as “associated gas”) and also in natural
gas wells that do not produce oil (as “non-associated gas”). For the last 100 years, domestic
natural gas production has been primarily in the Southwest, Gulf of Mexico, and the Rockies.
More recently, mid-continent and northeastern shale plays have been a growing source of natural
gas, as the focus of new development has turned to the extraction of gas from shale formations.
Shale is a sedimentary rock composed of compacted mud, clay and organic matter. Over time,
the organic material can produce natural gas and/or petroleum, which can slowly migrate into
formations where it can be recovered from conventional oil and gas wells. The shale rock itself is
not sufficiently permeable to allow the gas to be economically recovered through conventional
wells; that is, natural gas will not flow sufficiently freely through the shale to a well for
production.
Gas from shale formations is recovered by hydraulically fracturing the shale rock to release the
hydrocarbons. This involves pumping water and additives at high pressure into the well to
“fracture” the shale, creating small cracks that allow the gas to flow out. When the water “flows
back” out of the well during development, methane is entrained and historically may have been
vented.
ii
This overview is based on ICF’s Report entitled “Assessment of New York City Natural Gas Market Fundamentals and Life
Cycle Fuel Emissions”
ICF International 2‐7 April 2016Finding the Facts on Methane Emissions: A Guide to the Literature
Introduction
Figure 2‐7 ‐ Natural Gas Industry Processes and Example Methane Emission Sources
Source: Adapted from Clean Air Task Force “Waste Not”
http://www.catf.us/resources/publications/files/WasteNot.pdf
ICF International 2‐8 April 2016Finding the Facts on Methane Emissions: A Guide to the Literature
Introduction
For these reasons, the increased production of shale gas was at one time seen as a potential
source of increased GHG emissions. Federal regulations promulgated in 2012 require the
majority of new hydraulically fractured gas wells to capture or flare the flow-back gas. These
regulations and other federal and state regulations also require control of other methane-emitting
processes, though many apply only to new sources and to those wells that primarily produce
natural gas, rather than wells that produce natural gas along with oil.
Although some of the produced natural gas is pure enough to be used as-is, most natural gas is
transported by gathering pipeline from the wellhead to a natural gas processing plant. These
pipeline gathering systems may have pneumatic devices and compressors that vent gas, as well
as fugitive emissions. Gas processing plants remove additional hydrocarbon liquids such as
ethane and butane as well as gaseous impurities from the raw gas, including CO2, in order to
produce pipeline-quality natural gas to be compressed and transported. These gathering and
processing facilities are another potential source of fugitive and vented emissions.
From the gas processing plant, natural gas is transported, generally over long distances by
interstate pipeline to the “city gate” hub and then to consumers. The vast majority of
compressors that pressurize the pipeline to move the gas are fueled by natural gas, although a
small share is powered by electricity. Compressors emit CO2 and small amounts of methane
emissions during fuel combustion and are also a source of fugitive and vented methane emissions
through compressor seals, valves, connections, and through venting that occurs during operations
and maintenance. Compressor stations constitute the primary source of vented and fugitive
methane emissions in natural gas transmission.
Some power plants and large industrial facilities receive gas directly from transmission pipelines,
while others, such as residential and commercial consumers, have gas delivered through smaller
distribution pipelines operated by local gas distribution companies (LDCs). Distribution lines do
not typically require gas compression; however, some methane emissions do occur due to
leakage from older distribution lines and valves, connections, and metering equipment. This is
especially true for older systems that have cast iron or unprotected steel distribution mains.
Many of the emission sources from domestic oil production are similar to those in gas production
– completion emissions, pneumatic devices, processing equipment and engine/compressors.
Crude oil contains natural gas and the gas is separated from the oil stream at the wellhead and
can be captured for sale, vented, or flared. Venting or flaring is most common in regions that do
not have gas gathering infrastructure. This is the case currently in North Dakota, where rapid
growth in oil production has taken place in a region with little gas gathering infrastructure. While
new gathering lines are being built, production is still ahead of the gathering capacity, resulting
in continued flaring.
ICF International 2‐9 April 2016Finding the Facts on Methane Emissions: A Guide to the Literature
Introduction to Greenhouse Gases and Other Environmental Factors
3. Introduction to Greenhouse Gases and Other
Environmental Factors
Greenhouse gases (GHGs) are gases that trap heat within the earth’s atmosphere. Carbon dioxide
(CO2) is the primary GHG but there are others that are emitted in lower quantities and have a
stronger warming effect. This chapter discusses the emissions of different GHGs and how they
are expressed and tracked.
3.1. Combustion Emissions
Carbon dioxide (CO2) is a by-byproduct of the combustion process in which hydrocarbon fuel is
converted into heat and the combustion products of carbon dioxide and water. As shown in
Figure 3-1, natural gas combustion results in the lowest CO2 emissions of all fossil fuels –
approximately 43% less than those of coal and approximately 25-30% less than common liquid
petroleum fuels2. Natural gas also typically has lower emissions of conventional pollutants than
other fossil fuels, such as nitrogen oxides, sulfur dioxide and particulate matter. These lower
emissions have contributed to declining national CO2 emissions as gas has displaced coal and oil,
especially in the electricity sector.
Figure 3‐1‐ Natural Gas has the Lowest Direct CO2 Emissions of All Fossil Fuels
CO2 Emissions from Fuel Combustion
Natural Gas
Gasoline
Distillate Oil
Coal
0 20 40 60 80 100
kg CO2/MMBtu
Data source: Greenhouse Gas Reporting Rule
3.2. Non-CO2 Greenhouse Gases and Global Warming Potential
Greenhouse gases absorb and re-emit solar radiation, trapping heat in the earth’s atmosphere and
resulting in an overall warming effect. Different gases have different warming effects and
ICF International 3‐1 April 2016Finding the Facts on Methane Emissions: A Guide to the Literature
Introduction to Greenhouse Gases and Other Environmental Factors
different lifetimes in the atmosphere, making it difficult to compare their effects on a consistent
basis. A factor called global warming potential (GWP) is often used for this purpose. GWP can
be defined as the amount of total energy added to the climate by a gas relative to the impact of
the baseline gas, CO2, which is assigned a GWP of 1. The GHG emissions weighted by the GWP
are expressed as CO2 equivalent (CO2e).
The science and policy communities have historically looked to the U.N. Intergovernmental Panel
on Climate Change (IPCC) assessment reports as the authoritative basis for GWP values. The
IPCC is the chief international organization for climate change issues, and was established in 1988
by the United Nations Environmental Programme (UNEP) and the World Meteorological
Organization (WMO). Governments, organizations, and climate experts from all around the world
voluntarily contribute to these reports. Five Assessment reports have been published:
IPCC First Assessment Report 1990 (FAR)
IPCC Second Assessment Report 1995 (SAR)
IPCC Third Assessment Report 2001 (TAR)
IPCC Fourth Assessment Report 2007 (AR-4)
IPCC Fifth Assessment Report 2014 (AR-5)
Two key factors in determining the effect of a GHG are its warming effect and the length of time
that it remains active in the atmosphere. CO2 is the least potent of the GHGs but it remains in the
atmosphere for thousands of years and moves between different parts of the air-ocean-land
system. Even though it is the least potent, CO2 is the largest GHG source, especially from large
users of fossil fuels, and thus it has been a focal point for initiatives to regulate GHG emissions.
On the other hand, methane has a stronger warming effect than CO2, but its lifetime in the
atmosphere is only about 12 years. Other GHGs have much greater warming effect than methane
and may have longer or shorter lifetimes. Table 3-1 was developed by the U.S. EPA3 to describe
the characteristics and lifetimes of major greenhouse gases based on the IPCC’s Fifth
Assessment Report.
The IPCC calculates the GWP based on a 100 year and 20 year lifetime to provide alternative
bases for analyzing emission impacts. Depending on the lifetime of the individual gas, the 20
year GWP can be higher or lower than the 100 year GWP. Both of these values are correct but
they reflect a different snapshot of the warming effect of the subject gases. While there is no
scientific imperative for selecting one or the other GWP life, the GWP for a time horizon of 100
years was adopted as a metric to implement the multi-gas approach embedded in the United
Nations Framework Convention on Climate Change (UNFCCC) and was made operational in the
1997 Kyoto Protocol. The 100 year GWP is also the standard for reporting national emissions to
the UNFCCC and is the standard used in most national GHG reporting and regulatory programs.
ICF International 3‐2 April 2016Finding the Facts on Methane Emissions: A Guide to the Literature
Introduction to Greenhouse Gases and Other Environmental Factors
Table 3‐1 – Greenhouse Gas GWPs and Lifetime
Average Lifetime in
Greenhouse Gas How It’s Produced 100-Year GWP
the Atmosphere
Carbon Dioxide Produced mainly by the burning of Carbon dioxide’s 1
fossil fuels (oil, natural gas, and coal), lifetime is not defined
solid waste, and trees and wood because it continues to
products. Land-use changes, move between
deforestation, and soil degradation also different parts of the
contribute to its production. ocean-atmosphere-
land system instead of
being destroyed.
Methane Emitted during the production and 12 years 28
transport of coal, natural gas, and oil, as
well as from livestock, agricultural
practices, and the anaerobic decay of
organic waste in solid waste landfills.
Nitrous Oxide Produced during agricultural and 121 years 265
industrial activities, and during the
combustion of fossil fuels and solid
waste.
Fluorinated Gases Synthetic gases containing fluorine, A few weeks to Varies (Sulfur
such as hydrofluorocarbons, thousands of years hexafluoride is the
perfluorocarbons, and sulfur highest at 23,500)
hexafluoride. They are emitted from
various industrial processes and
commercial and household uses.
Source: http://www.epa.gov/climatechange/glossary.html
Most countries and international agencies (including the U.S. EPA) follow inventory protocols
set by the IPCC, which still use the AR-4 100 year GWP of 25. That said, the AR-5 is the most
recent assessment and includes some changes in the treatment of the methane GWP. The first
major change in AR-5 is fully including carbon cycle feedback in calculating the GWP. As the
temperature increases, the biosphere retains less CO2, which enters the atmosphere and causes
further warming. This feedback was included for CO2 (the denominator in the GWP) in earlier
reports but not for the other gases. Including it for the other gases increases the calculated GWP
for each GHG.
The second change is specific to methane. When methane oxidizes in the atmosphere, it creates
CO2, which has an additional warming effect. Thus methane emissions have a direct and then an
indirect effect on the Earth’s climate due to the CO2 that is created. The primary GWP values for
methane listed in the AR-5 are for biogenic methane, for which the CO2 is assumed to have been
absorbed from the biosphere and therefore the oxidation does not constitute a net increase. For
ICF International 3‐3 April 2016Finding the Facts on Methane Emissions: A Guide to the Literature
Introduction to Greenhouse Gases and Other Environmental Factors
fossil methane, however, the methane oxidation effect adds 1 to the 20 year GWP and 2 to the
100 year GWP.
The AR-5 100-year value GWP value for methane without feedback or oxidation adjustment is
28 (slightly higher than the AR-4 value of 25). With the adjustment for fossil methane it is 30.
The value with feedback and adjustment for oxidation is 36. The 20 year values in the AR-5 are
84 without feedback or oxidation and 87 with feedback and oxidation. These results are
summarized in Table 3-2. These new findings in the AR-5 have not been accepted by all parties
and many entities, including some government and regulatory agencies, use the values without
feedback, while few organizations are currently using the values with the feedback and oxidation
factor.
Table 3‐2 ‐ Global Warming Potentials for Methane for Different Lifetimes (including feedbacks)
IPCC AR Year Published 20 – Year GWP 100 - Year GWP
AR-4 2007 72 25
AR-5* 2014 84/86/87 28/34/36
*Without feedback/With feedback/With oxidation
Source: IPCC
3.3. Emissions Measurement and Reporting
Methane emissions can be measured and reported in a variety of units and formats. The most
common are listed below with the most recent values from the U.S. EPA’s 2016 GHG Inventory
for emissions in 2014:
Volumetric basis: Expresses emissions in units of cubic feet (ft3) or meters (m3). The
Inventory reports 366 billion cubic feet (Bcf) of methane emitted from natural gas
operations in 2014.
Mass basis: Expresses the mass of methane emissions in units such as kilotonnes or
gigagrams (Gg). The Inventory reports 7,045 kilotonnes (kT) of methane emitted from
natural gas operations in 2014.
CO2e basis: Expresses the mass of GWP-weighted methane emissions in units of million
metric tons of CO2 equivalent (MMTCO2e). The 2013 Inventory reports 176.1
MMTCO2e emitted from natural gas operations (using a GWP of 25) in 2014.
Percent of production: Expresses methane emissions as a percentage of natural gas
produced annually in the U.S. or the methane content thereof - sometimes referred to as a
"leakage rate". The Inventory methane emissions were equivalent to 1.4% of the methane
(83%) in gross natural gas withdrawals in 2014.
ICF International 3‐4 April 2016Finding the Facts on Methane Emissions: A Guide to the Literature
Federal Reporting of GHG Emissions
4. Federal Reporting of GHG Emissions
4.1. EPA Inventory of GHG Emissions
The U.S. EPA Inventory of U.S. Greenhouse Gas Emission and Sinks 1 is an annual report that
quantifies greenhouse gas emissions from all sectors of the U.S. economy and is the only
national, economy-wide estimate of U.S. GHG emissions in general and methane emissions
specifically. Emissions are estimated using national level data collected across many different
sources. Each year, the inventory is submitted to the United Nations Framework Convention on
Climate Change (UNFCCC) to fulfill the U.S. commitment to the reporting requirements for
annual emission inventories established by the UNFCCC. In addition to serving as the official
U.S. accounting of GHG emissions, the inventory serves as a reference and source of
information on opportunities for reduction and a measure of progress on voluntary and
regulatory programs.
The EPA GHG inventory provides methane emissions estimates by source across the entire
economy including the natural gas industry. Emissions are tabulated by source and equipment
type and are split across each of the different segments to provide a U.S. national estimate. The
inventory structure includes over 200 source categories for the oil and gas industries. Data is
available on an annual basis dating from 1990 to the year of publication. Emissions and activity
data are updated each year for every source over the entire time span when the EPA GHG
Inventory is released. For instance, the 2016 version of the EPA GHG Inventory includes revised
data not only for the latest year, 2014, but also revisions to all sources and activity dating back to
1990.
Emissions are generated using an activity factor (AF) and emission factor (EF). The AF depicts
the population of sources – number of wells, miles of pipeline, etc. The EF is the emission rate
per unit of activity – e.g., cubic feet emitted per well, device, or mile. The equation is:
The AFs in the EPA GHG Inventory are driven by a number of different national level data
sources including the Energy Information Administration (EIA), the Oil and Gas Journal (OGJ),
and the Pipeline and Hazardous Materials Safety Administration (PHMSA). Many of the EFs
have historically been based on a measurement study performed by the Gas Research Institute
(GRI) and EPA4 in the 1990s. This study performed site level measurements across multiple
emission sources to estimate average emission rates for each type of equipment. The emissions
estimates based on these sources are then adjusted to account for both voluntary and regulatory
reductions undertaken by industry. The voluntary reduction estimates are primarily based on
reductions reported to the EPA Gas STAR program (See Section 6.1).
ICF International 4‐1 April 2016Finding the Facts on Methane Emissions: A Guide to the Literature
Federal Reporting of GHG Emissions
The estimates are revised each year based on the most recent activity data. The EPA also reviews
new data on emissions to identify better emission factors. There are limits to the kinds of data
that can be used, however. The data must be public, citable, nationally applicable, and able to be
applied over the entire historical series. In recent years, the EPA has been reviewing and
adopting multiple new sources of data, especially the Greenhouse Gas Reporting Program
(GHGRP) to identify potential updates to the Inventory.
The EPA implemented many changes for the most recent edition of the Inventory, released in
2016 with data for 2014. The changes included data from the GHGRP as well as results of some
of the recent emission measurement studies described in Chapter 5. The changes included
updated equipment counts, especially for pneumatic controllers, and some updated emission
factors. The change was especially significant for gathering and boosting facilities, which are
included in the production segment of the Inventory. The original GRI data estimated a relatively
small population of gathering facilities. More recent data resulted in a significant increase in the
estimated population and an increase in the estimated emission factors, with a corresponding
large increase in overall estimated emissions, included in the production segment of the
Inventory. On the other hand, recent measurement studies showed large reductions in emission
rates in the transmission and distribution segments, offsetting some of the upstream increases.
Figure 4-1 shows the effect of these changes on the emissions from natural gas systems for 2013,
the most recent year for which both versions are available.
The estimate of 2013 methane emissions for natural gas systems in the 2016 version is 12%
higher than in the prior year. The natural gas industry methane emissions as a share of total U.S.
GHG emissions in 2013 increased only slightly, from 2.4% in the 2015 estimate to 2.6% in the
2016 estimate. The natural gas industry share of methane emissions for 2013 went down very
slightly in the 2016 estimate, from 24.7% to 24.3%.
The decrease in distribution system emissions reflects company efforts to reduce leaks and
replace older equipment. Gas distribution companies also have been reducing leaks by replacing
old cast iron pipe, which is leak-prone, at the rate of roughly 3% per year. Leak repair of old
cast-iron pipe is difficult and costly because most of the pipe is in older, congested urban areas,
mostly in the Northeast. Companies must receive approval from state regulators to make these
investments and the regulators’ primary concern is safety and cost to consumers rather than
emissions. That said, many states and distribution companies are developing or have
implemented accelerated pipeline replacement programs, which have contributed to the
reductions.
ICF International 4‐2 April 2016Finding the Facts on Methane Emissions: A Guide to the Literature
Federal Reporting of GHG Emissions
Figure 4‐1 – Changes to 2016 EPA GHG Inventory for Natural Gas Systems for Emissions in 2013
180
160
140 Distribution
120
Trans &
MMTCO2e
Storage
100
Processing
80
Production
60
40
20
0
2015 2016
Inventory Release Year
As described above, the EPA must also adjust the emission estimate back to 1990. Because
detailed data on the updated factors were not available for all of the intervening years, a portion
of the emission curve between 1990 and 2005 was linearly interpolated, resulting in a straight
line estimate. Figure 4-2 below displays total emissions reported annually for the natural gas
industry since 1990 to the 2014 estimate of 366 Bcf or 176.1 MMTCO2e of methane from the
natural gas industry. The absolute emissions have been declining for most of the period, with a
slight uptick in the last years. However, this trend does not take into account the changes in
natural gas production and throughput during this period, especially during the last few years as
shale gas production has increased, as shown in the chart.
ICF International 4‐3 April 2016Finding the Facts on Methane Emissions: A Guide to the Literature
Federal Reporting of GHG Emissions
Figure 4‐2 ‐‐ Methane Emissions Have Been Declining While Production Increases
Methane Emissions and Gas Production
250 MMTCO2e 35
30
Gross Withdrawals (Tcf)
200
25
MMTonne CO2e
150 Tcf 20
100 15
10
50
5
0 2013 0
1990 1995 2000 2005 2010
Data source: Greenhouse Gas Inventory Data Explorer;
http://www3.epa.gov/climatechange/ghgemissions/inventoryexplorer/#energy/allgas/source/all , U.S. Energy
Information Administration
Figure 4-3 displays natural gas emissions per thousand cubic feet (Mcf) of gas produced. As U.S.
natural gas production has increased rapidly in recent years, the ratio of estimated emissions per
cubic foot of production has gone down. The emissions per unit of production were nearly 43%
lower in 2014 than in 1990. Factors contributing to this reduction include equipment turnover
and replacement, voluntary reductions of natural gas losses by the gas industry, and recent
regulations to limit volatile organic compounds (VOCs), which have the co-benefit of reducing
methane emissions. In addition, methane emissions in many parts of the industry are not highly
correlated to throughput so increased production and use tend to reduce emissions per unit of
natural gas throughputiii.
iii
Commenters from the gas distribution Industry have stated that the EPA Inventory has incorrectly assumed a correlation
between throughput and emissions in at least one instance related to distribution companies. The commenters state that the
EPA assumption that higher throughput during cold weather leads to higher gas pressure and higher emissions is not correct.
Pressure is typically lower during these conditions due to high demand.
ICF International 4‐4 April 2016Finding the Facts on Methane Emissions: A Guide to the Literature
Federal Reporting of GHG Emissions
Figure 4‐3 – Methane Emissions per Mcf of Production Have Declined Sharply
Methane Emissions per Mcf Gas Produced
9
8
Kg CO2e/ Mscf Gross Withdrawal
7
6
5
4
3
2
1
0
1990 1995 2000 2005 2010
4.2. Greenhouse Gas Reporting Program (GHGRP)
The GHGRP was finalized by the EPA in October 2010 in response to a Congressional mandate.
This rule establishes a mandatory program that requires the reporting of greenhouse gas
emissions on a facility-level basis from all sectors of the economy. The rule does not require
control measures to reduce methane. The reporting requirement applies to facilities that emit
25,000 metric tonnes (25 MTCO2e) or more of carbon dioxide equivalent per year of all GHGs.
Therefore, a facility must include emissions from all sources when evaluating the threshold to
determine if it is necessary to report. Many facilities in the natural gas industry do not exceed the
threshold and therefore the GHGRP is an incomplete depiction of the industry.
The threshold is on a facility basis, and not by source category or subpart. A “facility” is a
physical property, plant, building, structure, source, or stationary equipment located in a
contiguous area under common ownership which can have multiple source categories subject to
regulation. The exceptions to this in the oil and gas industry are for onshore production, where a
facility is defined as a producing basin, and for natural gas distribution, where a facility includes
all of the LDC operations within a state. The first reporting occurred in 2012 and represented
2011 emissions.
The rule has 43 subparts, including the general provisions in Subpart A and 42 subparts, each
representing a source of emissions from a particular industry or process. Each subpart sets
requirements for data directly related to the source category, which must be reported to EPA.
The reporting system for methane emissions from petroleum and natural gas systems is included
ICF International 4‐5 April 2016Finding the Facts on Methane Emissions: A Guide to the Literature
Federal Reporting of GHG Emissions
in “Subpart W.” Under Subpart W, oil and gas facilities report methane emissions from specific
emission sources across the natural gas/oil supply chain, including: onshore and offshore
petroleum and natural gas production, onshore natural gas processing, natural gas transmission
and underground storage, liquefied natural gas (LNG) storage, LNG import and export, and
natural gas distribution facilities. The original subpart W did not include gathering facilities,
however a modification to the rule in 2015 added these facilities to the reporting requirements,
beginning in 2016.
Subpart W requires reporting of emissions from sources such as compressors, dehydrators,
pneumatic devices, and storage tanks. This data is sent directly to EPA, which confirms the
reported information. Reporting entities are subject to significant penalties and possible fines or
imprisonment for submitting false statementsiv. Data within these subparts is developed by
reporters using a variety of methods including direct measurements, engineering calculations,
and emission factors specified in the rule.
Because many gas industry facilities do not exceed the 25,000 MTCO2e threshold, the GHGRP
provides an incomplete estimate of total U.S. emissions. In addition, some types of equipment
are not included in the reporting requirements, further limiting the completeness of the program
and the comparability of Inventory and GHGRP data. For example, the EPA Inventory for 20135
reports 2,588 Gg of methane emissions from petroleum systems and 7,023 Gg of methane
emissions from natural gas systems. However, the GHGRP subpart W data for 2013 reports only
2,948 Gg of methane emissions from 2,169 total reporting facilities in the oil and natural gas
sectors, including:
2,010 Gg of methane emissions from onshore and offshore petroleum and natural gas
production (601 total reporting facilities)
935 Gg from natural gas processing, transmission, storage and distribution (1,141
reporting facilities)6.
While EPA’s annual GHGRP system is not directly comparable to the GHG Inventory it does
provide detailed and current information on activity factors and emission rates for many
processes at the facilities that must report. This is an extremely valuable source of data.
iv
See 40 C.F.R. §98.4(e) Certification of the GHG emissions report (Subpart A, General Provisions).
ICF International 4‐6 April 2016You can also read