Exploring the millimetre emission in nearby galaxies: Analysis of the edge-on galaxy NGC 891 - EPJ Web of ...
←
→
Page content transcription
If your browser does not render page correctly, please read the page content below
EPJ Web of Conferences 257, 00023 (2022)                                 https://doi.org/10.1051/epjconf/202225700023
mm Universe @ NIKA2

      Exploring the millimetre emission in nearby galaxies:
      Analysis of the edge-on galaxy NGC 891

      S. Katsioli1,2,∗ , R. Adam3 , P. Ade4 , H. Ajeddig5 , P. André5 , E. Artis6 , H. Aussel5 ,
      A. Beelen7 , A. Benoît8 , S. Berta9 , L. Bing10 , O. Bourrion6 , M. Calvo8 , A. Catalano6 ,
      I. De Looze11,12 , M. De Petris13 , F.-X. Désert14 , S. Doyle4 , E. F. C. Driessen9 , G. Ejlali15 ,
      M. Galametz5 , F. Galliano5 , A. Gomez16 , J. Goupy8 , A. P. Jones7 , A. Hughes7 , F. Kéruzoré6 ,
      C. Kramer9,17 , B. Ladjelate17 , G. Lagache10 , S. Leclercq9 , J.-F. Lestrade18 , J.-F. Macías-
      Pérez6 , S. C. Madden5 , A. Maury5 , P. Mauskopf4,19 , F. Mayet6 , A. Monfardini8 , M. Muñoz-
      Echeverría6 , A. Nersesian11,1 , L. Perotto6 , G. Pisano4 , N. Ponthieu14 , V. Revéret5 ,
      A. J. Rigby4 , A. Ritacco7,19 , C. Romero20 , H. Roussel21 , F. Ruppin22 , K. Schuster9 , S. Shu23 ,
      A. Sievers17 , M. W. L. Smith4 , F. Tabatabaei15,24 , C. Tucker4 , E. M. Xilouris1 , and R. Zylka9
      1
        National Observatory of Athens, Institute for Astronomy, Astrophysics, Space Applications and Re-
        mote Sensing, Ioannou Metaxa and Vasileos Pavlou GR-15236, Athens, Greece
      2
        Department of Astrophysics, Astronomy & Mechanics, Faculty of Physics, University of Athens,
        Panepistimiopolis, GR-15784 Zografos, Athens, Greece
      3
        LLR (Laboratoire Leprince-Ringuet), CNRS, École Polytechnique, Institut Polytechnique de Paris,
        Palaiseau, France
      4
        School of Physics and Astronomy, Cardiff University, Queen’s Buildings, The Parade, Cardiff, CF24
        3AA, UK
      5
        AIM, CEA, CNRS, Université Paris-Saclay, Université Paris Diderot, Sorbonne Paris Cité, 91191 Gif-
        sur-Yvette, France
      6
        Univ. Grenoble Alpes, CNRS, Grenoble INP, LPSC-IN2P3, 53, avenue des Martyrs, 38000 Grenoble,
        France
      7
        Université Paris-Saclay, CNRS, Institut d’astrophysique spatiale, 91405, Orsay, France
      8
        Institut Néel, CNRS, Université Grenoble Alpes, France
      9
        Institut de RadioAstronomie Millimétrique (IRAM), Grenoble, France
      10
         Aix Marseille Univ, CNRS, CNES, LAM (Laboratoire d’Astrophysique de Marseille), Marseille,
         France
      11
         Sterrenkundig Observatorium Universiteit Gent, Krijgslaan 281 S9, B-9000 Gent, Belgium
      12
         Department of Physics and Astronomy, University College London, Gower Street, London WC1E
         6BT, UK
      13
         Dipartimento di Fisica, Sapienza Università di Roma, Piazzale Aldo Moro 5, I-00185 Roma, Italy
      14
         Univ. Grenoble Alpes, CNRS, IPAG, 38000 Grenoble, France
      15
         Institute for Research in Fundamental Sciences-IPM, Larak Garden,19395-5531 Tehran, Iran
      16
         Centro de Astrobiología (CSIC-INTA), Torrejón de Ardoz, 28850 Madrid, Spain
      17
         Instituto de Radioastronomía Milimétrica (IRAM), Granada, Spain
      18
         LERMA, Observatoire de Paris, PSL Research University, CNRS, Sorbonne Université, UPMC,
         75014 Paris, France
      19
         School of Earth and Space Exploration and Department of Physics, Arizona State University, Tempe,
         AZ 85287, USA Laboratoire de Physique de l’École Normale Supérieure, ENS, PSL Research Uni-
         versity, CNRS, Sorbonne Université, Université de Paris, 75005 Paris, France
          ∗ e-mail: s.katsioli@noa.gr

© The Authors, published by EDP Sciences. This is an open access article distributed under the terms of the Creative Commons
Attribution License 4.0 (http://creativecommons.org/licenses/by/4.0/).
EPJ Web of Conferences 257, 00023 (2022)                            https://doi.org/10.1051/epjconf/202225700023
mm Universe @ NIKA2

      20
         Department of Physics and Astronomy, University of Pennsylvania, 209 South 33rd Street, Philadel-
         phia, PA, 19104, USA
      21
         Institut d’Astrophysique de Paris, Sorbonne Université, CNRS (UMR7095), 75014 Paris, France
      22
         Kavli Institute for Astrophysics and Space Research, Massachusetts Institute of Technology, Cam-
         bridge, MA 02139, USA
      23
         Caltech, Pasadena, CA 91125, USA
      24
         Instituto de Astrofísica de Canarias, Vía L’actea S/N, 38205 La Laguna, Spain

                 Abstract. New observations of the edge-on galaxy NGC 891, at 1.15 and 2 mm
                 obtained with the IRAM 30-m telescope and the NIKA2 camera, within the
                 framework of the IMEGIN (Interpreting the Millimetre Emission of Galaxies
                 with IRAM and NIKA2) Large Program, are presented in this work. By using
                 multiwavelength maps (from the mid-IR to the cm wavelengths) we perform
                 SED fitting in order to extract the physical properties of the galaxy on both
                 global and local (∼kpc) scales. For the interpretation of the observations we
                 make use of a state-of-the-art SED fitting code, HerBIE (HiERarchical Bayesian
                 Inference for dust Emission). The observations indicate a galaxy morphology,
                 at mm wavelengths, similar to that of the cold dust emission traced by sub-
                 mm observations and to that of the molecular gas. The contribution of the radio
                 emission at the NIKA2 bands is very small (negligible at 1.15 mm and ∼ 10% at
                 2 mm) while it dominates the total energy budget at longer wavelengths (beyond
                 5 mm). On local scales, the distribution of the free-free emission resembles that
                 of the dust thermal emission while the distribution of the synchrotron emission
                 shows a deficiency along the major axis of the disc of the galaxy.

      1 Introduction
      Nearby galaxies have provided a great piece of knowledge in the field of galaxy formation and
      evolution. Their proximity allows us to study galaxies at high resolution and to derive their
      properties on local (sub-kpc/kpc) scales. The current study is part of the IMEGIN Large Pro-
      gram (P.I.: S. Madden), a NIKA2 guaranteed time program of 200 hours allocated telescope
      time with the aim of mapping 22 nearby galaxies (distances of < 30 Mpc) at 1.15 and 2 mm
      using the NIKA2 continuum camera at the IRAM 30-m telescope [1–4]. The main objective
      of the project is to explore the emission at millimetre wavelengths originating from nearby
      galaxies, a complex wavelength regime with contributions from a mix of different emission
      mechanisms (free-free, synchrotron, and dust thermal emission). This is the first time that
      nearby galaxies are being observed in the continuum at mm wavelengths at resolutions of
      11.1 and 17.6 (∼ 0.5 kpc, and ∼ 0.8 kpc at a distance of 10 Mpc) at 1.15 and 2 mm respec-
      tively. At these scales it is possible to disentangle the contribution of the different emission
      mechanisms in different environments inside the galaxies (disc, halo, HII regions, etc).
          As a pilot study, we analyze the NIKA2 observations of the edge-on galaxy NGC 891, a
      SA(s)b type galaxy [5]. Due to its proximity (D = 9.6 Mpc; [6]) and its edge-on orientation
      (i  89.8◦ ; [7]), NGC 891 is one of the most observed and well studied galaxies of the Local
      Universe (e.g. [7–10]).

      2 Observations and Analysis
      The NIKA2 observations of NGC 891 were obtained between October 2019 and January
      2020 with a total on-source integration time of 7 hours. The maps of the galaxy at 1.15 and

                                                        2
EPJ Web of Conferences 257, 00023 (2022)                           https://doi.org/10.1051/epjconf/202225700023
mm Universe @ NIKA2

     Figure 1. NIKA2 high-resolution millimeter observations of NGC 891 at 1.15 (top panel) and 2 mm
     (bottom panel). The maps are presented in their native resolution (11.1 and 17.6 at 1.15 and 2 mm
     respectively; indicated by the white circles in each panel) and they are rotated by 22.9◦ (the position
     angle of the galaxy). Their sky RMS values are 1.0 mJy beam−1 and 0.3 mJy beam−1 at 1.15 mm and
     2 mm. The surface brightness contours correspond to 3.5, 8, 15 and 30 × RMS.

     2 mm were reduced using the GILDAS/PIIC1 (version of 29.04.2020) software [11] and are
     shown in Fig. 1 (top and bottom panels respectively). The edge-on orientation of the galaxy
     and the high resolution of the maps allow us to discern different regions along the major axis
     with the main characteristics being a peak emission at the nucleus and secondary maxima at
     ∼ 3 kpc either side of the center. These emission features closely resemble the distribution
     of the cold dust traced by sub-mm observations [12] as well as of the molecular gas [13, 14]
     which are possibly originating either from a ring structure or limb brightening associated with
     spiral arms (see [15]).
         In our study we performed a Spectral Energy Distribution (SED) analysis of NGC 891
     using multiwavelength data ranging from 3.4 µm to 5 cm. We used archival data from the
     WISE telescope (3.4, 4.6, 11.6 and 22.1 µm), the Spitzer telescope (3.6, 4.5, 5.8, and 24 µm),
     as well as the Herschel telescope (70, 100, 160, 250, and 350 µm). Along with the NIKA2
     observations at 1.15 and 2 mm we also used centimeter data from the AMI (2 cm) and EVLA
     (5 cm) radio telescopes. The archival data have been retrieved from the DustPedia2 and
     NED3 databases. The maps were all convolved (using Gaussian Kernels) to the same angular
     resolution of 25 corresponding to the resolution of the 350 µm SPIRE map. This resolution
     corresponds to ∼ 1.1 kpc at the distance of NGC 891. All maps have also been regridded
     into a common reference frame with a pixel size of 8 . Fitting the continuum emission of
     the galaxy, we had to remove the background sources from the near-IR maps as well as to
     correct the 1.15 mm map (see [1] for the NIKA2 transmission curves) from the CO(2-1) line
     contamination following the procedure described in [16]. In order to compute the global
     fluxes at each wavelength we used an elliptical aperture centered at RA J2000 = 2h 22m 33 s ,
     DEC J2000 = +42◦ 20 53 [17] with major and minor axes of 5 and 48 respectively and
        1 https://publicwiki.iram.es/PIIC/
        2 http://dustpedia.astro.noa.gr/
        3 https://ned.ipac.caltech.edu/

                                                        3
EPJ Web of Conferences 257, 00023 (2022)                            https://doi.org/10.1051/epjconf/202225700023
mm Universe @ NIKA2

      Figure 2. Left panel: the global SED of NGC 891 with multiwavelength data ranging from 3.4 µm to
      6.3 cm. The curve passing through the photometric data is the best fitted model with the width of the
      curve indicating the uncertainty of the model along the spectrum. The emission components of the total
      SED of the galaxy, stellar, dust and radio, are plotted with orange, red and brown color respectively.
      The residuals between the observed and the model predicted fluxes are given in the graph below the
      SED in dex. Right panel: An emission decomposition plot for characteristic wavelengths in the spectral
      range between 1 mm to 2 cm. The percentage of the dust emission is presented with orange color, while
      red and blue colors are used for percentages of the free-free and the synchrotron emission respectively.

      positional angle of 22.9◦ , so as to encompass the bulk of the emission originating from the
      disc of the galaxy. Additional global photometry at radio wavelengths (from Planck, 100-m
      Effelsberg, OVRO, WSRT and GBT telescopes) were also culled from the literature.
          To interpret the SED we used the SED fitting code HerBIE (Hierarchical Bayesian In-
      ference for dust Emission; [18, 19]). In contrast to the commonly used least-squares fitting
      method, HerBIE eliminates the noise-induced correlations between the parameters. The code
      takes into account realistic optical properties and stochastic heating for the dust grains by
      making use of the THEMIS dust model which is described in detail in [20, 21]. Free-free and
      synchrotron emission mechanisms are also implemented in the code. The global SED of the
      galaxy, fitted by the HerBIE code, is presented in the left panel in Fig. 2.
          With an angular resolution of 25 (see Sec. 2) the observations used in this study allowed
      us to perform spatially resolved SED fitting within the galaxy and create maps of the local
      physical properties associated with the dust and radio emission. The maps presented in Fig. 3
      show the total dust luminosity map (left), the free-free luminosity at 2 cm (middle) and the
      synchrotron luminosity at 2 cm (right).

      3 Results
      Modelling the SED of NGC 891 in the wavelength range from 3.4 µm to 6.3 cm allows us
      to accurately determine the dust content, taking into account emission from the aromatic
      features as well as from the continuum emission from small and big grains, but also the radio
      emission composed by the free-free and the synchrotron radiation. Our model predicts a total
      dust mass of (4.18 ± 0.21) × 107 M , while the mass fraction of the small carbon grains over
      the total dust mass is 0.10 ± 0.01. The total radio luminosity at 2 cm is (5.54 ± 0.24) × 104 L
      with a fraction of 0.16 ± 0.11 originating in free-free radiation. The inferred value of the
      synchrotron radiation index (αs ) is 0.78 ± 0.08 (in agreement with other studies, e.g. [9]).

                                                        4
EPJ Web of Conferences 257, 00023 (2022) https://doi.org/10.1051/epjconf/202225700023
mm Universe @ NIKA2
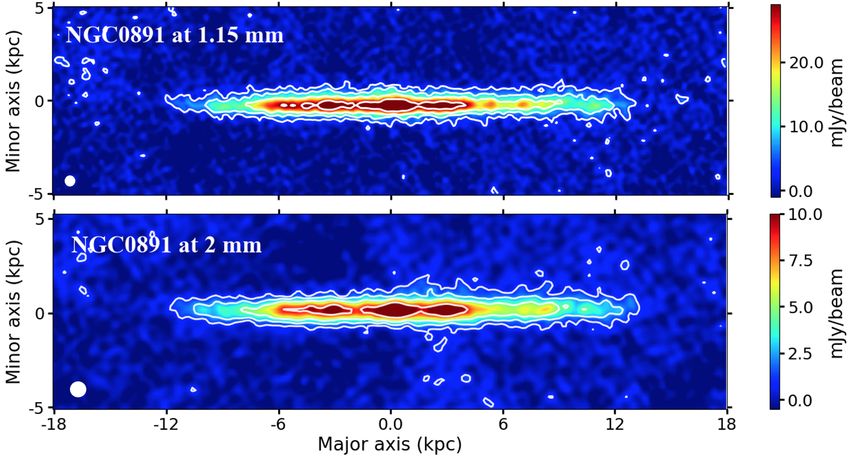
Figure 3. Maps of the model-inferred luminosity for the dust emission (left panel), the free-free lumi-
nosity at 2 cm (middle panel) and the synchrotron luminosity at 2 cm (right panel).The colorbar on the
right in each panel indicates the luminosity in units of L pc−2 .
Having modelled the SED we can now study the largely unexplored wavelength range
between ∼ 1 mm and ∼ 2 cm where a mix of emission mechanisms exists. In the right panel
of Fig. 2 we present the percentages to the global emission of dust (orange color), free-free
(red color) and synchrotron emission (blue color) at 1, 2, 3, 5, 7 mm and 1, and 2 cm. From
this plot it is evident that the dust thermal emission dominates to up to ∼ 3 mm where the
contributions of the free-free and synchrotron emission mechanisms become almost equally
significant to the dust emission. At longer wavelengths, these latter emission mechanisms
dominate with the synchrotron emission increasing rapidly with values up to ∼ 84% at 2 cm,
while the free-free emission reaches a maximum contribution of ∼ 26% at ∼ 7 mm and then
drops again.
The spatial decomposition of the emission of the galaxy (see Fig. 3) allows us to deter-
mine the places where the different emission mechanisms dominate. From the dust luminosity
map (left panel of Fig. 3) it is evident that the bulk of the dust emission comes from the disc
of the galaxy, as it is clearly seen also from the NIKA2 observations (Fig. 1), but with signif-
icant amount also coming from the dust halo at large distances from the disc. The free-free
emission at 2 cm (middle panel of Fig. 3) shows a similar distribution to that of the dust emis-
sion, while the synchrotron luminosity (right panel of Fig. 3) shows a different distribution
with a deficiency along the galactic plane and with the peak emission originating from the
galactic center. One interesting difference between the dust and the radio emission maps is
the shape of the halo which, in the dust case has an elliptical shape, while in the radio case
(and especially in the synchrotron component) has a more complex “peanut”-like shape.
4 Conclusions
In this study we present new millimetre NIKA2 observations of the edge-on galaxy NGC 891
at 1.15 and 2 mm. Using the NIKA2 observations and also multiwavelength maps (from
the mid-IR to the cm wavelengths) we construct the galaxy’s SED and perform SED fitting
analysis using the HerBIE SED fitting code. The observations indicate a morphology similar
to that of the cold dust (detected at sub-mm) and of the molecular gas with the emission
peaking at the nucleus of the galaxy and with two secondary maxima at ∼ 3 kpc either side
of the center. Emission at the NIKA2 bands is dominated by thermal dust, while the radio
5EPJ Web of Conferences 257, 00023 (2022) https://doi.org/10.1051/epjconf/202225700023
mm Universe @ NIKA2
emission becomes almost equally significant to the thermal emission at ∼ 3 mm. At longer
wavelengths the radio emission dominates with synchrotron emission reaching up to ∼ 84%
at 2 cm. On local scales our analysis shows that the bulk of the dust thermal emission and
the free-free emission comes from the disc of the galaxy while there is a deficiency, of the
synchrotron emission, along the major axis of the disc of the galaxy.
Acknowledgements
We would like to thank the IRAM staff for their support during the campaigns. The NIKA2
dilution cryostat has been designed and built at the Institut Néel. In particular, we acknowl-
edge the crucial contribution of the Cryogenics Group, and in particular Gregory Garde,
Henri Rodenas, Jean Paul Leggeri, Philippe Camus. This work has been partially funded by
the Foundation Nanoscience Grenoble and the LabEx FOCUS ANR-11-LABX-0013. This
work is supported by the French National Research Agency under the contracts "MKIDS",
"NIKA" and ANR-15-CE31-0017 and in the framework of the "Investissements d’avenir"
program (ANR-15-IDEX-02). This work has benefited from the support of the European Re-
search Council Advanced Grant ORISTARS under the European Union’s Seventh Framework
Programme (Grant Agreement no. 291294). F.R. acknowledges financial supports provided
by NASA through SAO Award Number SV2-82023 issued by the Chandra X-Ray Obser-
vatory Center, which is operated by the Smithsonian Astrophysical Observatory for and on
behalf of NASA under contract NAS8-03060. This work was supported by the Programme
National "Physique et Chimie du Milieu Interstellaire" (PCMI) of CNRS/INSU with INC/INP
co-funded by CEA and CNES.
References
[1] L. Perotto, N. Ponthieu, J.-F. Macías-Pérez, et al., Astron. Astrophys. 637, A71 (2020)
[2] R. Adam et al., Astron. Astrophys. 609, A115 (2018)
[3] M. Calvo et al., Journal of Low Temperature Physics, 184, 816 (2016)
[4] O. Bourrion et al., Journal of Instrumentation, 11, 11001 (2016)
[5] I.S. Konstantopoulos et al., Astrophys. J. 145, 137 (2013)
[6] D.K. Strickland et al., Astrophys. J. 608, 829 (2004)
[7] E.M. Xilouris, Y.I. Byun, N.D. Kylafis et al., Astron. Astrophys. 344, 868 (1999)
[8] T.M. Hughes, M. Baes, J. Fritz, et al., Astron. Astrophys. 565, A4 (2014)
[9] D.D. Mulcahy, A. Horneffer, R. Beck, et al., Astron. Astrophys. 615, A98 (2018)
[10] J.H. Yoon, C.L. Martin, S. Veilleux, et al., Mon. Not. Roy. Astron. Soc. 502, 969 (2021)
[11] R. Zylka, MOPSIC: Extended Version of MOPSI (2013)
[12] S. Bianchi & E.M. Xilouris, Astron. Astrophys. 531, L11 (2011)
[13] N.Z. Scoville, D. Thakkar, J.E. Carlstrom & A.I. Sargent, Astrophys. J. 404, L59 (1993)
[14] S. Garcia-Burillo, M. Guelin, J. Cernicharo et al., Astron. Astrophys. 266, 21 (1992)
[15] P.B. Alton, S. Bianchi, R.J. Rand, et al., Astrophys. J. 507, L125 (1998)
[16] E. Drabek, J. Hatchell, p. Friberg, et al., Mon. Not. Roy. Astron. Soc. 472, 23 (2012)
[17] T. Oosterloo, F. Fraternali, & R. Sancisi, Astrophys. J. 134, 1019 (2007)
[18] F. Galliano, Mon. Not. Roy. Astron. Soc. 476, 1445 (2018)
[19] F. Galliano, A. Nersesian, S. Bianchi, et al., Astron. Astrophys. 649, A18 (2021)
[20] A.P. Jones, Astron. Astrophys. 555, A39 (2013)
[21] A.P. Jones, M. Köhler, N. Ysard et al., Astron. Astrophys. 602, A46 (2017)
6You can also read