Experimental Evaluation of Deep Learning Methods for an Intelligent Pathological Voice Detection System Using the Saarbruecken Voice Database - MDPI
←
→
Page content transcription
If your browser does not render page correctly, please read the page content below
applied
              sciences
Article
Experimental Evaluation of Deep Learning Methods for an
Intelligent Pathological Voice Detection System Using the
Saarbruecken Voice Database
Ji-Yeoun Lee

                                          Department of Biomedical Engineering, Jungwon University, 85 Munmu-ro, Goesan-eup, Goesan-gun 28024,
                                          Chungbuk-do, Korea; jylee@jwu.ac.kr; Tel.: +82-43-830-8607

                                          Abstract: This work is focused on deep learning methods, such as feedforward neural network (FNN)
                                          and convolutional neural network (CNN), for pathological voice detection using mel-frequency cep-
                                          stral coefficients (MFCCs), linear prediction cepstrum coefficients (LPCCs), and higher-order statistics
                                          (HOSs) parameters. In total, 518 voice data samples were obtained from the publicly available
                                          Saarbruecken voice database (SVD), comprising recordings of 259 healthy and 259 pathological
                                          women and men, respectively, and using /a/, /i/, and /u/ vowels at normal pitch. Significant
                                          differences were observed between the normal and the pathological voice signals for normalized
                                          skewness (p = 0.000) and kurtosis (p = 0.000), except for normalized kurtosis (p = 0.051) that was
                                          estimated in the /u/ samples in women. These parameters are useful and meaningful for classifying
                                          pathological voice signals. The highest accuracy, 82.69%, was achieved by the CNN classifier with
                                          the LPCCs parameter in the /u/ vowel in men. The second-best performance, 80.77%, was obtained

                                   with a combination of the FNN classifier, MFCCs, and HOSs for the /i/ vowel samples in women.
Citation: Lee, J.-Y. Experimental
                                          There was merit in combining the acoustic measures with HOS parameters for better characterization
Evaluation of Deep Learning               in terms of accuracy. The combination of various parameters and deep learning methods was also
Methods for an Intelligent                useful for distinguishing normal from pathological voices.
Pathological Voice Detection System
Using the Saarbruecken Voice              Keywords: pathological voice detection; feedforward neural network; convolution neural network;
Database. Appl. Sci. 2021, 11, 7149.      deep learning; higher-order statistics
https://doi.org/10.3390/
app11157149

Academic Editor: Anton Civit              1. Introduction
                                               The automatic detection of speech disabilities has attracted significant clinical and
Received: 8 July 2021
                                          academic attention, with the hope of accurately diagnosing speech impairments before
Accepted: 28 July 2021
Published: 2 August 2021
                                          they are identified by well-trained experts and expensive equipment. Although many
                                          researchers focus on acoustic analysis, parametric and nonparametric feature extraction,
Publisher’s Note: MDPI stays neutral
                                          and the automatic detection of speech pathology using pattern recognition algorithms
with regard to jurisdictional claims in
                                          and statistical methods [1–4], pathological voice detection studies using deep learning
published maps and institutional affil-   techniques have been actively published recently. Especially, artificial machine learning
iations.                                  techniques are used to do an excellent job of classification in various areas. Recently, many
                                          machine learning algorithms, such as random forest (RF), gradient boosting, support vector
                                          machines (SVM), k-nearest neighbors (kNN), and artificial neural networks (ANNs), have
                                          been adopted to identify various signals [5–7].
                                               Pathological voices represent health-related problems. Some diseases include speech
Copyright: © 2021 by the author.
Licensee MDPI, Basel, Switzerland.
                                          impairment as an early symptom. This is usually caused by damage to the nervous system
This article is an open access article
                                          or damage to parts of the vocal tract, such as the vocal cords [8]. Speech disorders often lead
distributed under the terms and
                                          to secondary symptoms, and many high-risk diseases can be found in their early stages
conditions of the Creative Commons        through pathological voice analysis [9,10]. In particular, speech disorders are sometimes
Attribution (CC BY) license (https://     indicative of early-stage Parkinson’s disease; thus, early detection through screening can
creativecommons.org/licenses/by/          lead to early treatment and can improve treatment results. However, it is not easy for
4.0/).                                    speech experts to analyze and evaluate speech, even at the early stage of a voice disorder.

Appl. Sci. 2021, 11, 7149. https://doi.org/10.3390/app11157149                                            https://www.mdpi.com/journal/applsci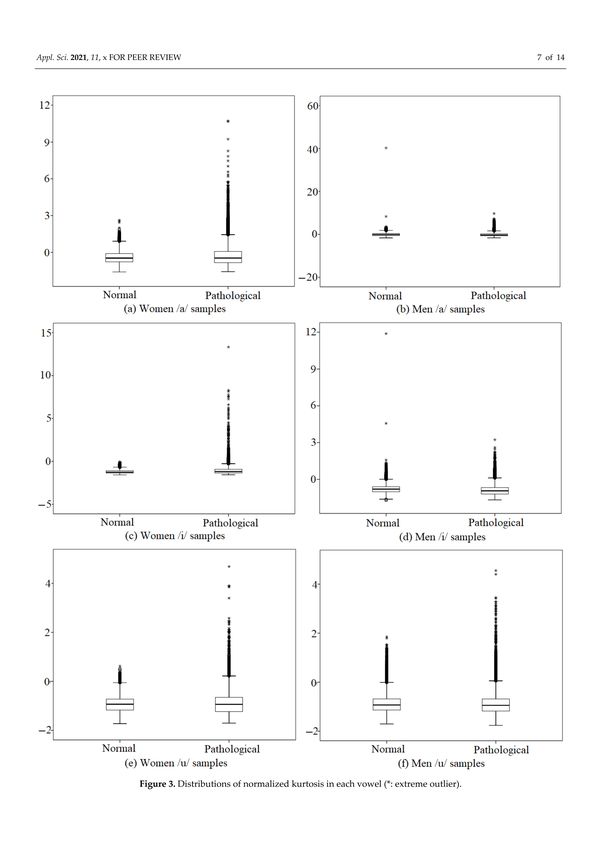
Appl. Sci. 2021, 11, 7149                                                                                          2 of 14

                            Usually, a trained professional is needed, and this individual must undergo training in voice
                            evaluation to accurately evaluate speech. Therefore, automatic pathological voice detection
                            enables efficient speech evaluation in terms of time and cost, resulting in more speech
                            impairment screening. The main motivation for realizing this work is the use of artificial
                            intelligence to diagnose various diseases. This can lead to significant improvements in
                            diagnosis and healthcare, as well as further improvements in human life [11,12].
                                  The ultimate goal of this research is to develop an intelligent pathological voice
                            detection system that supports an accurate and objective diagnosis. This work is focused
                            on deep learning methods, such as feedforward neural network (FNN) and convolutional
                            neural network (CNN), for the detection of pathological speech using mel-frequency
                            cepstral coefficients (MFCCs) and linear prediction cepstrum coefficients (LPCCs), as well
                            as higher-order statistics (HOSs) parameters. Voice data were obtained from the publicly
                            available Saarbrucken voice database (SVD). The author exported 518 samples from the
                            SVD, comprising 259 healthy and 259 pathological female recordings of the /a/, /i/,
                            and /u/ vowels at normal pitch. Additionally, 259 healthy and 259 pathological male
                            recordings of the same vowels at normal pitch are used in this work. Normalized kurtosis
                            and skewness are shown in the form of box plots to provide better visualizations of the
                            normal and pathological voice signals for men and women in each /a/, /i/, and /u/
                            vowel. Finally, this work investigates voice performance using deep learning methods with
                            various combinations of parameters. Therefore, the originality of this work can be found in
                            its proposal of a new parameter and a novel deep learning method that combines HOSs,
                            MFCCs, and LPCCs in the /a/, /i/, and /u/ voice signals of healthy and pathological
                            individuals. The contribution of this paper can be summarized in the following points:
                            •    This paper intruduces an intelligent pathological voice detection system that supports
                                 an accurate and objective diagnosis based on deep learning and the parameters
                                 introduced.
                            •    The suggested combinations of various parameters and deep learning methods can
                                 effectively distinguish normal from pathological voices.
                            •    A lot of experimental tests are performed to confirm the effectiveness of the pathologi-
                                 cal voice detection system using the Saarbruecken voice database.
                            •    The experimental results emphasize the superiority of the proposed pathological voice
                                 detection system integrating machine learning methods and various parameters to
                                 monitor and diagnose a pathological voice for an effective and reliable system.

                            2. Related Work
                                  As a field of study, pathological voice signal processing has always aimed to create
                            objective and accurate classifications of voice disorders. Additionally, there have been many
                            contributions that focus on various aspects of speech processing from feature extractions to
                            decision support systems based on deep learning methods [13–19]. This section provides a
                            brief overview of several recent findings related to the research topic of this paper.
                                  Dankovicová et al. focused on feature selection (FS) and machine learning methods,
                            such as K-nearest neighbors (KNN), random forests (RF), and support vector machines
                            (SVM). The sustained vowels /a/, /i/, and /u/ generated by normal, high, low, and low-
                            high-low were used. These vowels were selected from the Saarbrucken voice database, and
                            94 pathological subjects and 100 healthy subjects were chosen. The SVM classifier achieved
                            the highest accuracy by reducing the feature set to 300 using the filter FS method in the
                            original 1560 feature. The overall classification performance based on feature selection was
                            the highest, with 80.3% for mixed samples, 80.6% for female samples, and 86.2% for male
                            samples [13].
                                  A study by Mohammed et al. focused on transfer learning strategies, such as an
                            effective pre-trained ResNet34 model for CNN training. Due to the unequal distribution
                            of samples, this model adjusted the weights of the samples used for the minority groups
                            during training as a means of compensation. A three-part weight product is the weight of
                            the final sample. A class weight (α), a gender weight (β), as well as a gender–age weight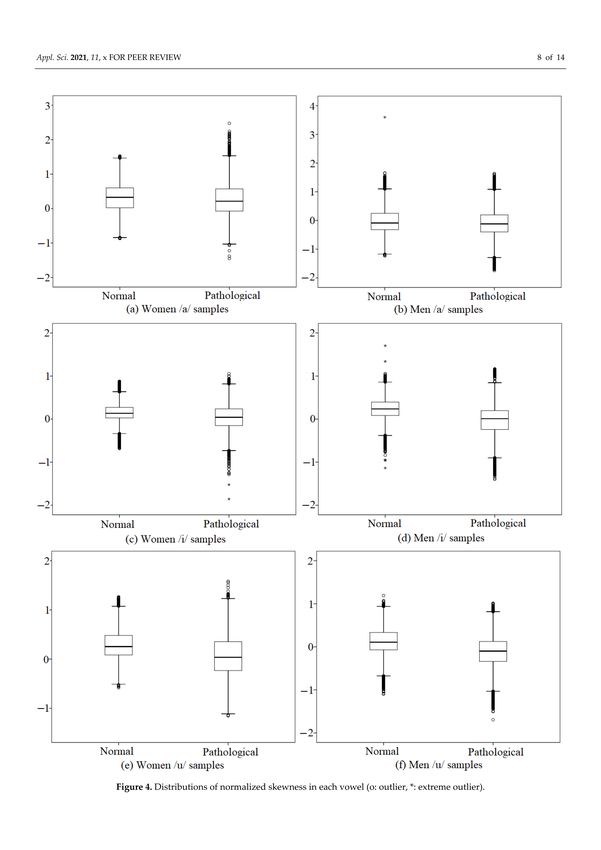
Appl. Sci. 2021, 11, 7149                                                                                           3 of 14

                            (γ), each led to a final sample weight (ω) that was calculated as ω = α·β·γ. The 300 training
                            samples extracted in the SVD were divided equally into 150 healthy and 150 pathological
                            classes to ensure a balanced training process. An additional 1074 tested samples, divided
                            into 200 healthy and 874 pathological classes, were included in the study. The system
                            achieved a high prediction accuracy result of up to 94.54% accuracy on the training data
                            and 95.41% accuracy on the testing data [17].
                                  Hedge et al. presented surveys of research works conducted on the automatic detec-
                            tion of voice disorders and explored ways to identify different types of voice disorders.
                            They also analyzed different databases, feature extraction techniques, and machine learning
                            approaches used in various studies. The voices were generally categorized as normal and
                            pathological in most of the papers; however, some studies included Alzheimer’s disease
                            and Parkinson’s disease (PD). Finally, this paper reviewed the performance of some of the
                            significant research work conducted in this area [18].
                                  A study by Hemmerling et al. sought to evaluate the usefulness of various speech
                            signal analysis methods in the detection of voice pathologies. First, the initial vector
                            consisted of 28 parameters extracted from the sustained vowels /a/, /i/, and /u/ at high,
                            low, and normal pitch in time, frequency, and cepstral domains. Subsequently, linear
                            feature extraction techniques (principal component analysis) were used to reduce the
                            number of parameters and select the most effective acoustic features describing speech
                            signals. They also performed nonlinear data transformations that were calculated using
                            kernel principal components. The initial and extracted feature vectors were classified using
                            k-means clustering and random forest classifiers. Using random forest classification for
                            female and male recordings, they obtained accuracies of up to 100% for the classification of
                            healthy versus pathological voices [14].
                                  Other authors have also investigated the theoretical aspects of voice disorders, feature
                            extraction techniques, and machine learning (ML) techniques, and they have also reviewed
                            the performance of some of the significant research performed in the field of pathological
                            voice signal processing [20–23].

                            3. Materials and Methods
                            3.1. Database
                                 Voice samples of sustained vowels /a/, /i/, and /u/ were digitally recorded and
                            published online in the SVD, created by the Institute of Phonetics of the University of
                            Saarland [24]. The SVD consists of voices recorded by more than 2000 people. The patient’s
                            voices were recorded for vowels /a/, /i/, and /u/ at high, low, low-high, and normal
                            pitches, respectively. The pitches are described and can be allocated into four categories.
                            The length of the recordings ranges from 1 to 4 s. The audio format is a waveform (16-
                            bit sample), sampled at 50 kHz. The entire database contains recordings of 71 different
                            and well-defined voice pathologies and healthy patients. This paper used 259 healthy
                            and 259 pathological female recordings of the /a/, /i/, and /u/vowels at normal pitch
                            (97 suffered from hyperfunctional dysphonia, 51 had functional dysphonia, 30 suffered
                            from laryngitis, and 81 suffered from other pathologies listed in the database [24]) and
                            259 healthy and 259 pathological male recordings of the same vowels at normal pitch
                            (62 men suffered from laryngitis, 44 had hyperfunctional dysphonia, 25 suffered from
                            a vocal fold polyp, and 128 suffered from other pathologies listed in the database [24]).
                            The details are described in Table 1. Due to the essential differences in voice behavior
                            between men and women, the parameters were statistically analyzed for men and women
                            separately.
Appl. Sci. 2021, 11, 7149 4 of 14
Table 1. Details of the voice samples used in the study.
Number of Samples
Diagnosis of Pathological Voices
Female Male
Hyperfunctional dysphonia 97 44
Functional dysphonia 51 33
Laryngitis 30 62
Vocal fold polyp 19 25
Leukoplakia 14 27
Vocal fold cancer 1 21
Vocal nodule 13 4
Reinke edema 27 7
Hypofunctional dysphonia 4 10
Granuloma 1 1
GERD 0 3
Contact ulcers 2 22
Subtotal 259 259
Healthy voices 259 259
Total 518 518
3.2. Feature Extraction
Classical parameters, such as MFCCs and LPCCs, are used in this study. MFCCs are
standard methods for feature extraction that exploit the knowledge of human hearing
systems [1]. The first step of linear predictive (LP) analysis is to estimate a source signal
using inverse filtering. After that, the spectrum is computed using the source signal.
The computed spectrum is used to study the energy distribution in both normal and
pathological voices. The number of LP coefficients is one of the key elements of LP analysis
to determine the formant peaks. This is because removing the effect of the formants from
the speech signal can provide an accurate estimation of the source signal [25]. In this work,
20-dimensional MFCCs and LPCCs were extracted from a 40-ms window signal using a
20-ms frameshift.
To identify speech impairments, this work used a novel set of HOS parameters ex-
tracted from the time domain. A primary advantage of this method is that periodic or
quasi-periodic signals are not required for reliable analysis [1–3,26]. HOS parameters
obtained from time domains provide promising results in this field [1–3]. Inspired by the
above three studies, this work aims to extract HOS parameters from the time domain to
detect and classify speech impairments. Among the various HOSs, the 3rd- and 4th-order
cumulants are used as characteristic parameters in this study. These parameters are called
normalized skewness, γ3 , and normalized kurtosis, γ4 , and are defined as shown in (1).
3 4
∑N
n = 1 ( xn − µ ) ∑N (xn − µ)
γ3 = 3
, γ4 = n=1 (1)
(N − 1)σ (N − 1)σ4
where xn is the n-th sample value, N is the number of samples, and µ and σ represents the
mean and the standard deviations, respectively.
3.3. Deep Learning Methods
As shown in Figure 1a,b, information only moves in one direction in FNN. This
requires moving forward from the input node through the hidden node to the output
node. There are no cycles or loops in the network. Figure 1a shows an example of a
fully connected feedforward neural network with two hidden layers. “Fully connected”
means that each node is connected to all nodes in the next hierarchy. This work addresses
the binary classification problem of normal and pathological speech classification using
FNN. In machine learning, classification is a supervised learning method that divides data
samples into predefined groups using decision-making features [27]. This study uses two
feed-forward layers. After the first layer, there is rectified linear unit (ReLU) activation and,Appl. Sci. 2021, 11, 7149 5 of 14
after the last layer, softmax activation occurs, as shown in Figure 1b [28]. The parameter
values used are shown in Table 2.
Figure 1. FNN architectures. (a) FNN with two hidden layers [27]; (b) FNN with two hidden layers in detail [28].
Table 2. Parameters of the FNN.
Parameter Value
Loss function Tanh
Optimization algorithm SGD + Momentum
Regularization L2
Mismatch propagation BPTT
Minibatch size 100 samples
Learning rate 0.01 exponential attenuation
Loss function Cross-entropy
Weights for samples Yes
CNN is similar to a typical neural network, as shown in Figure 2. It consists of neurons
with learnable weights and biases. Each neuron receives some inputs, performs a dot
product, and optionally follows it with a non-linearity. The entire network represents one
differentiable score function, i.e., from the raw image pixels at one end to the class scores at
the other end. Finally, there are activation functions, such as softmax, in the fully connected
layer [28,29]. This work used two convolutional layers and two feed-forward layers.
Dropout with a probability of 0.05 and batch normalization was applied to all layers except
the feed-forward layers. Max-pooling and average-pooling operations were performed
between the convolutional layers to downsample the intermediate representations over
time, and to add some time invariance into the process. The details are provided in Table 3.Appl. Sci. 2021, 11, 7149 6 of 14
Figure 2. CNN structure [29].
Table 3. Parameters of the CNN.
Parameter Value
Activation function ReLU
Kernel size (2,2)
Optimizer Adam
Epoch 100
Loss function Cross-entropy
Dropout 0.05
Pooling window Max pooling (2,2)
Neurons at dense layer 512
4. Experimental Results and Discussion
Figure 3 shows normalized kurtosis in the form of box plots to better visualize the
normal and pathological voice signals for men and women at each /a/, /i/, and /u/
vowel. Overall, normalized kurtosis estimated in pathological signals tends to be larger
and more widely distributed than that estimated from normal speech signals. As shown
in Figure 3a,b, the normalized kurtosis extracted from the women’s /a/ vowel tended to
be distributed below zero, while the one from the men’s /a/ vowel tended to be close to
zero. In the /i/ samples shown in Figure 3c,d, both the women and men’s /i/ samples
tended to have values less than zero, but the men’s /i/ samples tended to have slightly
smaller negative values. For both women and men’s /u/ samples, shown in Figure 3e,f,
the distributions of the four plots are less than zero, and they are almost identical in shape.
Figure 4 shows the distributions of normalized skewness extracted from normal and
pathological voice signals for men and women in each /a/, /i/, and /u/ vowel. The
normalized skewness extracted from a pathological voice has a smaller average value than
that extracted from a normal voice, as well as a wider range. The normalized skewness
estimated from the women’s /a/ samples in Figure 4a,b has a positive mean for both
pathological and normal voices, while that estimated from the men’s /a/ samples has
a negative mean value distribution for both. For Figure 4c, the normalized skewness
analyzed in both normal and pathological /i/ samples tended to have a positive mean on
both sides. However, it can be seen that the average of the normalized skewness estimated
in the normal voice has a positive value, while that of the pathological voice has a negative
average value, as shown in Figure 4d. In both Figure 4e,f, the normalized skewness of the
normal /u/ voices tends to have a positive mean, while that of pathological /u/ voices
tends to have a negative mean.Appl. Sci. 2021, 11, 7149 7 of 14
Figure 3. Distributions of normalized kurtosis in each vowel (*: extreme outlier).Appl. Sci. 2021, 11, 7149 8 of 14
Figure 4. Distributions of normalized skewness in each vowel (o: outlier, *: extreme outlier).Appl. Sci. 2021, 11, 7149 9 of 14
Table 4 shows that the statistical analyses between normal and pathological voice
signals for women and men were performed using a Mann–Whitney’s U test for inde-
pendent samples. Information on the means, minimums, maximums, percentiles, and
p values are presented. The significance level was set at a priority of p < 0.05. In Table 4, an
asterisk (*) indicates that the p value is less than 0.05. This means that some parameters are
statistically different between normal and pathological voice signals. The Mann–Whitney
U test showed a significant difference between normal and pathological voice signals for
normalized skewness (p = 0.000) and kurtosis (p = 0.000) for both women and men, except
for women’s /u/ samples in the case of the normalized kurtosis (p = 0.051). It is clear that
these methods are useful and meaningful for classifying pathological voice signals.
Table 4. HOS values in each vowel between women and men.
Women Men
Normal Pathological Normal Pathological
/a/
Mean −0.39 −0.28 −0.00 −0.09
Minimum value −1.59 −1.57 −1.62 −1.59
Maximum value 2.63 10.72 40.27 9.70
Normalized kurtosis Percentile 25 −0.77 −0.84 −0.58 −0.66
50 −0.47 −0.46 −0.10 −0.28
75 −0.10 0.08 0.40 0.27
p-value 0.000 * 0.000 *
Mean 0.33 0.26 −0.01 −0.08
Minimum value −0.87 −1.44 −1.23 −1.75
Maximum value 1.53 2.48 3.60 1.64
Normalized skewness Percentile 25 0.02 −0.07 −0.32 −0.40
50 0.33 0.21 −0.09 −0.12
75 0.60 0.57 0.25 0.19
p value 0.000 * 0.000 *
/i/
Mean −1.19 −1.07 −0.78 −0.90
Minimum value −1.57 −1.56 −1.70 −1.67
Maximum value −0.06 13.32 11.88 3.23
Normalized kurtosis Percentile 25 −1.36 −1.35 −1.01 −1.20
50 −1.26 −1.18 −0.79 −0.93
75 −1.08 −0.91 −0.60 −0.67
p-value 0.000 * 0.000 *
Mean 0.15 0.04 0.23 −0.03
Minimum value −0.69 −1.86 −1.13 −1.40
Maximum value 0.88 1.05 1.70 1.17
Normalized skewness Percentile 25 0.03 −0.15 0.08 −0.24
50 0.13 0.04 0.24 0.01
75 0.27 0.23 0.40 0.20
p-value 0.000 * 0.000 *
/u/
Mean −0.94 −0.90 −0.89 −0.89
Minimum value −1.72 −1.70 −1.70 −1.76
Maximum value 0.62 4.68 1.85 4.55
Normalized kurtosis Percentile 25 −1.17 −1.23 −1.13 −1.17
50 −0.93 −0.94 −0.93 −0.95
75 −0.72 −0.65 −0.68 −0.68
p-value 0.051 0.000 *Appl. Sci. 2021, 11, 7149 10 of 14
Table 4. Cont.
Women Men
Normal Pathological Normal Pathological
Mean 0.28 0.06 0.13 −0.12
Minimum value −0.58 −1.15 −1.10 −1.69
Maximum value 1.27 1.58 1.19 1.01
Normalized skewness Percentile 25 0.08 −0.23 −0.07 −0.34
50 0.25 0.04 0.11 −0.10
75 0.48 0.35 0.33 0.12
p-value 0.000 * 0.000 *
Note: * p < 0.05.
The input of the FNN and CNN consists of various parameters, such as MFCCs,
MFCCs + HOSs, LPCCs, LPCCs + HOSs, and the output of the FNN and CNN is coded
to be zero if it is found to be a pathological voice, and if it is found to be a normal
voice, it should be marked as 1. In Table 5, the first and second parameters consisting of
20-dimensional MFCCs and LPCCs were extracted from the window signals of 40 millisec-
onds using a frameshift of 20 milliseconds. The same settings have been applied in many
previous studies [30]. The following parameter, MFCCs + HOSs, was created by adding
two parameters to the 20-dimensional MFCCs; thus, it had 22 dimensions. The LPCCs +
HOSs parameter also has the same dimensions as MFCCs + HOSs. Finally, the MFCCs +
MFCC deltas + HOSs parameters consist of 20-dimensional MFCCs, 20-dimensional MFCC
deltas, and skewness and kurtosis with 42 dimensions. Therefore, the total dimensions
range from 20 to 42. All voice data were grouped into sets of training (70% of the data)
and testing (30%) to implement all methods. As shown in Table 1, in the mixed data of
men and women, 363 were used for the training datasets and 155 were used for the testing
datasets. In addition, in each data sample of the men or women, 181 were used for the
training dataset and 78 were used for the test dataset. Each set was randomly selected from
the subset for a fivefold cross-validation scheme [1–4]. The whole process was repeated
10 times, and the results were averaged. The results are shown as the means and standard
deviations. In Table 5, each column shows the highest values (thick and blue font) obtained
within each type of testing parameter, classifier, and sex. Many thick and red values in
the rows show the highest results according to various parameters among all women and
men. The results of the individual classifiers were also compared by evaluating those of
each vowel separately. The best performance results among the vowels are highlighted in
thickness in each column and row in Table 5. The accuracy of a model is usually determined
after the model parameters are learned and fixed and the learning is not performed. In
this paper, the test samples were fed to the model and the number of mistakes that the
model made were recorded, after comparison to the actual targets. Then, the percentage of
misclassification was calculated. For example, if the number of test samples was 155 and
the model classified 130 of those correctly, then the model’s accuracy was 83.9%. In this
paper, the accuracy will be shown through a confusion matrix.
For the FNN classifier in Table 5, a combination of MFCCs and MFCC deltas showed
the best performance, 80.13%, for classifying pathological and normal voices in the men’s
vowel /a/. The average accuracy, 76.92%, was also used with the MFCCs + HOSs parame-
ter in mixed data samples of women and men. In addition, the average performance was
76.28% for the women’s data samples regarding the MFCCs + MFCC deltas parameter.
The vowel /i/ achieved the greatest accuracy, 80.77%, in the classification between patho-
logical and normal voices using a combination of MFCCs and HOSs for women’s data
samples. Additionally, in mixed and men data samples, accuracies of 75.64% and 75.00%
were obtained from the MFCCs + MFCC deltas + HOSs and MFCCs + HOSs parameters,
respectively. In the vowel /u/, the highest accuracy, 80.77%, was achieved by utilizing the
LPCCs + HOSs parameter in the case of men’s data samples.Appl. Sci. 2021, 11, 7149 11 of 14
Table 5. Classification results obtained by various parameters and deep learning methods focused on sex and individ-
ual vowels.
FNN
MFCC + delta
Vowel MFCC MFCC + HOS MFCC + delta LPCC LPCC + HOS
+ HOS
Women and men 74.04 ± 1.08 75.00 ± 1.57 72.44 ± 1.26 74.04 ± 1.69 74.68 ± 0.98 76.92 ± 1.36
/a/ Women 73.72 ± 1.63 73.72 ± 1.06 76.28 ± 2.12 74.36 ± 1.42 68.59 ± 2.34 67.95 ± 3.27
Men 72.44 ± 1.38 72.44 ± 1.39 80.13 ± 2.65 74.36 ± 1.93 74.36 ± 1.50 75.64 ± 1.46
Women and men 72.76 ± 1.60 73.08 ± 1.73 71.79 ± 0.91 75.64 ± 1.94 68.27 ± 1.04 73.40 ± 1.07
/i/ Women 79.49 ± 1.79 80.77 ± 2.36 75.00 ± 3.26 76.28 ± 1.93 69.23 ± 1.60 75.00 ± 1.82
Men 71.15 ± 1.89 75.00 ± 2.16 70.51 ± 1.51 74.36 ± 2.03 73.08 ± 1.35 74.36 ± 0.74
Women and men 70.19 ± 1.01 70.51 ± 1.34 68.27 ± 1.44 70.19 ± 1.14 72.12 ± 1.21 73.40 ± 0.83
/u/ Women 72.44 ± 2.32 70.19 ± 1.14 73.08 ± 2.50 75.00 ± 1.49 69.87 ± 2.09 75.00 ± 1.73
Men 73.72 ± 1.81 76.92 ± 1.70 71.79 ± 1.26 73.08 ± 2.01 78.21 ± 1.33 80.77 ± 1.14
CNN
Women and men 76.60 ± 1.30 76.60 ± 1.82 71.15 ± 1.83 70.51 ± 1.23 73.40 ± 1.02 76.28 ± 1.13
/a/ Women 74.36 ± 2.42 72.44 ± 1.70 72.44 ± 1.89 76.28 ± 3.05 66.03 ± 1.99 68.59 ± 1.60
Men 75.64 ± 1.89 75.00 ± 1.60 74.36 ± 1.05 75.00 ± 1.84 72.44 ± 1.25 73.72 ± 1.22
Women and men 69.55 ± 1.13 72.12 ± 1.90 74.68 ± 1.17 75.00 ± 1.67 69.55 ± 1.09 72.12 ± 0.57
/i/ Women 76.92 ± 1.91 75.64 ± 2.18 69.87 ± 2.26 72.44 ± 1.79 69.23 ± 1.80 73.72 ± 0.95
Men 73.08 ± 1.41 73.72 ± 2.00 71.79 ± 2.09 71.15 ± 1.95 69.87 ± 0.96 76.92 ± 1.36
Women and men 69.23 ± 0.83 70.19 ± 1.12 70.19 ± 0.79 70.51 ± 1.30 69.23 ± 0.90 70.83 ± 0.85
/u/ Women 71.15 ± 1.71 71.15 ± 0.97 75.00 ± 1.68 76.92 ± 1.87 67.95 ± 1.17 73.72 ± 1.8
Men 74.36 ± 1.06 75.00 ± 1.28 77.56 ± 1.56 75.64 ± 1.23 82.69 ± 1.42 75.00 ± 1.41
For the CNN classifiers, utilization of the LPCCs parameter was 82.69%, showing
the best performance in classifying pathological and normal voices when using men’s
/u/ vowel. The vowel /a/ achieved good accuracy, 76.60%, regarding the differentiation
between pathological and normal voices, with a combination of MFCCs and HOSs for
mixed data samples. Moreover, 76.28% and 75.64% were also obtained from the MFCCs +
MFCC deltas + HOSs and MFCCs parameters in both women’s and men’s data samples,
respectively. When using the vowel /i/, similar results, 76.92%, were found for women
and men with MFCCs and LPCCs + HOSs, respectively. In mixed data samples of women
and men, an average accuracy, 75.00%, was also obtained from the MFCCs + MFCC deltas
+ HOSs parameters. In the vowel /u/, the highest accuracy, 82.69%, was achieved by the
utilization of the LPCCs parameter for data samples from men. In addition, in mixed and
women data samples, accuracies of 70.83% and 76.92% were achieved by the LPCCs +
HOSs and MFCCs + MFCC deltas + HOSs parameters, respectively.
For voiced /u/ vowels in men, the utilization of the CNN classifiers and LPCC
parameters obtained the highest accuracy, 82.69%, compared to the other vowels, classifiers,
and parameters. For women, the accuracy of each classifier is higher in vowel /i/ than
in other vowels. Another finding is that the fusion of the HOS parameters in a particular
vowel has a positive effect on the overall accuracy of the classification. The best results for
mixed samples were achieved by the CNN classifier, although most of the results were
very similar to those of the FNN classifier.
To further analyze the behavior of the model, the author investigated the confusion
matrix and relationship between the loss and learning rates. Figure 5 shows the relationship
between the loss and learning rates when the highest performance was 82.69%. In this
experiment, the epoch was 100 and the learning rate was 0.001. As the epoch runs from 1
to 100, the learning rate tends to decrease from 0.001 to 0.0081, and the loss value tends
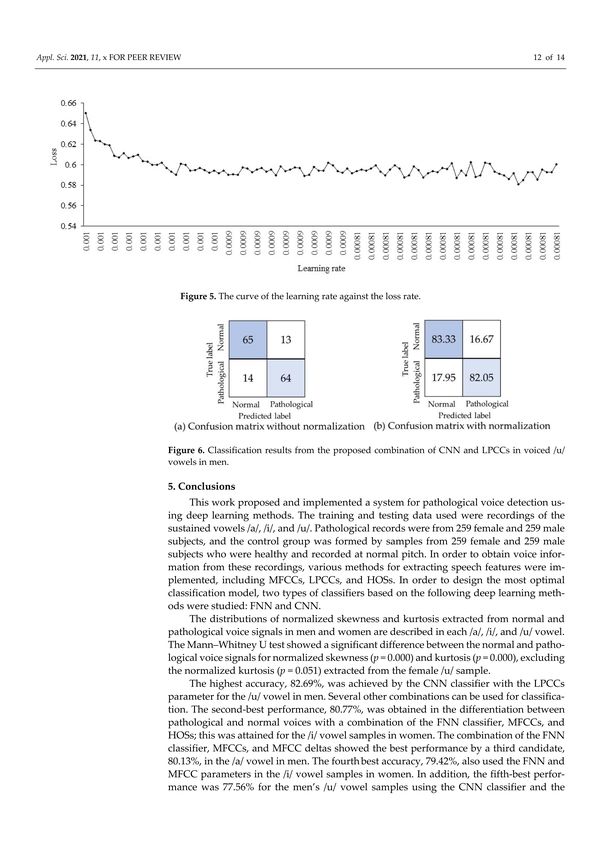
to decrease from 0.66 to 0.58. The classification results represented by the confusion
matrix are described in Figure 6. The confusion matrix of the testing set shows that anAppl. Sci. 2021, 11, 7149 12 of 14
excellent classification accuracy, 82.69%, can be achieved using the proposed CNN and
LPCC combinations.
Figure 5. The curve of the learning rate against the loss rate.
Figure 6. Classification results from the proposed combination of CNN and LPCCs in voiced /u/
vowels in men.
5. Conclusions
This work proposed and implemented a system for pathological voice detection using
deep learning methods. The training and testing data used were recordings of the sustained
vowels /a/, /i/, and /u/. Pathological records were from 259 female and 259 male subjects,
and the control group was formed by samples from 259 female and 259 male subjects who
were healthy and recorded at normal pitch. In order to obtain voice information from these
recordings, various methods for extracting speech features were implemented, including
MFCCs, LPCCs, and HOSs. In order to design the most optimal classification model, two
types of classifiers based on the following deep learning methods were studied: FNN
and CNN.
The distributions of normalized skewness and kurtosis extracted from normal and
pathological voice signals in men and women are described in each /a/, /i/, and /u/
vowel. The Mann–Whitney U test showed a significant difference between the normal and
pathological voice signals for normalized skewness (p = 0.000) and kurtosis (p = 0.000),
excluding the normalized kurtosis (p = 0.051) extracted from the female /u/ sample.
The highest accuracy, 82.69%, was achieved by the CNN classifier with the LPCCs
parameter for the /u/ vowel in men. Several other combinations can be used for classifica-
tion. The second-best performance, 80.77%, was obtained in the differentiation between
pathological and normal voices with a combination of the FNN classifier, MFCCs, and
HOSs; this was attained for the /i/ vowel samples in women. The combination of the FNN
classifier, MFCCs, and MFCC deltas showed the best performance by a third candidate,
80.13%, in the /a/ vowel in men. The fourth best accuracy, 79.42%, also used the FNN
and MFCC parameters in the /i/ vowel samples in women. In addition, the fifth-bestAppl. Sci. 2021, 11, 7149 13 of 14
performance was 77.56% for the men’s /u/ vowel samples using the CNN classifier and
the MFCCs + MFCC deltas parameter. Experimenting with female or male samples with
single data was more effective than experimenting with a mixture of these samples. There
was also merit in combining the acoustic measures with the HOS parameters for better
characterization, as both are useful when it comes to imparting important voice informa-
tion. As the most important discovery of this study, the combination of various parameters
and deep learning methods was useful for distinguishing normal from pathological voices.
In future work, pathological voice detection systems could be developed to classify
the stage of a specific disease and voice quality, and a monitoring function for voice
disorder could also be added. Future research will need to recognize the differences
between two or more diseases and voice quality. Additionally, the author will constantly
study the parameters that reflect important information about pathological voice signals to
realize high classification performance using various deep learning methods and artificial
intelligence (AI) techniques developed in various areas [31–37]. Finally, gender analysis in
the field of pathological voice signal processing needs to become more widespread.
Funding: This work was supported by the National Research Foundation of Korea (NRF) grant
funded by the Korean Government (MSIT) (No. 2017R1A2B4011373). The sponsor had no involve-
ment in the study design; in the collection, analysis, and interpretation of data; in the writing of the
report; or in the decision to submit the article for publication.
Conflicts of Interest: The author declares no conflict of interest.
References
1. Lee, J.-Y.; Jeong, S.; Hahn, M. Pathological Voice Detection Using Efficient Combination of Heterogeneous Features. IEICE Trans.
Inf. Syst. 2008, 91, 367–370. [CrossRef]
2. Lee, J.-Y.; Jeong, S.; Choi, H.-S.; Hahn, M. Objective Pathological Voice Quality Assessment Based on HOS Features. IEICE Trans.
Inf. Syst. 2008, 91, 2888–2891. [CrossRef]
3. Lee, J.Y.; Hahn, M. Automatic Assessment of Pathological Voice Quality Using Higher-Order Statistics in the LPC Residual
Domain. EURASIP J. Adv. Signal Process. 2010, 2009, 1–8. [CrossRef]
4. Wang, X.; Zhang, J.; Yan, Y. Discrimination between Pathological and Normal Voices Using GMM-SVM Approach. J. Voice 2011,
25, 38–43. [CrossRef] [PubMed]
5. Elsisi, M.; Tran, M.-Q.; Mahmoud, K.; Mansour, D.-E.A.; Lehtonen, M.; Darwish, M.M.F. Towards Secured Online Monitoring for
Digitalized GIS against Cyber-Attacks Based on IoT and Machine Learning. IEEE Access 2021, 9, 78415–78427. [CrossRef]
6. Tran, M.-Q.; Liu, M.-K.; Elsisi, M. Effective multi-sensor data fusion for chatter detection in milling process. ISA Trans. 2021, in
press. [CrossRef] [PubMed]
7. Elsisi, M.; Mahmoud, K.; Lehtonen, M.; Darwish, M.M.F. Reliable Industry 4.0 Based on Machine Learning and IoT for Analyzing,
Monitoring, and Securing Smart Meters. Sensors 2021, 21, 487. [CrossRef] [PubMed]
8. Naranjo, L.; Perez, C.J.; Martin, J.; Campos-Roca, Y. A two-stage variable selection and classification approach for Parkin-son’s
disease detection by using voice recording replications. Comput. Methods Prog. Biomed. 2017, 142, 147–156. [CrossRef]
9. Lopez-de-Ipina, K.; Satue-Villar, A.; Faundez-Zanuy, M.; Arreola, V.; Ortega, O.; Clave, P.; Sanz-Cartagena, M.; Mekyska, J.; Calvo,
P. Advances in a multimodal approach for dysphagia analysis based on automatic voice analysis. In Advances in Neural Networks;
Springer International Publishing: Cham, Switzerland, 2016; pp. 201–211, ISBN 978-3-319-33746-3.
10. Gupta, R.; Chaspari, T.; Kim, J.; Kumar, N.; Bone, D.; Narayanan, S. Pathological speech processing: State-of-the-art, current
challenges, and future directions. In Proceedings of the 2016 IEEE International Conference on Acoustics, Speech and Signal
Processing (ICASSP), Shanghai, China, 20–25 March 2016; pp. 6470–6474.
11. Zheng, K.; Padman, R.; Johnson, M.P.; Diamond, H.S. Understanding technology adoption in clinical care: Clinician adop-tion
behavior of a point-of-care reminder system. Int. J. Med. Inform. 2005, 74, 535–543. [CrossRef]
12. Sim, I.; Gorman, P.; Greenes, R.A.; Haynes, R.B.; Kaplan, B.; Lehmann, H.; Tang, P.C. Clinical Decision Support Systems for the
Practice of Evidence-based Medicine. J. Am. Med. Inform. Assoc. 2001, 8, 527–534. [CrossRef]
13. Dankovičová, Z.; Sovák, D.; Drotár, P.; Vokorokos, L. Machine Learning Approach to Dysphonia Detection. Appl. Sci. 2018, 8,
1927. [CrossRef]
14. Hemmerling, D.; Skalski, A.; Gajda, J. Voice data mining for laryngeal pathology assessment. Comput. Biol. Med. 2016, 69, 270–276.
[CrossRef]
15. Hammami, I.; Salhi, L.; Labidi, S. Voice Pathologies Classification and Detection Using EMD-DWT Analysis Based on Higher
Order Statistic Features. IRBM 2020, 41, 161–171. [CrossRef]
16. Minelga, J.; Verikas, A.; Vaiciukynas, E.; Gelzinis, A.; Bacauskiene, M. A Transparent Decision Support Tool in Screening for
Laryngeal Disorders Using Voice and Query Data. Appl. Sci. 2017, 7, 1096. [CrossRef]Appl. Sci. 2021, 11, 7149 14 of 14
17. Mohammed, M.A.; Abdulkareem, K.H.; Mostafa, S.A.; Ghani, M.K.A.; Maashi, M.S.; Garcia-Zapirain, B.; Oleagordia, I.; AlHakami,
H.; Al-Dhief, F.T. Voice Pathology Detection and Classification Using Convolutional Neural Network Model. Appl. Sci. 2020, 10,
3723. [CrossRef]
18. Hegde, S.; Shetty, S.; Rai, S.; Dodderi, T. A Survey on Machine Learning Approaches for Automatic Detection of Voice Disorders.
J. Voice 2019, 33, 947. [CrossRef] [PubMed]
19. Eskidere, Ö.; Gürhanli, A. Voice Disorder Classification Based on Multitaper Mel Frequency Cepstral Coefficients Features.
Comput. Math. Methods Med. 2015, 2015, 1–12. [CrossRef]
20. Lei, Z.; Kennedy, E.; Fasanella, L.; Li-Jessen, N.Y.-K.; Mongeau, L. Discrimination between Modal, Breathy and Pressed Voice for
Single Vowels Using Neck-Surface Vibration Signals. Appl. Sci. 2019, 9, 1505. [CrossRef]
21. Olivares, R.; Munoz, R.; Soto, R.; Crawford, B.; Cárdenas, D.; Ponce, A.; Taramasco, C. An Optimized Brain-Based Algorithm for
Classifying Parkinson’s Disease. Appl. Sci. 2020, 10, 1827. [CrossRef]
22. Silva, B.N.; Khan, M.; Wijesinghe, R.E.; Thelijjagoda, S.; Han, K. Development of Computer-Aided Semi-Automatic Diagnosis
System for Chronic Post-Stroke Aphasia Classification with Temporal and Parietal Lesions: A Pilot Study. Appl. Sci. 2020, 10,
2984. [CrossRef]
23. Hernandez, A.; Kim, S.; Chung, M. Prosody-Based Measures for Automatic Severity Assessment of Dysarthric Speech. Appl. Sci.
2020, 10, 6999. [CrossRef]
24. William, J.B.; Manfred, P. Saarbrucken Voice Database: Institute of Phonetics, University of Saarland. 2007. Available online:
http://www.stimmdatenbank.coli.uni-saarland.de/ (accessed on 13 May 2018).
25. Lee, J.; Choi, H.-J. Deep Learning Approaches for Pathological Voice Detection Using Heterogeneous Parameters. IEICE Trans. Inf.
Syst. 2020, 103, 1920–1923. [CrossRef]
26. Nemer, E.; Goubran, R.; Mahmoud, S. Robust voice activity detection using higher-order statistics in the LPC residual domain.
IEEE Trans. Speech Audio Process. 2001, 9, 217–231. [CrossRef]
27. Moujahid, A. A Practical Introduction to Deep Learning with Caffe and Python. Available online: http://adilmoujahid.com/
posts/2016/06/introduction-deep-learning-python-caffe/ (accessed on 28 June 2021).
28. Ng, R. Feedforward Neural Network with PyTorch. Available online: https://www.deeplearningwizard.com/deep_learning/
practical_pytorch/pytorch_feedforward_neuralnetwork/ (accessed on 25 July 2021).
29. Choe, J.; Lee, J.; Kang, D.; Seo, S. AR based Beverage Information Visualization and Sharing System using Deep Learning. J. Digit.
Contents Soc. 2020, 21, 445–452. [CrossRef]
30. Adam, P.; Sam, G.; Soumith, C.; Gregory, C. Automatic differentiation in PyTorch. In Proceedings of the 31st Conference on
Neural Information Processing Systems (NIPS 2017), Long Beach, CA, USA, 4–9 December 2017.
31. Tavakoli, S.; Hajibagheri, A.; Sukthankar, G. Learning social graph topologies using generative adversarial neural networks. In
Proceedings of the International Conference on Social Computing, Behavioral-Cultural Modeling & Prediction, Washington, DC,
USA, 5–8 July 2017. [CrossRef]
32. Pourjabar, S.; Choi, G.S. CVR: A Continuously Variable Rate LDPC Decoder Using Parity Check Extension for Minimum Latency.
J. Signal Process. Syst. 2020, 1–8. [CrossRef]
33. Roshani, M.; Phan, G.T.; Ali, P.J.M.; Roshani, G.H.; Hanus, R.; Duong, T.; Corniani, E.; Nazemi, E.; Kalmoun, E.M. Evaluation of
flow pattern recognition and void fraction measurement in two phase flow independent of oil pipeline’s scale layer thickness.
Alex. Eng. J. 2021, 60, 1955–1966. [CrossRef]
34. Fathabadi, F.R.; Grantner, J.L.; Shebrain, S.A.; Abdel-Qader, I. Multi-Class Detection of Laparoscopic Instruments for the Intelligent
Box-Trainer System Using Faster R-CNN Architecture. In Proceedings of the 2021 IEEE 19th World Symposium on Applied
Machine Intelligence and Informatics (SAMI), Herl’any, Slovakia, 21–23 January 2021. [CrossRef]
35. Voghoei, S.; Tonekaboni, N.H.; Wallace, J.G.; Arabnia, H.R. Deep learning at the edge. In Proceedings of the 2018 International
Conference on Computational Science and Computational Intelligence (CSCI), Las Vegas, NV, USA, 13–15 December 2018;
pp. 895–901.
36. Nabavi, M.; Nazarpour, V.; Alibak, A.H.; Bagherzadeh, A.; Alizadeh, S.M. Smart tracking of the influence of alumina nanoparticles
on the thermal coefficient of nanosuspensions: Application of LS-SVM methodology. Appl. Nanosci. 2021, 11, 1–16. [CrossRef]
37. Roshani, M.; Sattari, M.A.; Ali, P.J.M.; Roshani, G.H.; Nazemi, B.; Corniani, E.; Nazemi, E. Application of GMDH neural network
technique to improve measuring precision of a simplified photon attenuation based two-phase flowmeter. Flow Meas. Instrum.
2020, 75, 101804. [CrossRef]You can also read