Evidence of seasonal variation of childhood acute lymphoblastic leukemia in Sweden - medRxiv
←
→
Page content transcription
If your browser does not render page correctly, please read the page content below
medRxiv preprint doi: https://doi.org/10.1101/2023.02.12.23285595; this version posted February 12, 2023. The copyright holder for this preprint
      (which was not certified by peer review) is the author/funder, who has granted medRxiv a license to display the preprint in perpetuity.
                                          It is made available under a CC-BY-NC-ND 4.0 International license .

                                              Evidence of seasonal variation of childhood acute
                                              lymphoblastic leukemia in Sweden
                                              Gleb Bychkov1Y , Benedicte Bang1Y , Niklas Engsner1,3 , Mats Heyman4 , Anna Skarin
                                              Nordenvall 1,5 Giorgio Tettamanti1,6 , Emeli Ponten1 , Jan Albert 7,8 Rebecka Jörnsten9 ,
                                              Claes Strannegård1,2‡ , Ann Nordgren 1,10,11,12‡*

                                              1 Department of Molecular Medicine and Surgery, Center for Molecular Medicine,
                                              Karolinska Institutet, Stockholm, Sweden
                                              2 Applied Information Technology, University of Gothenburg, Gothenburg, Sweden
                                              3 Computer Science and Engineering, Chalmers University of Technology, Gothenburg,
                                              Sweden
                                              4 Department of Women’s and Children’s Health, Karolinska Institutet, Stockholm,
                                              Sweden
                                              5 Department of Radiology, Karolinska University Hospital, Stockholm, Sweden
                                              6 Unit of Epidemiology, Institute of Environmental Medicine, Karolinska University
                                              Hospital, Stockholm, Sweden
                                              7 Department of Microbiology, Tumor and Cell Biology, Karolinska Institutet,
                                              Stockholm, Sweden
                                              8Department of Clinical Microbiology, Karolinska University Hospital, Stockholm,
                                              Sweden
                                              9 Mathematical Sciences, University of Gothenburg and Chalmers University of
                                              Technology, Gothenburg, Sweden
                                              10 Clinical Genetics, Karolinska University Hospital, Stockholm, Sweden
                                              11 Department of Clinical Genetics and Genomics, Sahlgrenska University Hospital,
                                              Gothenburg, Sweden
                                              12 Institute of Biomedicine, Department of Laboratory Medicine, University of
                                              Gothenburg, Gothenburg, Sweden

                                              YThese authors contributed equally to this work.
                                              ‡These authors also contributed equally to this work.
                                              * ann.nordgren@ki.se

                                              Abstract
                                              Background Recent molecular studies of B-cell precursor acute lymphoblastic
                                              leukemia (BCP-ALL) have started to delineate the nature and timing of genetic variants
                                              and those responsible for subsequent progression to overt leukemia. However, the
                                              etiology behind both initiation and progression remains largely unknown. Nonetheless,
                                              theories, but also epidemiological evidence, of how exposure to common infections and
                                              other microbes in our environment modulates the risk of developing childhood
                                              BCP-ALL, have emerged. In light of these theories and the well-known phenomena of
                                              seasonality in infectious disease spread, childhood ALL has been analyzed for signs of
                                              seasonal variation, with differing results.
                                                  Methods In this study we applied the Bayesian Generalized Auto Regressive
                                              Integrated Moving Average with external variables (GARIMAX) model, adapted for
                                              count data via a negative binomial distribution, to study seasonal variation of incidence
                                              in a Swedish population-based cohort of 1601 BCP-ALL cases. The studied cases were

February 12, 2023                                                                                                                                    1/39
            NOTE: This preprint reports new research that has not been certified by peer review and should not be used to guide clinical practice.
medRxiv preprint doi: https://doi.org/10.1101/2023.02.12.23285595; this version posted February 12, 2023. The copyright holder for this preprint
      (which was not certified by peer review) is the author/funder, who has granted medRxiv a license to display the preprint in perpetuity.
                                          It is made available under a CC-BY-NC-ND 4.0 International license .

                                            aged 0-18 years at diagnosis and identified from the Swedish Childhood Cancer Registry
                                            (SCCR). Also, two subgroups of BCP-ALL represented by the most abundant genetic
                                            subtypes, ETV6/RUNX1 and HeH respectively, were analyzed accordingly. All analyses
                                            were performed in two stages. The first stage identified the presence of the repeatable
                                            pattern using harmonic functions, and the second stage consisted of the identification of
                                            the peak months in the series.
                                               Results An informative seasonal variation in BCP-ALL incidence numbers,
                                            displaying a peak in August and September, was detected in the total cohort of 1601
                                            individuals. No seasonality was detected analyzing the subtype groups HeH and
                                            ETV6/RUNX1 positive BCP-ALL, respectively.
                                               Conclusion The manifested seasonality in BCP-ALL with a peak in
                                            August-September may suggest that the prolonged period of minimal viral spread
                                            during Swedish summer vacation causes a temporary halt in the last step of progression
                                            to overt disease and consequently an accumulated number of cases presenting in
                                            August-September.
                                               Keywords: acute lymphoblastic leukemia, ALL, seasonal variation

                                            Introduction                                                                                                1

                                            Acute lymphoblastic leukemia (ALL) is the most frequent cancer (25%) in children                            2

                                            below the age of 15 years [1]. ALL is most commonly (85%) of B-cell precursor origin,                       3

                                            termed BCP ALL [2]. To date, 11 distinct molecular subtypes based on recurrent                              4

                                            genetic aberrations have been defined in BCP ALL, displaying highly variable prognosis                      5

                                            and used to guide modern treatment strategies [3]. The most abundant subtypes,                              6

                                            ETV6/RUNX1 fusion and high hyperdiploidy (HeH), also have the most favorable                                7

                                            prognosis [4].                                                                                              8

                                                The annual Swedish ALL incidence rate of 4.2 per 100 000 in children 0-15 years of                      9

                                            age is comparable to numbers in other affluent societies [5]. A significative peak in                       10

                                            incidence is seen at 2-5 years of age [6, 7] mainly comprised by ETV6/RUNX1 positive                        11

                                            and HeH cases [6, 8, 9]. However, markedly lower incidence has been reported especially                     12

                                            from sub-Sharan countries [10] where the early incidence peak is less pronounced or                         13

                                            even non-existing [11].                                                                                     14

                                                The cause of childhood BCP-ALL is yet largely unknown and likely multifactorial,                        15

                                            comprised of both environmental and genetic factors. Mapping the temporal aspects of                        16

                                            disease initiation and progression has been central to our understanding of its etiology.                   17

                                            There is today compelling evidence that BCP-ALL is initiated prenatally. Pre-leukemic                       18

                                            clones have been detected in children who later develop BCP-ALL but also in healthy                         19

                                            controls [12–18]. As many as 1-5% of healthy neonates have been found to harbor a                           20

                                            pre-leukemic clone of ETV6/RUNX1 positive BCP-ALL [19, 20]. However, secondary                              21

                                            genetic aberrations are required for the progression of pre-leukemic clones [21, 22],                       22

                                            explaining why only a fraction of pre-leukemic cell carriers develop overt BCP-ALL.                         23

                                                Although the nature of both initiating and secondary genetic variants in BCP-ALL                        24

                                            have been delineated to some extent, including leukemia predisposing germline variants                      25

                                            in an approximated 4,4% [23], little is known of the environmental drivers behind these                     26

                                            genetic aberrations. To date, ionizing radiation is the only environmental factor                           27

                                            convincingly proven to increase the risk of ALL [24, 25]. However, the role of common                       28

                                            pathogens such as viruses and bacteria has been given great interest in both                                29

                                            epidemiological and molecular studies in recent years.                                                      30

                                                The initiation of pre-leukemic clones by infectious agents has to date not been                         31

                                            molecularly proven. However, recent studies have indeed confirmed that progression to                       32

                                            overt leukemia from a pre-leukemic state may be promoted by a specific pathogen [26],                       33

                                            but also that it requires exposure to common infections [27, 28]. On the more general                       34

February 12, 2023                                                                                                                                2/39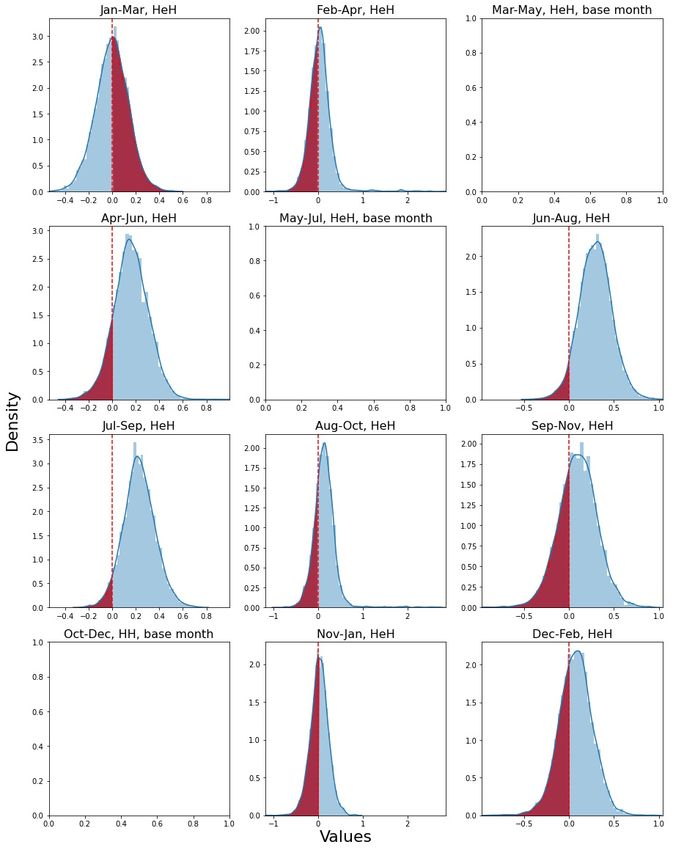
medRxiv preprint doi: https://doi.org/10.1101/2023.02.12.23285595; this version posted February 12, 2023. The copyright holder for this preprint
      (which was not certified by peer review) is the author/funder, who has granted medRxiv a license to display the preprint in perpetuity.
                                          It is made available under a CC-BY-NC-ND 4.0 International license .

                                            level, models for infectious exposures selective pressure on leukemia progression have                      35

                                            been suggested. Originally, in 1988 Kinlen formulated the hypothesis of “population                         36

                                            mixing” after observing an increased incidence of childhood BCP-ALL in                                      37

                                            immunologically naı̈ve previously isolated populations after exposure to a common mild                      38

                                            infectious agents transmitted by individuals from urbanized areas of residence [29–31].                     39

                                            Simultaneously, Greaves suggested a model where delayed exposure to common                                  40

                                            infections during early childhood causes strong adverse reactions of the immune system                      41

                                            once infections are encountered, in turn promoting progression of pre-leukemic cells [32].                  42

                                            As reviewed by Hauer et al [33], more recent data building on these original models                         43

                                            suggests early training of the innate immune system has a protective effect against                         44

                                            BCP-ALL progression. This is based on observations of reduced BCP-ALL risk                                  45

                                            following early animal contact, early daycare attendance, vaginal delivery, breastfeeding,                  46

                                            having older siblings, early BCG vaccination etc. In summary, both what infections we                       47

                                            encounter and when during fetal life and early childhood we encounter them appear to                        48

                                            influence the destiny of pre-leukemic cells initiated as a consequence of in some cases                     49

                                            genetic predisposition and other yet unknown environmental factors.                                         50

                                                One epidemiological aspect studied based on the above hypothesis is seasonal                            51

                                            variation in incidence of BCP-ALL and likewise in BCP-ALL patients’ season of birth.                        52

                                            As the spread of common infections (such as influenza, adeno, corona, rhino and                             53

                                            rs-viruses among others) vary strongly with season in temperate areas of the world, the                     54

                                            hypothesis has been that if such infections impact disease progression a seasonal pattern                   55

                                            in incidence of BCP-ALL, and possible also patients season of birth, may also be seen.                      56

                                            The first to report seasonal variation of acute leukemia incidence were Lampin and                          57

                                            Gerard [34] in 1934. In a literature search we identified 41 papers published from 1961                     58

                                            an onward, investigating seasonal variation in ALL (predominantly in childhood) by a                        59

                                            variety of methods and with inconsistent results (Table 1). 20 publications reported                        60

                                            significant seasonal variation of ALL                                                                       61

                                            incidence [35, 36, 38, 39, 41, 44, 45, 47, 49, 50, 52, 53, 55, 56, 58, 63, 69–72], while 21 papers          62

                                            reported no evidence of seasonality [37, 40, 42, 43, 46, 48, 49, 51, 54, 56, 57, 59–62, 64–68, 73].         63

                                                In the current study we applied Generalized Autoregressive Integrated Moving                            64

                                            Average model with External seasonal covariates (GARIMAX) to a Swedish                                      65

                                            population-based cohort of 1601 childhood BCP-ALL cases to investigate presence of                          66

                                            seasonal variation in incidence of diagnosis. Also, two subgroups of BCP-ALL                                67

                                            represented by the most abundant genetic subtypes, ETV6/RUNX1 and HeH                                       68

                                            respectively, were analyzed for seasonal variation of incidence.                                            69

February 12, 2023                                                                                                                                3/39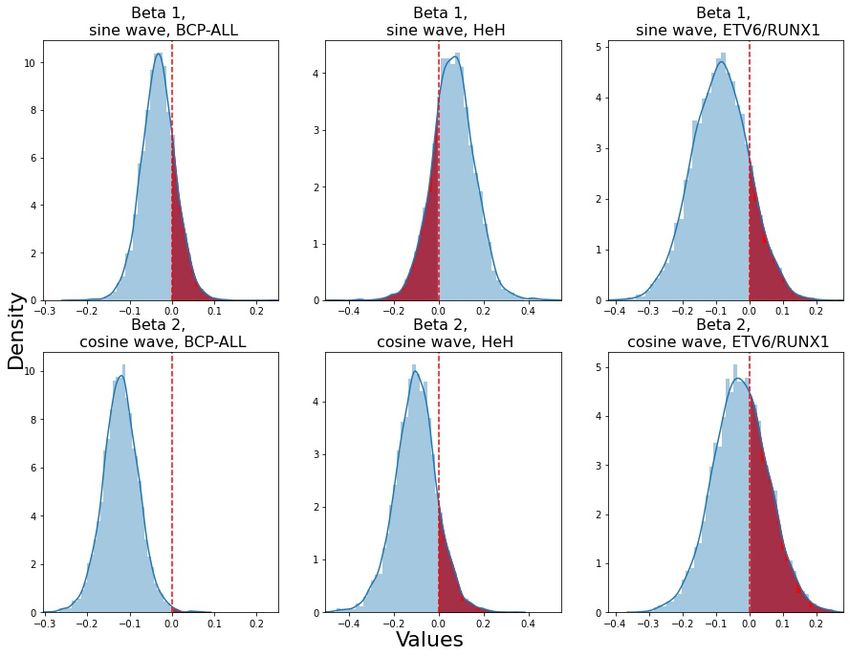
Table 1. Studies of seasonal variation at the date of diagnosis in ALL.
                     Authors       Year* Country**       N***      Years****      Age       Methods                      Seasonality***** Other comments
                     Hassan J. et 2021     Pakistan      513       2006-2015      All ages  Single-factor analysis       Yes (June to Monsoon period, BCP-
                     al [35]                                                                of variance and counts,      September)       and T-cell ALL analyzed
                                                                                            Chi-square test                               together
                     Rahimi Por- 2021      Iran          3769      2006-2014      0-14      Joint point regression       Yes (June to BCP- and T-cell ALL ana-
                     danjani    S.                                                          (regression over aggre-      September)       lyzed together

February 12, 2023
                     al [36]                                                                gated monthly counts)
                     Bamouni S. 2021       France        9493      1990-2014      0-14      Poisson      regression      No                   BCP- and T-cell ALL ana-
                     et al [37]                                                             with harmonic func-                               lyzed together
                                                                                            tions
                     Rahimi Por- 2020      Iran          3769      2006-2014      0-14      Single factor analysis,      Yes (June       to   BCP- and T-cell ALL ana-
                     danjani S. et                                                          temporal trend               September)           lyzed together
                     al [38]
                     Bagirov       2019    Azerbaijan    991       1998-2014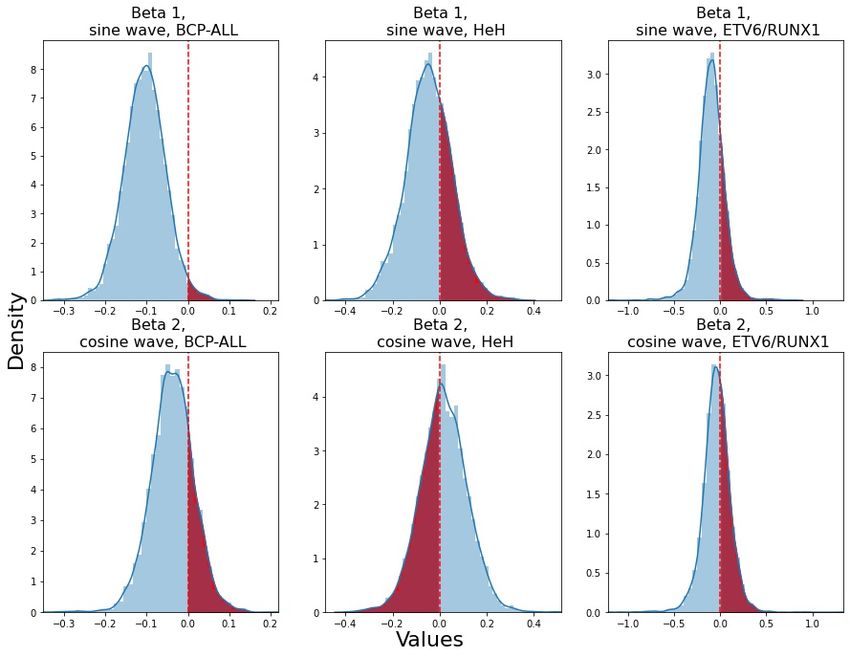
Authors          Year*   Country**    N***   Years****      Age        Methods                  Seasonality***** Other comments
                    Goujon-          2013    France       6686   1990–2007      0-14       Poisson    regression    Yes (April, Aug, the study showed an in-
                    Bellec S. et                                                           with        harmonic     Dec)             crease in childhood ALL
                    al [45]                                                                functions, negative                       risk, which tended to be
                                                                                           binomial regression to                    stronger for 7–14-year-old
                                                                                           account for overdis-                      Bcp-ALL, particularly in
                                                                                           persion                                   girls (peak ?), Seasonal

February 12, 2023
                                                                                                                                     variations in the month
                                                                                                                                     of diagnosis were also ev-
                                                                                                                                     idenced for 1–6-year-old
                                                                                                                                     boys, with a 10% increase
                                                                                                                                     in the risk for all ALL and
                                                                                                                                     Bcp-ALL in April, August
                                                                                                                                     and December
                    Mutlu M. et      2012    Turkey       137    1990-2004      8          Single-factor analysis   No               BCP- and T-cell ALL ana-
                    al [46]                                                     months-    of monthly counts,                        lyzed together
                                                                                16 years   Chi-square test
                    Zeng H.M. et     2011    China        631    Apr    2004-   0-16       Single-factor analysis   Yes (Jan)         Winter, especially January
                    al [47]                                      Apr 2010                  of monthly counts                          was the peak time for both
                                                                                                                                      diagnosis and birth, BCP-
                                                                                                                                      and T-cell ALL analyzed
                                                                                                                                      together
                    Basta N.O.       2010    Northern     743    1968-2005      0-6        Poisson    regression    No                There was significant sinu-
                    et al [48]               England                                       with harmonic func-                        soidal variation based on
                                                                                           tions fitted to 12                         month of birth for acute
                                                                                           month count period,                        lymphoblastic leukaemia
                                                                                           Chi-square test                            (ALL) aged 1-6 years (P
                                                                                                                                      = 0.04; peak in March),
                                                                                                                                      BCP- and T-cell ALL ana-
                                                                                                                                      lyzed together
                    Gao F.      et   2005    Singapore    684    1968-1999      0-19       von Mises distribution   No                BCP- and T-cell ALL ana-
                    al [49]                                                                and the Mardia test                        lyzed together
                    Gao F.      et   2005    The United   6181   1973-1999      0-19       von Mises distribution   No                BCP- and T-cell ALL ana-
                                                                                                                                                                                                           It is made available under a CC-BY-NC-ND 4.0 International license .

                    al [49]                  States                                        and the Mardia test                        lyzed together
                    Gao F.      et   2005    Sweden       63     1977-1994      0-19       von Mises distribution   Yes (Jan)         BCP- and T-cell ALL ana-
                    al [49]                                                                and the Mardia test                        lyzed together
                    Karimi M.   et   2003    Iran         221    Apr    1996-   0-14       Chi-square test and      Yes (Oct, Nov)    BCP- and T-cell ALL ana-
                    al [50]                                      Mar 2000                  normal approximation                       lyzed together
                                                                                           to Poisson for analyz-
                                                                                           ing
                                                                                                                                                                       (which was not certified by peer review) is the author/funder, who has granted medRxiv a license to display the preprint in perpetuity.
                                                                                                                                                                    medRxiv preprint doi: https://doi.org/10.1101/2023.02.12.23285595; this version posted February 12, 2023. The copyright holder for this preprint

5/39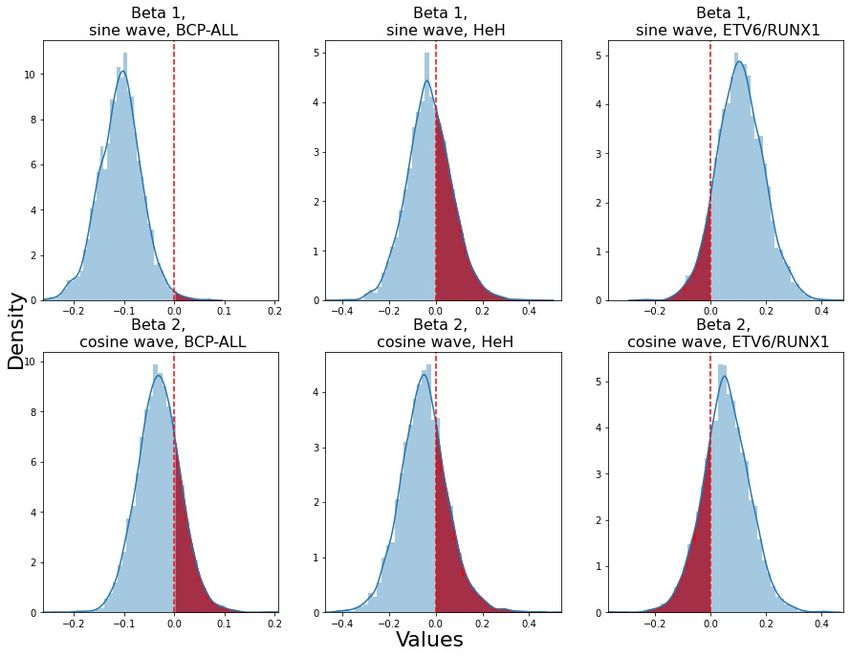
Authors         Year*   Country**         N***     Years****      Age      Methods                  Seasonality***** Other comments
                    Higgins C.D.    2001    The UK            15 835   1972-1986      0-15     Edward’s test            No               BCP- and T-cell ALL ana-
                    et al [51]                                                                                                           lyzed together
                    Sørensen        2001    Denmark           458      1950–1994      0-4      Cosinor analysis         Yes (Oct)        Date of birth, peak month
                    H.T.       et                                                                                                        was April, BCP- and T-cell
                    al [52]                                                                                                              ALL analyzed together
                    Ross J.A. et    1999    USA               5532     Jan 1989-31    0-19     Rodger’s test            Yes (summer)     BCP- and T-cell ALL ana-

February 12, 2023
                    al [53]                                            Dec 1991                                                          lyzed together
                    Douglas S.      1999    England           789      1984-1993      0-14     Cosinor analysis and     No               BCP- and T-cell ALL ana-
                    et [54]                                                                    Normal Approxima-                         lyzed together
                                                                                               tion to the Poisson
                                                                                               Distribution
                    Gilman E.A.     1998    Great             805      1971-1994      0-14     Single-factor analysis   Yes (summer)      data showed a 16% ex-
                    et al [55]              Britain                                            of variance and counts                     cess of cases diagnosed
                                                                                               by season                                  in the summer months in
                                                                                                                                          children, BCP- and T-cell
                                                                                                                                          ALL analyzed together
                    Westerbeek      1998    NW England        1070     Jan 1954-Dec   0-14     Edward’s test            No                BCP- and T-cell ALL ana-
                    R.M.       et                                      1996                                                               lyzed together
                    al [56]
                    Westerbeek      1998    East Anglia,      271      1971-1994      0-14     Edward’s test            Yes (summer)      BCP- and T-cell ALL ana-
                    R.M.       et           UK                                                                                            lyzed together
                    al [56]
                    Thorne R. et    1998    South-west        420      1976-1995      0-14     Single-factor analysis   No                BCP- and T-cell ALL ana-
                    al [57]                 of England                                                                                    lyzed together
                    Badrinath P.    1997    East Anglia,      271      1971-1994      0-14     Single-factor analysis   Yes (summer)      The seasonality was found
                    et al [58]              UK                                                 of variance and counts                     in the whole ALL group,
                                                                                               by season                                  but there is no sugges-
                                                                                                                                          tion of similar seasonality
                                                                                                                                          for any other cell types of
                                                                                                                                          leukaemia
                    Meltzer A.A.    1996    Atlanta,          1487     1973-1986      0-15     Cosinor analysis         No                no evidence of seasonal-
                    et al [59]              Connecti-                                                                                     ity at date of birth found,
                                                                                                                                                                                                               It is made available under a CC-BY-NC-ND 4.0 International license .

                                            cut, Detroit,                                                                                 BCP- and T-cell ALL ana-
                                            Hawaii, Iowa,                                                                                 lyzed together
                                            New Mexico,
                                            Puerto, Rico,
                                            San      Fran-
                                            cisco, Seattle,
                                            and Utah
                    Cohen P. [60]   1987    Israel            205      1976-1981      5.9  ±   Single-factor analysis   No                No seasonal onset of dis-
                                                                                      3.94     of variance and counts                     ease was found, either in
                                                                                                                                                                           (which was not certified by peer review) is the author/funder, who has granted medRxiv a license to display the preprint in perpetuity.

                                                                                      mean                                                the whole group or in sub-
                                                                                      age                                                 groups based on cell type
                                                                                                                                                                        medRxiv preprint doi: https://doi.org/10.1101/2023.02.12.23285595; this version posted February 12, 2023. The copyright holder for this preprint

6/39
Authors Year* Country** N*** Years**** Age Methods Seasonality***** Other comments
van Steensel- 1983 the Nether- 293 1973-80 0-14 Edward’s test No BCP- and T-cell ALL ana-
Moll H.A. et lands lyzed together
al [61]
Walker A.M., 1982 The USA 1783 1969–1977 All ages Single factor analysis No No strong evidence was
van Noord found for seasonality in
P.A. [62] the diagnosis of acute
February 12, 2023
leukemias as a whole or
for subgroups based on cell
type
Zannos- 1975 Greece 151 - 0-14 Single-factor analysis, Yes (winter) BCP- and T-cell ALL ana-
Mariolea L. Chi-squared test lyzed together
et al [63]
Hems G., 1972 Scotland 978 1939–1968 0-15 Single-factor analysis, No BCP- and T-cell ALL ana-
Stuart Chi-square test lyzed together
A. [64]
Gunz F.W., 1968 New Zealand 288 1953-1964 All age Single-factor analysis, No Significant seasonal vari-
Spears G.F. groups Chi-squared test ations in the onset were
[65] found in adults, BCP- and
T-cell ALL analyzed to-
gether
Till M.M. et 1967 Greater Lon- 374 1952-1961 0-9 Single factor analysis No BCP- and T-cell ALL ana-
al [66] don, England lyzed together
Mainwaring 1966 Liverpool 74 1955-64 0-14 Single-factor analysis No Younger age group more
D. [67] common in summer, BCP-
and T-cell ALL analyzed
together
Meighan S.P. 1965 Oregon, the 214 1950-1961 0-14 Single factor analysis, No BCP- and T-cell ALL ana-
et al [68] USA Chi-squared test lyzed together
Knox G. [69] 1964 Northumber- 185 1951-1960 0-14 Single-factor analysis, Yes (summer) BCP- and T-cell ALL ana-
land, Chi-Squared test lyzed together
Durham
Lanzkowsky 1964 South Africa 27 Only states 0-12 Single-factor analysis Yes (summer) BCP- and T-cell ALL ana-
It is made available under a CC-BY-NC-ND 4.0 International license .
P. [70] data col- lyzed together
lected “in
the past six
years”.
Fraumeni 1963 Washington 237 1958-1961 0-15 Single-factor analysis Yes (spring) BCP- and T-cell ALL ana-
J.F. [71] DC, the US and variance, Chi- lyzed together
square test
(which was not certified by peer review) is the author/funder, who has granted medRxiv a license to display the preprint in perpetuity.
medRxiv preprint doi: https://doi.org/10.1101/2023.02.12.23285595; this version posted February 12, 2023. The copyright holder for this preprint
7/39Authors Year* Country** N*** Years**** Age Methods Seasonality***** Other comments
Lee 1963 England and 548 1946-1960 0-18 Single-factor analysis Yes (summer) BCP- and T-cell ALL ana-
J.A.M. [72] Wales lyzed together
Hayes D.M. 1961 North Car- 184 1943-1950 All ages Statistical compar- No BCP- and T-cell ALL ana-
[73] olina isons between the lyzed together
seasonal curve and a
February 12, 2023
hypothetical random
distribution
* Year of publication
** Number of cases in analyzed cohort
*** Country or region of data collection
**** Observed period
***** Seasonality for date of diagnosis reported in the study Yes/No. Particular month/season in brackets.
It is made available under a CC-BY-NC-ND 4.0 International license .
(which was not certified by peer review) is the author/funder, who has granted medRxiv a license to display the preprint in perpetuity.
medRxiv preprint doi: https://doi.org/10.1101/2023.02.12.23285595; this version posted February 12, 2023. The copyright holder for this preprint
8/39medRxiv preprint doi: https://doi.org/10.1101/2023.02.12.23285595; this version posted February 12, 2023. The copyright holder for this preprint
(which was not certified by peer review) is the author/funder, who has granted medRxiv a license to display the preprint in perpetuity.
It is made available under a CC-BY-NC-ND 4.0 International license .
Materials and methods 70
Data sources 71
Sweden has a renowned system of records for citizens in which demographic and 72
healthcare data are collected continuously. All permanent residents are given personal 73
identity numbers that enable linkage between the registers. 74
The Swedish Childhood Cancer Registry (SCCR) is a National Quality Registry 75
containing information about children diagnosed with tumors and hematological 76
malignancies between 0 and 18 years of age stretching back to the 1970s for ALL and 77
1980s for all other malignancies. The registry has an overall coverage of 89% for all 78
diagnoses, however, coverage for ALL specifically is estimated to be as good as 100% at 79
present. It includes information about clinical characteristics, treatment, outcome, 80
immunophenotype, genetic subtype, and other clinically important genetic aberrations. 81
The most abundant BCP-ALL genetic subtypes, HeH and ETV6/RUNX1 -fusion have 82
been registered since 1992 and 2000 respectively, when robust cytogenetic methods to 83
detect these aberrations were introduced in clinical diagnostic routines. The Total 84
Population Registry (RTB) holds information on the date of birth, death, and 85
emigration for all Swedish citizens. 86
The main data sources of this paper the Swedish Childhood Cancer Registry 87
(SCCR), and The Total Population Register (RTB). 88
The study population 89
From the Swedish Childhood Cancer Registry (SCCR) we identified a cohort of 1601 90
children and adolescents diagnosed with BCP-ALL at age ofmedRxiv preprint doi: https://doi.org/10.1101/2023.02.12.23285595; this version posted February 12, 2023. The copyright holder for this preprint
(which was not certified by peer review) is the author/funder, who has granted medRxiv a license to display the preprint in perpetuity.
It is made available under a CC-BY-NC-ND 4.0 International license .
Table 2. Frequencies and proportions of baseline clinical characteristics among Swedish
patients diagnosed with BCP-ALL
BCP-ALL HeH ETV6/RUNX1 Non HeH/
overall ETV6/RUNX1,
other types
Year of diag-
nosis
1995-2005 795 (0.4966) 218 (0.4866) 93 (0.3419) 484 (0.5494)
2005-2017 806 (0.5034) 230 (0.5134) 179 (0.6581) 397 (0.4506)
Age at diag-
nosis
0-5 837 (0.5228) 295 (0.6585) 169 (0.6213) 373 (0.4234)
5-10 424 (0.2648) 105 (0.2344) 87 (0.3199) 232 (0.2633)
10-18 340 (0.2124) 48 (0.1071) 16 (0.0588) 276 (0.3133)
Sex
Male 906 (0.5659) 236 (0.5268) 162 (0.5956) 508 (0.5766)
Female 695 (0.4341) 212 (0.4732) 110 (0.4044) 373 (0.4234)
ARIMAX model 117
ARIMAX stands for autoregressive integrated moving average with external variables 118
and was proposed by Box and Jenkins [78] in 1970. The assumption in the AR 119
(autoregressive) process is that the mean at time t (expected value) depends on the 120
previous realization of the process and the MA (moving average) part is that the 121
additive error is correlated across time. The I (integration) part refers to the fact that 122
the process is an integration of a process. The X part (external variable) introduces 123
independent variables to the process. 124
The ARIMAX is denoted by parameters (p, d, q), where p is the order of 125
autoregression (indicates how many previous observations to use in the AR), d is the 126
differencing order (indicates how many times to differentiate the response variable), and 127
q is the order of moving average (indicates how many previous errors to use in the MA). 128
The ARIMA model is widely used for modeling seasonal patterns and trends in 129
economics in the analysis of Gross Domestic Product, inflation, demand [79–81], and 130
finance in predicting stock prices [82]. It has also been widely used in medical research. 131
For example, the ARIMA model was implemented to forecast COVID-19 cases using 132
Johns Hopkins data [83], and to analyze malaria cases in Sri Lanka [75]. ARIMAX is a 133
powerful statistical method in the analysis and forecasting of time series data. 134
The ARIMAX(p, d, q) for yt in the general form can be written: 135
∆d Φp (L)[yt − xTt β] = Θq (L)ut , (1)
where yt is an observation of the series at time t, p is the order of autoregression, q is 136
the order of moving average. Moreover, Φp (L) = (1 − ϕ1 L − ϕ2 L2 − ... − ϕp Lp ), and 137
Θq (L) = (1 + θ1 L + θ2 L2 + ... + θq Lq ), where ϕ1 , ..., ϕp are the coefficients for the 138
autoregressive part of the process, θ1 , ..., θq are the coefficients of the moving average 139
part of the model. L is a backshift operator with Li yt = yt−i . The lag operator can be 140
multiplied such that Li Lj yt = yt−i−j . ut is a white noise, or uncorrelated, error process 141
at time t, ∆d is a differencing operator of order d. The differentiation method ∆ is 142
chosen to be log differentiation, so ∆d yt denotes log differentiation of yt taken d times. 143
For example ∆yt = log(yt ) − log(yt−1 ). β is a vector of coefficients for covariates xTt . 144
February 12, 2023 10/39medRxiv preprint doi: https://doi.org/10.1101/2023.02.12.23285595; this version posted February 12, 2023. The copyright holder for this preprint
(which was not certified by peer review) is the author/funder, who has granted medRxiv a license to display the preprint in perpetuity.
It is made available under a CC-BY-NC-ND 4.0 International license .
Generalization of ARIMAX 145
While the classical ARIMAX model assumes normally distributed data, BCP-ALL case 146
data can only take integer values from minimum value 0 to maximum value 16, which 147
breaks the assumption of the classical model. Generalization of ARIMAX allows 148
modeling the series of non-normal distributions [76]. 149
The go-to generalization to the discrete data is performed via Poisson distribution. 150
We can see that several papers in our literature search used Poisson regression as a 151
method for obtaining seasonality in leukemia case data [37, 40, 45]. One of the 152
assumptions of Poisson distribution is that the mean and variance of the process are the 153
same. The observed excess variability compared with the Poisson count model 154
motivates use of a negative binomial formulation within the ARIMAX framework. 155
Conditional variance of the negative binomial distribution exceeds the conditional mean. 156
The source of the overdispersion is the unobserved heterogeneity caused by hidden 157
variables as the harmonic and seasonal covariates are just proxies of infectious agents. 158
NB distribution compensates for the lack of fit by introducing an extra 159
parameter [84, 85]. In the literature survey generalization via NB distribution was used 160
by Goujon-Bellec et al [45]. The parameters of NB distribution are pr and r, where pr 161
denotes the probability of success, and r is the number of successes before trials stop. 162
Poisson distribution is the limiting form of NB distribution when r → ∞. 163
The parameter of interest, pr, is assumed to depend on the season. 164
The score of the ARIMAX is generalized to the parameter of NB distribution prt by 165
link function prt = g(λt ) [76], where g(.) is a link function, and λt is the score of 166
ARIMAX process (predicted yt in equation 1), the score λt becomes: 167
p
X q
X
d
λt = yt − ∆ yt + ∆d xTt β + d d T
[∆ yt−i − ∆ xt β] + ut , (2)
i=1 j=0
r
The link function used in the paper is g(x) = r+x . So, given prt and estimated r 168
yt ∼ N B(prt , r). The generalized ARIMAX model called GARIMAX model [75]. 169
Following Zeger and Qaqish [86] we implement “ZQ1” transformation of the 170
ARIMAX by adding a constant c. Addition of the constant allows avoiding the problem 171
of computing the logarithm of observations with the zero value in the log difference 172
integration transformation of the model. “ZQ1” transformation suggests yt′ = yt + c, 173
where 0 < c ≤ 1. 174
GARIMAX in the Bayesian setup 175
The formulation of the model in the Bayesian setup gives several advantages over the 176
classical maximum likelihood estimation. The first one is that the analysis is no longer 177
performed on a single estimate, but rather on the distributions of the underlying 178
parameters. The Bayesian models with the correctly specified priors and estimation 179
using MCMC allow for the parameters’ interval estimates to be appropriate in small 180
samples [77]. This advantage of the Bayesian framework allows for unbiased inference 181
even in small samples. 182
We assume a stationary model for the GARIMAX process, so AR and MA 183
coefficients ϕ1 , ...ϕp and θ1 , ..., θq should be constrained such that the resulting process 184
is invertible and stationary. We followed Jones [87] in assigning prior distributions for 185
AR and MA coefficients. The algorithm for generation of the sample of ϕ1 , ..., ϕp can be 186
summarized as: 187
Algorithm: 188
February 12, 2023 11/39medRxiv preprint doi: https://doi.org/10.1101/2023.02.12.23285595; this version posted February 12, 2023. The copyright holder for this preprint
(which was not certified by peer review) is the author/funder, who has granted medRxiv a license to display the preprint in perpetuity.
It is made available under a CC-BY-NC-ND 4.0 International license .
• Generate value k1 , ..., kp following the kp ∼ Beta([ 21 (j + 1)], [ 12 j] + 1), where 189
p = 1, ..., P , where P is the number of lags of autoregression, square brackets 190
denote the integer part of the value in them (round to the closest integer); 191
• perform transformation rp = 2kp − 1 for all p; 192
(p)
• assign yp = rp for all p; 193
• and then for j = 2, ..., p and for i = 1 : (j − 1) iteratively compute 194
(j) (j−1) (j−1)
yi = yi − rj yj−i ; 195
• yi is the sample for ϕi , where i ∈ 1, .., p 196
The same procedure is performed for the θ coefficients, but instead of the lags for the 197
autoregression (p) the lags for the moving average (q) are used. 198
For the seasonal coefficients of the harmonic functions and the coefficients of the 199
seasonal matrix normal distribution was selected, β1 , . . . , βk ∼ Norm(0, 0.1). 200
Distribution is centered around the 0 value, the prior states that there is no evidence of 201
seasonality of BCP-ALL no its subtypes before the data is introduced. 202
The last parameter to be estimated in the model is the parameters of the Negative 203
Binomial distribution r, which represent the number of failures until the trials are 204
stopped. Prior distribution for r is gamma [88], r ∼ Gamma(0.01, 0.01). 205
The model is estimated using MCMC (Markov chain Monte Carlo) simulation 206
method. JAGS [89] software is used to implement the simulation. Python is the main 207
programming language used for data preparation, visualization and calls for JAGS 208
software. 209
Model choice 210
To identify a number of lags for autoregression and moving average parameters, 12 211
models were estimated. The maximum 3rd order of the lags was chosen to identify the 212
best GARIMAX model for each analysed time series. We assume a weakly stationary 213
series after taking log difference. Bayesian information criteria (BIC) was chosen as a 214
score for model selection. The model with the lowest BIC was then selected as a basis 215
for the seasonality checks. The BIC allows finding a balance between the complexity of 216
the model and its performance. The BIC for the model m is defined as: 217
BICm = −2LLm + log(N )k, (3)
where LLm is the median log-likelihood computed by the model m, N is the number of 218
observations of the analyzed series, and k is the number of the estimated parameters of 219
the model. 220
General procedure 221
We implemented a two-step procedure for identification of seasonal wave for every 222
analysed time series. The preliminary step aims to identify the number of lags for AR 223
and MA coefficients using the BIC score without any seasonal covariates. 224
The first step uses harmonic functions as a covariate for the GARIMAX model. The 225
harmonic covariate is xTt = [sin(2πt ÷ 4), cos(2πt ÷ 4)]. 226
During the second step, we run the same specification of the GARIMAX model with 227
a quarterly seasonal matrix as a covariate. The third step identifies the particular 228
quarter when the wave has its peak. The covariates in this case become a seasonal 229
matrix, in which each column value corresponds to a specific quarter of the year, except 230
February 12, 2023 12/39medRxiv preprint doi: https://doi.org/10.1101/2023.02.12.23285595; this version posted February 12, 2023. The copyright holder for this preprint
(which was not certified by peer review) is the author/funder, who has granted medRxiv a license to display the preprint in perpetuity.
It is made available under a CC-BY-NC-ND 4.0 International license .
for the so-called “base quarter”, which is taken as the quarter with the lowest number of 231
cases. 232
The main underlying process that models the dynamics of the observations at time t 233
is ARIMAX. The score is then generalized via Negative Binomial distribution, using of 234
the discrete NB distribution. The generalization addresses the assumption of the count 235
nature of date of diagnosis quarterly case time series data. 236
Exploratory analysis 237
As a supplementary and exploratory analysis, the most popular test in the literature 238
survey (Chi-square test) was performed on date of diagnosis and date of birth data of 239
BCP-ALL. Chi-square test is a statistical test for categorical data, and it is used to 240
determine whether the data is significantly different from the expected value. The test 241
statistics can be formally written as: 242
X (O − E)2
χ2 =
E
2
, where χ is the test statistic, O is observed frequency, E is the expected frequency. 243
P-values were adjusted using Benjamini-Hochberg procedure [90] and all tests were 244
performed using the Python programming language. 245
Also as an exploratory measure, we generated descriptive data on distribution of age 246
at diagnosis and genetic subtypes, for the whole cohort as well as for cases diagnosed in 247
each respective month of the year. 248
Results 249
The best models for all three types of quarters are presented in the table 3. 250
Table 3. The best GARIMAX (p, d, q) specifications for each quarterly series
BCP-ALL HeH ETV6/RUNX1
1st type quarter GARIMAX(3, 1, 0) GARIMAX(3, 1, 0) GARIMAX(4, 1, 0)
2nd type quarter GARIMAX(4, 1, 0) GARIMAX(4, 1, 0) GARIMAX(3, 1, 0)
3rd type quarter GARIMAX(2, 1, 0) GARIMAX(3, 1, 0) GARIMAX(2, 1, 0)
All BIC scores for the models are presented in S1 Appendix 251
After identification of the order of autoregression and moving average, we estimated 252
the model with harmonic functions as covariates to identify presence of seasonal wave in 253
the series. 254
Tables 4 and 5 report summary statistics for posterior distributions of the 255
coefficients of seasonal harmonic functions. The first column of the table is the name of 256
the analyzed series, the second column is the specification of the GARIMAX model, the 257
column ”Waves” specifies the type of the harmonic function, the forth column reports 258
the median value of the distribution, the last two column report 95% credibility interval. 259
If the credibility interval fully consists of positive or negative values, it means that 95% 260
of the posterior does not contain 0 and it is unlikely that that the covariate has no effect 261
on the response variable. The covatiate in this case is said to be informative in the 262
Bayesian setup, the corresponding term in the classical statistics is significant. If the 263
credibility interval contains the 0 value, it means that the big mass of the posterior is 264
centered around 0 value and the covariate is uninformative. 265
Supplementary Figures S1 Fig, S2 Fig, S3 Fig show graphical distributions of 266
posterior densities of the coefficients of seasonal harmonic functions (the visual 267
February 12, 2023 13/39medRxiv preprint doi: https://doi.org/10.1101/2023.02.12.23285595; this version posted February 12, 2023. The copyright holder for this preprint
(which was not certified by peer review) is the author/funder, who has granted medRxiv a license to display the preprint in perpetuity.
It is made available under a CC-BY-NC-ND 4.0 International license .
Table 4. Summary of posterior distributions of the coefficients of seasonal harmonic
functions, BCP-ALL
Series (p,d,q) BIC scores Waves Median 2.5% 97.5%
BCP-ALL (3, 1, 0) 526.02 Sin wave (β1 ) -0.107 -0.1863 -0.0288
1st
type quarter Cos wave (β2 ) -0.0314 -0.114 0.0486
BCP-ALL (3, 1, 0) 517.08 Sin wave (β1 ) -0.1042 -0.2092 -0.0054
2nd
type quarter Cos wave (β2 ) -0.0366 -0.1525 0.0699
BCP-ALL (4, 1, 0) 535.54 Sin wave (β1 ) -0.0322 -0.1159 0.0497
3rd
type quarter Cos wave (β2 ) -0.1212 -0.2017 -0.0419
representation of the table 4 and 5). The red line on the figure represents the zero 268
value of the coefficients. 269
The credibility intervals of posterior densities of the harmonic functions do not 270
include 0 values for sine harmonic waves of BCP-ALL of the 1st and 2nd specified 271
quarter type, and cosine harmonic wave of BCP-ALL of the 3rd quarter type. 272
Table 5. Summary of the posterior distributions of the coefficients of the seasonal
harmonic functions, BCP-ALL subtypes
Series (p,d,q) BIC scores Waves Median 2.5% 97.5%
HeH 1st (4, 1, 0) 403.86 Sin wave (β1 ) -0.0303 -0.2153 0.1812
type quarter Cos wave (β2 ) -0.0521 -0.2377 0.1491
HeH 2nd (4, 1, 0) 405.01 Sin wave (β1 ) -0.0462 -0.2462 0.1496
type quarter Cos wave (β2 ) 0.018 -0.1832 0.2066
HeH 3rd (3, 1, 0) 410.39 Sin wave (β1 ) 0.0653 -0.1312 0.2645
type quarter Cos wave (β2 ) -0.0985 -0.2946 0.0963
ETV6/RUNX1 (2, 1, 0) 354.84 Sin wave (β1 ) 0.1052 -0.0572 0.2626
1st
type quarter Cos wave (β2 ) 0.0562 -0.1057 0.2184
ETV6/RUNX1 (3, 1, 0) 320.42 Sin wave (β1 ) -0.0999 -0.3933 0.1864
2nd
type quarter Cos wave (β2 ) -0.0366 -0.3352 0.2707
ETV6/RUNX1 (2, 1, 0) 343.50 Sin wave (β1 ) -0.0911 -0.2583 0.0779
3rd
type quarter Cos wave (β2 ) -0.0272 -0.1865 0.1311
The credibility intervals of posterior distribution of the coefficients of seasonal 273
harmonic functions do include the value 0, which means that harmonic functions do not 274
provide much information in explaining the dynamics of the case counts of BCP-ALL 275
subtypes HeH and ETV6/RUNX1. The informative seasonal waves are: sine wave of 276
BCP-ALL series of the 1st type quarter, sine wave of BCP-ALL series of the 2nd type 277
quarter, the cosine wave of BCP-ALL series of the 3rd type quarter. No informative 278
seasonal waves for the BCP-ALL subtypes were found. 279
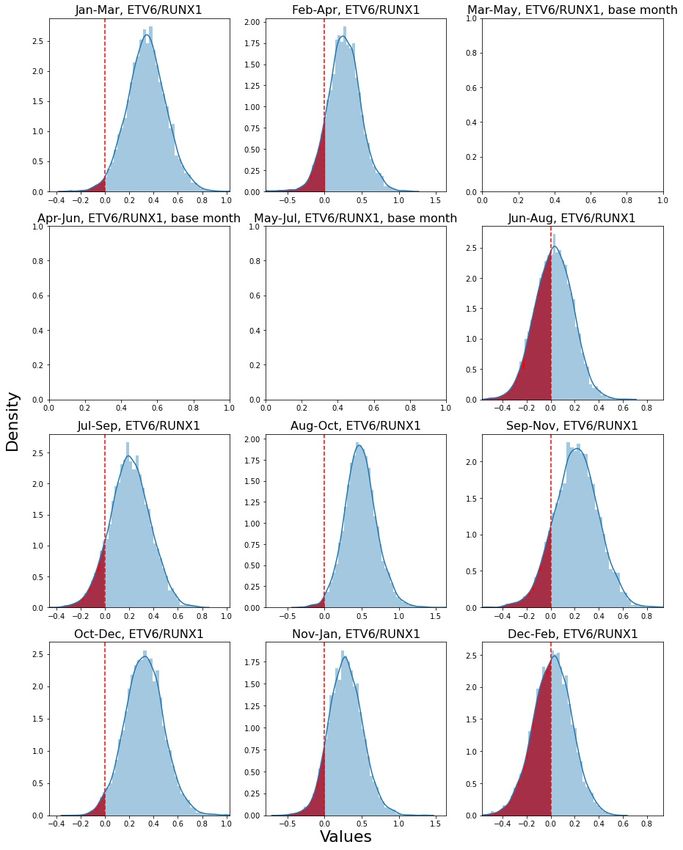
Tables 6 and 7 report the summary for the posterior distributions of the 280
coefficients of the seasonal matrix. The first column is the name of the series. Base 281
quarter for each series was chosen such that all other quarters show positive median 282
values. The last three columns of the table are median and 95% credibility intervals. 283
Figures S4 Fig, S5 Fig, S6 Fig show the visual representation of the posterior 284
February 12, 2023 14/39medRxiv preprint doi: https://doi.org/10.1101/2023.02.12.23285595; this version posted February 12, 2023. The copyright holder for this preprint
(which was not certified by peer review) is the author/funder, who has granted medRxiv a license to display the preprint in perpetuity.
It is made available under a CC-BY-NC-ND 4.0 International license .
Table 6. Summary of the posterior distributions of the coefficients of the seasonal
matrix, BCP-ALL
Series Base quarter Estimated Median 2.5% 97.5%
quarters
BCP-ALL 1st Jan-Mar Apr-Jun 0.0952 -0.4695 0.308
type quarter Jul-Sep 0.2095 0.0463 0.3796
Oct-Dec 0.0294 -0.5489 0.2582
BCP-ALL 2nd Nov-Jan Feb-Apr 0.0031 -0.2901 0.2919
type quarter May-Jul 0.0813 -0.1445 0.3041
Aug-Oct 0.2088 0.0730 0.4986
BCP-ALL 3rd Dec-Feb Mar-May 0.1354 -0.0422 0.3124
type quarter Jun-Aug 0.2487 -0.0788 0.4233
Sep-Nov 0.1901 -0.0105 0.4421
distributions of the coefficients of the seasonal matrix. The base quarter presented as a 285
blank picture. 286
Table 7. Summary of the posterior distributions of the coefficients of the seasonal
matrix, BCP-ALL subtypes
Series Base quarter Estimated Median 2.5% 97.5%
quarters
HeH 1st Oct-Dec Jan-Mar -0.0041 -0.2813 0.2755
type quarter Apr-Jun 0.1593 -0.1335 0.4614
Jul-Sep 0.228 -0.0374 0.4962
HeH 2nd May-Jul Feb-Apr 0.0288 -0.4287 0.4466
type quarter Aug-Oct 0.1227 -0.3106 0.5008
Nov-Jan 0.0274 -0.3739 0.4129
HeH 3rd Mar-May Jun-Aug 0.2912 -0.0625 0.6493
type quarter Sep-Nov 0.0941 -0.3191 0.4861
Dec-Feb 0.0677 -0.3165 0.4321
ETV6/RUNX1 Apr-Jun Jan-Mar 0.3394 0.0308 0.6457
1st type quarter Jul-Sep 0.1986 -0.1151 0.5093
Oct-Dec 0.3135 -0.0090 0.6271
ETV6/RUNX1 May-Jul Feb-Apr 0.2626 -0.1695 0.6922
2nd type quarter Aug-Oct 0.4715 0.0572 0.9090
Nov-Jan 0.2790 -0.1615 0.7104
ETV6/RUNX1 Mar-May Jun-Aug 0.0262 -0.2791 0.3425
3rd type quarter Sep-Nov 0.2180 -0.1384 0.5679
Dec-Feb 0.0202 -0.2842 0.3186
Jul-Sep and Aug-Oct are the informative peak quarters for BCP-ALL series for the 287
first and the second quarter types accordingly. Peak seasons contain August and 288
September, the months with the highest number of diagnosed BCP-ALL cases in our 289
studied Swedish cohort. It is important to observe the significance on both stages of the 290
analysis, as the seasonal matrix does not consider repeatability of seasonal variation, 291
while harmonic seasonal waves do not provide information concerning the peak months. 292
The high hyperdiploid genetic subtype of BCP-ALL does not show any informative 293
result for any quarter types not in the first nor the second steps of analysis. Diagnosis 294
of ETV6/RUNX1 positive BCP-ALL shows an increase in Jan-March and Aug-Oct 295
quarters, which might suggest a two-peaked seasonal wave, which however did not yet 296
form the strong periodicity tested by strictly periodic harmonic functions. On the other 297
hand, the second step of analysis does not test for seasonality, it tests for the increase of 298
February 12, 2023 15/39medRxiv preprint doi: https://doi.org/10.1101/2023.02.12.23285595; this version posted February 12, 2023. The copyright holder for this preprint
(which was not certified by peer review) is the author/funder, who has granted medRxiv a license to display the preprint in perpetuity.
It is made available under a CC-BY-NC-ND 4.0 International license .
the estimated quarters from the base quarter. Hence, the only result that consistently 299
holds is seasonality in the whole group of BCP-ALL cases. In this group, the 300
informative harmonic function was found in all quarter types and in the first and second 301
specified quarters with an increase containing August and September. 302
Table 8. Chi-square tests at the date of diagnosis
BCP-ALL
Jan-Mar 386 Feb-Apr 398 Mar-May 406
Apr-Jun 406 May-Jul 391 Jun-Aug 427
Jul-Sep 433 Aug-Oct 446 Sep-Nov 412
Oct-Dec 376 Nov-Jan 366 Dec-Feb 356
p-value 0.1919 0.0387 0.0686
Adj p-value 0.3454 0.3483 0.3087
HeH
Jan-Mar 102 Feb-Apr 112 Mar-May 100
Apr-Jun 120 May-Jul 108 Jun-Aug 132
Jul-Sep 124 Aug-Oct 119 Sep-Nov 111
Oct-Dec 102 Nov-Jan 109 Dec-Feb 105
p-value 0.3027 0.8824 0.1509
Adj p-value 0.4541 0.8824 0.4527
ETV6/RUNX1
Jan-Mar 73 Feb-Apr 69 Mar-May 66
Apr-Jun 57 May-Jul 54 Jun-Aug 65
Jul-Sep 67 Aug-Oct 80 Sep-Nov 76
Oct-Dec 75 Nov-Jan 69 Dec-Feb 65
p-value 0.4101 0.1697 0.7375
Adj p-value 0.5273 0.3818 0.8297
Tables 8 and 9 report the results of exploratory Chi-square tests of BCP-ALL 303
(including subtypes) seasonal variation. The lowest p-value was obtained for seasonality 304
of BCP-ALL diagnosis using the second type of quarters, which showed a peak in 305
August - October. No significant p-values were found for seasonality in diagnosis of 306
BCP-ALL subtypes (HeH and ETV6/RUNX1 ). Neither did we find any significant 307
p-values for seasonality of date of birth in BCP-ALL cases, the lowest p-value being 0.07 308
(BCP-ALL third quarter type with peak in March-May). 309
As all the tests were performed on the same BCP-ALL data, HeH and 310
ETV6/RUNX1 being the subtypes of BCP-ALL, the p-values of Chi-square test were 311
adjusted using the Benjamini-Hochberg procedure. After this adjustment of p-values, 312
there are no significant results of Chi-square test to be reported. 313
Descriptive data displayed a similar distribution of age at diagnosis comparing the 314
entire cohort and cases diagnosed each respective month Table 10, including the peak 315
incidence months August and September. Also the distribution of different subtypes of 316
BCP-ALL was similar when comparing the peak months August and September to all 317
other 10 months respectively and to the whole year (entire cohort). Thus, cases 318
diagnosed during peak months August and September did not stand out in any 319
apparent way neither regarding age of diagnosis nor subtype. 320
Discussion 321
Exposure to infectious disease is today a well-established suspect in the search for 322
environmental involved in both initiation and progression of BCP-ALL. We know that 323
pre-leukemic clones of many BCP-ALL subtypes are initiated during fetal life in a 324
February 12, 2023 16/39medRxiv preprint doi: https://doi.org/10.1101/2023.02.12.23285595; this version posted February 12, 2023. The copyright holder for this preprint
(which was not certified by peer review) is the author/funder, who has granted medRxiv a license to display the preprint in perpetuity.
It is made available under a CC-BY-NC-ND 4.0 International license .
Table 9. Chi-square tests at the date of birth
BCP-ALL
Jan-Mar 421 Feb-Apr 416 Mar-May 446
Apr-Jun 420 May-Jul 405 Jun-Aug 385
Jul-Sep 385 Aug-Oct 398 Sep-Nov 390
Oct-Dec 375 Nov-Dec 382 Dec-Feb 380
p-value 0.2382 0.6774 0.0689
Adj p-value 0.7146 0.8709 0.6201
HeH
Jan-Mar 123 Feb-Apr 112 Mar-May 116
Apr-Jun 103 May-Jul 111 Jun-Aug 111
Jul-Sep 117 Aug-Oct 119 Sep-Nov 110
Oct-Dec 105 Nov-Dec 106 Dec-Feb 111
p-value 0.4818 0.8571 0.9782
Adj p-value 0.8672 0.9642 0.9782
ETV6/RUNX1
Jan-Mar 64 Feb-Apr 62 Mar-May 76
Apr-Jun 79 May-Jul 84 Jun-Aug 68
Jul-Sep 62 Aug-Oct 58 Sep-Nov 62
Oct-Dec 67 Nov-Dec 68 Dec-Feb 66
p-value 0.4648 0.1236 0.6755
Adj p-value 1 0.5562 1
Table 10. Number of cases and proportions of children diagnosed during specified
months and periods
Aug Sep Aug-Sep Oct-Jul All months
ALL 162 144 306 1295 1601
(0.1012) (0.0899) (0.1911) (0.8089)
HeH 48 (0.1071) 40 (0.0893) 88 (0.1964) 360 448
(0.8036)
ETV6/ 27 (0.0993) 22 (0.0809) 49 (0.1802) 223 272
RUNX1 (0.8198)
other sub- 87 (0.0987) 82 (0.0931) 169 712 881
types (0.1918) (0.8082)
substantial portion of cases [91–94], and that the chromosomal rearrangement 325
representing each subtype is considered the initiating genetic event or “first hit”. 326
Epidemiological data has pointed to some specific viral infections increasing the risk of 327
BCP-ALL following maternal infection during fetal life, although not all studies support 328
these findings [95–97]. Thus, the cause of initiating genetic events stands unresolved. 329
We performed an exploratory analysis applying Chi-square test to data of quarterly 330
aggregated at time of birth of BCP-ALL cases, but did not obtain any significant 331
difference in incidences between months. Four previous studies have indeed reported 332
seasonality in time of birth for ALL cases (B- and T-cell ALL analyzed together), two of 333
which specifically in the 1-6 year age group, with peaks ranging from 334
jan-april [47, 48, 52]. Yet, other reports have not detected date of birth seasonality [99]. 335
Further studies aiming at associating temporal waves in time of birth of BCP-ALL cases 336
to preceding dittos of infectious disease hold the potential to guide molecular studies of 337
leukemia initiating infections. 338
For preleukemic clones to progress into overt leukemia additional “hits” are required, 339
as first suggested in the “two-hit hypothesis” by Greaves [32]. That a fraction of healthy 340
February 12, 2023 17/39medRxiv preprint doi: https://doi.org/10.1101/2023.02.12.23285595; this version posted February 12, 2023. The copyright holder for this preprint
(which was not certified by peer review) is the author/funder, who has granted medRxiv a license to display the preprint in perpetuity.
It is made available under a CC-BY-NC-ND 4.0 International license .
neonates harbor small populations of pre-leukemic clones at birth without ever 341
developing BCP-ALL emphasizes the importance of such subsequent events [19], but 342
also offers hope for development of preventive measures [33]. Epidemiological studies 343
have identified environmental factors such as early (medRxiv preprint doi: https://doi.org/10.1101/2023.02.12.23285595; this version posted February 12, 2023. The copyright holder for this preprint
(which was not certified by peer review) is the author/funder, who has granted medRxiv a license to display the preprint in perpetuity.
It is made available under a CC-BY-NC-ND 4.0 International license .
be interpreted with caution. To draw any conclusions about the effects of SARSCoV-2 393
infection and the restrictions to prevent it’s spread, BCP-ALL incidence will need to be 394
closely monitored, and will undoubtedly be so henceforth. Not least will observing 395
long-term effects (years) of decreased infectious exposure on future incidence rates allow 396
for scrutinizing of the delayed infectious exposure hypothesis [123, 124]. 397
In light of the above, seasonal variation of ALL (most studies do not discriminate 398
between B- and T-cell origin) as a proxy for infectious exposure has been extensively 399
studied over the last decades, applying an array of different methods as discussed in 400
more detail below. We can conclude from our review of previous studies (Table 1) that 401
there is no consistent proof of a seasonal wave in time of ALL diagnosis. And, in cases 402
where seasonality is detected, time of peak incidence is scattered throughout the year. 403
However, when studying seasonal variation, it is important to consider that patterns of 404
seasonality may differ from country to country depending on factors such as climate 405
zones, affluence, way of life et.c. affecting infectious panorama and seasonality of 406
communicable infectious disease. 407
In the current study we report an informative seasonality at date of diagnosis 408
specifically for BCP-ALL, with peak incidence in August-September. Descriptive data 409
on distribution of age at diagnosis and genetic subtype did not differ for cases diagnosed 410
in August-September compared to other months nor the entire cohort. In Sweden 411
almost all children attend pre-school from age 1 and a long summer holiday is 412
customary, usually beginning in late June or early July and extending into early August. 413
One possible explanation for the timing of our observed incidence peak is that decreased 414
spreading of infectious disease during summer, a consequence of the prolonged summer 415
holiday in Sweden, causes a temporary halt in the final steps of disease progression for 416
some individuals that would otherwise have presented clinically. This would be in 417
accordance with observations in Hong Kong during SARS-epidemic [114]. However, in 418
contrast to the Hong Kong example cases are then instead accumulated in 419
August-September when at risk-individuals are again exposed to infections in schools 420
and pre-schools. This rationale builds on the assumption that an infection quite rapidly 421
pushes disease progression the last step to giving non-ignorable clinical symptoms of 422
BCP-ALL. It is known that symptoms of ALL do indeed evolve in only days to weeks 423
but the length of latency from second genetic hit to clinical presentation remains 424
unknown and may very well be variable. Thus, if such a “last” infection before diagnosis 425
causes the second genetic hit or just puts selective pressure on already “ready-to-go” 426
leukemic cells remains to be understood. 427
An alternative explanation for our observed August-September BCP-ALL incidence 428
peak would be that some specific common pathogens have a slightly sharper ability 429
than others to cause genetic second hits, and thus progression to overt disease, in 430
pre-leukemic cells. Entero and varicella viruses for example have seasonal peaks during 431
summer [125]. Again, the challenge of associating a peak in BCP-ALL incidence to a 432
peak in spread of certain pathogens is the undetermined and likely variable latency from 433
second genetic hit to clinical presentation. 434
Analysis of seasonal variation in series of aggregated counts may face several 435
challenges. As for epidemiological studies in general, small sample size is a common 436
problem resulting in low statistical power, which increases probability of reporting false 437
negative results as statistical tests performed on small samples are only capable of 438
detecting large effects [126, 127]. In our literature review, merely 9 out of 42 previous 439
publications on seasonality in ALL (as summarized in Table 1) had more than 1000 440
ALL cases in their studied cohort. 441
The largest cohort studied to date is that of 15 835 cases of childhood leukmeia (73 442
% lymphatic) born and diagnosed between 1953-1995 in UK, published by Higgins, C. 443
D. et al in 2001. [51] For the 1282 cases born and diagnosed before 1962, a suggestive 444
February 12, 2023 19/39medRxiv preprint doi: https://doi.org/10.1101/2023.02.12.23285595; this version posted February 12, 2023. The copyright holder for this preprint
(which was not certified by peer review) is the author/funder, who has granted medRxiv a license to display the preprint in perpetuity.
It is made available under a CC-BY-NC-ND 4.0 International license .
but after not statistically significant incidence peak in August-September was identified. 445
The authors however call for caution when interpreting this indication; since cases form 446
this time period were extracted from death-records, retrieving date of diagnosis 447
retrospectively, a ”complication to death” could have introduced an apparent 448
seasonality. Further, no significant seasonality in childhood leukemia incidence was 449
found when analysing the entire cohort. A possible explanation was suggested to be the 450
fact that seasonality was examined by date of diagnosis rather than clinical onset, 451
between which there may be a discrepancy in time masking seasonality. Based on this 452
possible discrepancy, one could argue for increasing the aggregation period from month 453
to quarter as was done in the present study. Quarterly transformation allows the date of 454
onset and date of diagnosis to be in the same period of time series analysis. The main 455
drawback of quarterly transformation is that it requires performing the analysis on 456
three different subsets of quarters, which increases the probability of finding false 457
positive results using classical statistical methods. We believe that our cohort of 1601 458
cases diagnosed during a time-span of 22 years (1995-2017) as well as formulation of the 459
GARIMAX model in the Bayesian setup allows to provide the unbiased results in this 460
paper. 461
Our literature review revealed three previously applied types of data transformation, 462
an obligate step before performing analysis with any method. The first transformation 463
aggregates tabular data from registries to counts by seasons or months, summing up the 464
data for all observed years in the sample, resulting in four (seasons) or 12 (months) bin 465
histograms. The second transformation counts number of cases per month or season in 466
the sample, without summation between different years, resulting in time series of 467
monthly or seasonal counts. The third transformation uses individual case-by-case 468
statistical methods. To our knowledge, this third type of transformation was only 469
previously used by Gao et al [49] and was also applied in the present study. Type of 470
data transformation does to some extent depend on the chosen method for analysis, but 471
different combinations may be applied. Therefore, choice of data transformation type is 472
a variable that may affect output. 473
The most common method for detection of the seasonal variation is the Chi-square 474
test, which was used in 13 previous studies included in our review of previous 475
publications, out of which seven reported seasonal variation in ALL/childhood leukmeia 476
[35, 39, 42, 44, 46, 48, 50, 63–65, 68, 69, 71]. The test is implemented to histogram data 477
transformation and answers the question whether there is likely higher relative frequency 478
in one group than the other, the other group usually being the mean of all data. 479
Exploratory analysis without statistical tests was used in 11 publications (stated as 480
”single-factor analysis” in Table1) 1) [38, 47, 55, 57, 58, 60, 62, 66, 67, 70, 72] with seven 481
papers reporting positive results for seasonal variation in ALL/childhood leukmeia. The 482
most recent paper with descriptive statistics was published in 2011, marking a shift 483
towards use of more strict hypothesis-driven methods. 484
Edward’s test [129] was implemented in four reviewed publications [43, 51, 56, 61]. 485
The model detects sinusoidal curve within a 12-month period histogram. J A Ross et 486
al [53] implement Rodger’s test [130], a modification of Edward’s test, which evaluates 487
the significance for cyclic trends based on the efficient score vector calculated for each 488
seasonal peak of aggregated cases. Five studies that applied these similar tests reported 489
significant seasonal variation of ALL/childhood leukemia diagnosis in East Anglia 490
(UK) [56] and USA [53], but neither in Mexico [43], UK (all regions) [51], NW 491
England [56] nor the Netherlands [61]. 492
Cosinor Analysis [52, 54, 59] is performed by fitting the sinusoidal curves (harmonic 493
functions) to 12-month histograms. Poisson regression with harmonic functions, an 494
extension of cosinor analysis assuming not-normal distribution of errors, was applied in 495
four previous studies [37, 40, 45, 48]. Moreover, Gao et al [49] investigated the seasonal 496
February 12, 2023 20/39You can also read