Evaluation of an alternative spectroscopic approach for aflatoxin analysis: Comparative analysis of food and feed samples with UPLC- MS/MS
←
→
Page content transcription
If your browser does not render page correctly, please read the page content below
Evaluation of an alternative spectroscopic approach for aflatoxin
analysis: Comparative analysis of food and feed samples with UPLC-
MS/MS
Campbell, K., Ferreira Cavalcante, A. L., Galvin-King, P., Oplatowska-Stachowiak, M., Brabet, C., Metayer, I.,
Montet, D., Haughey, S. A., & Elliott, C. T. (2017). Evaluation of an alternative spectroscopic approach for
aflatoxin analysis: Comparative analysis of food and feed samples with UPLC-MS/MS. SENSORS AND
ACTUATORS B-CHEMICAL, 239, 1087-1097. http://10.1016/j.snb.2016.08.115
Published in:
SENSORS AND ACTUATORS B-CHEMICAL

Document Version:
Early version, also known as pre-print

Queen's University Belfast - Research Portal:
Link to publication record in Queen's University Belfast Research Portal

Publisher rights
Copyright 2016 The Authors

General rights
Copyright for the publications made accessible via the Queen's University Belfast Research Portal is retained by the author(s) and / or other
copyright owners and it is a condition of accessing these publications that users recognise and abide by the legal requirements associated
with these rights.

Take down policy
The Research Portal is Queen's institutional repository that provides access to Queen's research output. Every effort has been made to
ensure that content in the Research Portal does not infringe any person's rights, or applicable UK laws. If you discover content in the
Research Portal that you believe breaches copyright or violates any law, please contact openaccess@qub.ac.uk.

Download date:31. Jan. 2022
Evaluation of an alternative spectroscopic approach for aflatoxin
     analysis: Comparative analysis of food and feed samples with
                               UPLC-MS/MS
Katrina Campbell1*, Ana L. Ferreira Cavalcante1, Pamela Galvin-King1, Michalina Oplatowska-
  Stachowiak1, Catherine Brabet2, Isabelle Metayer2, Didier Montet2, Simon A. Haughey1,
                                    Christopher T. Elliott1
1 Institutefor Global Food Security, School of Biological Sciences, Queen’s University, David
Keir Building Stranmillis Road, Belfast, UK BT95AG

2 Centre de coopération Internationale en Recherche Agronomique pour le Développement,
(CIRAD), UMR Qualisud, 73 rue Jean-François Breton, 34 398 Montpellier Cedex 5, France

*Corresponding author:
Dr Katrina Campbell
Tel: +44 (0) 28 90976535
Fax: +44 (0)28 90976513
E-mail: katrina.campbell@qub.ac.uk
Abstract Increasing research has highlighted the effects of changing climates on the occurrence and prevalence of toxigenic Aspergillus species producing aflatoxins. There is concern of the toxicological effects to human health and animal productivity following acute and chronic exposure that may affect the future ability to provide safe and sufficient food globally. Considerable research has focused on the detection of these toxins, based on the physicochemical and biochemical properties of the aflatoxin compounds, in agricultural products for human and animal consumption. As improvements in food security continue more regulations for acceptable levels of aflatoxins have arisen globally; the most stringent in Europe. These regulations are important for developing countries as aflatoxin occurrence is high significantly effecting international trade and the economy. In developed countries analytical approaches have become highly sophisticated, capable of attaining results with high precision and accuracy, suitable for regulatory laboratories. Regrettably, many countries that are affected by aflatoxin contamination do not have resources for high tech HPLC and MS instrumentation and require more affordable, yet robust equally accurate alternatives that may be used by producers, processors and traders in emerging economies. It is especially important that those companies wishing to exploit the opportunities offered by lucrative but highly regulated markets in the developed world, have access to analytical methods that will ensure that their exports meet their customers quality and safety requirements. This work evaluates the ToxiMet system as an alternative approach to UPLC-MS/MS for the detection and determination of aflatoxins relative to current European regulatory standards. Four commodities: rice grain, maize cracked and flour, peanut paste and dried distillers grains were analysed for natural aflatoxin contamination. For B1 and total aflatoxins determination the qualitative correlation, above or below the regulatory limit, was good for all commodities with the exception of the dried distillers grain samples for B1 for which no calibration existed. For B1 the quantitative R2 correlations were 0.92, 0.92, 0.88 (
Keywords: ToxiMet, UPLC-MS/MS, Aflatoxin, food and feed, spectroscopy, Aflatoxin M1

Introduction

Aflatoxins, a group of mycotoxins first discovered after the occurrence of Turkey X disease in
UK in the 1960s, are a most influential group of contaminants of concern for food security [1].
They are naturally occurring metabolites produced commonly by the toxigenic strains of the
fungal species Aspergillus [2]. Several factors favour fungal growth including environmental,
chemical and biological parameters. Two important factors affecting growth are the
temperature and relative humidity with growth occurring between 10-35°C, optimally 30-
35°C, and relative humidity optimally above 85% [3]. Due to an awareness of the risks of
climate change to food security, increasing studies are emerging examining the role of climatic
factors on specific fungal species and their gene expression for toxin production [4,5].
Aflatoxins are organic chemicals known as difuranocoumarins. They are classified into two
broad groups according to their chemical structure; the difurocoumarocyclopentenone series
(AFB1, AFB2, AFB2A, AFM1, AFM2, AFM2A and aflatoxicol) and the difurocoumarolactone
series (AFG1, AFG2, AFG2A, AFGM1, AFGM2, AFGM2A and AFB3). The four major
agriculturally important aflatoxins: B1, B2, G1, G2 were identified from their significant direct
contamination of foods and feeds (Figure 1). These toxins have minor modifications in
structure and molecular formulas and form a unique group of heat stable highly oxygenated,
naturally occurring heterocyclic compounds. Aflatoxins B2 and G2 were established as the
dihydroxy derivatives of B1 and G1, respectively. The aflatoxins display potency of toxicity,
carcinogenicity, mutagenicity in the order of AFB1 > AFG1 > AFB2 > AFG2 [6]. Chemically the
double bond of the dihydrofuran and the elements linked to the coumarin moiety are of
importance in producing biological effects. The aflatoxins fluoresce strongly in ultraviolet light
due to the ring structure (ca. 365 nm). The B label of aflatoxins B1 and B2 resulted from the
exhibition of blue fluorescence under UV-light (425nm), while the G label refers to the yellow-
green fluorescence of the relevant structures under UV-light (540nm). It has been reported
that Aspergillus flavus, Emericella astellata, E. venezuelensis and A. pseudotamarii produce B1
and B2 while A. parasiticus, A. nomius, A. bombycus, A. miniscleotigenes, A. arachidicola
produce B1, B2, G1 and G2 toxins [7]. The aflatoxins M1 and M2, two additional metabolic
products were first isolated from milk of lactating animals fed aflatoxin preparations; hence,
the M label [8]. Aflatoxin M1 is 4-hydroxy aflatoxin B1 and aflatoxin M2 is 4-dihydroxy aflatoxin
B2 [9] and their toxic potency falls between B1 and G1 and B2 and G2 respectively.
Due to a combination of the optimal conditions required for fungal growth and susceptibility
of the staple diets to Aspergillus growth these toxins tend to be most prevalent in tropical and
subtropical regions, most of which are developing countries, causing severe negative impacts
to food security [10, 11]. Since their identification the health and economic impacts of the
occurrence, legislation and prevention of aflatoxin in feed and food have been well
documented [12-19]. The most significant step was in 1993 when the International Agency for
Research on Cancer (IARC) classified ‘naturally occurring mixes of aflatoxins’ as a Group 1
carcinogen, meaning that sufficient evidence exists to link aflatoxin exposure to cancer in
humans [20]. Aflatoxin exposure leads primarily to a condition known as aflatoxicosis, a
hepatic disease. Research suggests the exposure and susceptibility of individuals to aflatoxins
from food contamination varies considerably depending on geographical location, type of
diet, awareness of aflatoxin contamination, socioeconomic status, age, sex, nutritional status
and/or concurrent exposure to other causative agents such as viral hepatitis (HBV) or parasite
infestation. In animals, variations occur between species but aflatoxins are known to cause
liver damage, anaemia, jaundice, gastrointestinal dysfunction, reduced feed utilization and
efficiency with decreased milk and egg production, recurrent infection as a result of immunity
suppression (e.g. salmonellosis), reduced reproductively and embryo toxicity in animals
consuming low dietary concentrations. All ages are affected but to different degrees for
different species with the young most susceptible. Nursing animals may be affected as a result
of the conversion of aflatoxin B1 to the metabolite aflatoxin M1 excreted in milk.
To limit aflatoxin exposure, over 100 nations worldwide have set maximum tolerated levels of
aflatoxin in food [21]. These standards offer public health protection in industrialized nations,
but arguably have little effect in less developed countries through a lack of regulatory systems
for aflatoxin monitoring and control. The US Food and Drug Administration has established
specific guidelines on acceptable levels of aflatoxins in human food and animal feed by
establishing action levels that allow for the removal of violative lots from commerce. In the
US the action level for human food and cereals are 20 ppb total aflatoxins, with the exception
of milk which has an action level of 0.5 ppb for aflatoxin M1. In Europe the maximum levels
of aflatoxins for food consumption are generally lower as laid down in the Commission
Regulation (EC) No 1881/2006, as amended by Commission Regulation (EU) No 165/2010 and
Commission Regulation (EU) No 1058/2012 [22-24]. Therefore, the maximum levels for
aflatoxin B1, the sum of aflatoxins B1, B2, G1 and G2 (known as Total) and aflatoxin M1 are
established therein varying with commodity and its use.
Aflatoxins have commonly been detected by their photo physical properties such as absorption and
emission spectra. Recent developments in the detection and determination for aflatoxins have been
reviewed highlighting the advantages and disadvantages between approaches [25]. In brief, the
analysis of aflatoxins in food and feed includes chemically based analytical methods such as the AOAC
thin   layer   chromatography    method,     capillary   electrophoresis,   high   performance    liquid
chromatography or liquid chromatography coupled to mass spectrometry. These methods are
primarily high cost requiring trained laboratory staff and facilities for accurate quantitative results.
Non-invasive spectroscopy or hyperspectral imaging-based methods demonstrate potential for
screening large samples contaminated with aflatoxins but cannot produce quantifiable results.
Immunological methods such as enzyme linked immunosorbent assays, lateral flow devices and
biosensor technology offer a low cost advantage but raise concerns in reliable repeatable detection
and identification of individual toxin analogues. Due to the poor economic status and low education
levels in developing countries, cost-effective quantifiable methods are required that will be easy to
implement. The ToxiMet System first described in [26] has now been developed further, involving the
introduction of new ToxiTrace and ToxiTrace cartridges and a substantially redesigned ToxiQuant
instrument, a spectroscopic device which simultaneously identifies and quantitatively measures the
individual aflatoxins by employing advanced spectroscopic and proprietary chemometric procedures.
The device is constructed with the understanding that radiation of certain wavelengths excites certain
mycotoxin contaminants such as aflatoxin to fluoresce. The wavelength of the emitted fluorescent light
from the contaminant is significantly different (usually longer) than the excitation wavelength. On the
theory that the amount of light emitted is proportional to the amount of the contaminant, a
measurement of the amount of light emitted can be utilized to quantify the amount of target
contaminant, such as aflatoxin, immobilized in a sample cartridge. Using the device involves the
extraction of a contaminant such as aflatoxin from food, the immobilisation of the contaminant as a
layer in a columnar packing, the illumination of the band, typically with UV radiation, at an applicable
wavelength to excite the emission of fluorescent light by the band, the detection of the fluorescence
and the conversion of the detected signal into a direct measurement of the concentration of the
contaminant (typically in parts per billion) [27].Therefore, the analytical sequence for the ToxiMet
System is composed of four main steps: sample extraction; sample clean-up (using the ToxiSep
cartridge); analyte immobilisation (on a ToxiTrace cartridge); followed by simultaneous measurement
of the individual, immobilised toxins by the ToxiQuant instrument, without the need for
chromatographic separation. The aim of the study was the comparative analysis of maize, rice and peanut samples and distillers grains for the determination of total aflatoxins concentration and individual analogues B1, B2, G1 and G2 to determine the feasibility of the ToxiMet system relative to state of the art LC-MS/MS. Materials and methods Materials Samples: Peanut paste (n=71), rice grains (n=88) and maize cracked and flour (n=79) samples (261-560 g each) used directly for human consumption were collected in the main markets of Abidjan, Bouaké and Korhogo in the Ivory Coast and kept at -20°C until sample preparation. Dried distillers grains (n=22) were sourced in Northern Ireland. All samples were analysed using both the Toximet System and UPLC-MS at the Institute for Global Food Security at Queen’s University, Belfast. Sample Preparation: Sample preparation was aimed at obtaining homogeneous samples. Frozen rice grain and cracked maize samples were milled in a grinder Retsch ZM 200 using a 1-mm sieve. The milled samples as well as the maize flour samples were homogenized during 30 minutes in a Chopin MR2L mixer. Peanut paste samples were thawed and homogenized during 15 minutes in a Thermomix VORWERK TM 21 by selecting the speed 2.5. The equipment was cleaned thoroughly between samples to prevent carry over contamination from sample to sample. Aliquots of the homogenized samples (70g) were kept at -20 C until mycotoxin analysis and the same aliquot was used for both methods of analysis in the study. ToxiMet System: ToxiSep and ToxiTrace cartridges were obtained from ToxiMet, UK. HPLC grade methanol, phosphate buffered saline (PBS) tablets (P4417) were purchased from Sigma Aldrich. Whatman No 41 and GF/A filter paper were obtained from GE Healthcare. UPLC-MS/MS: LC-MS grade acetonitrile (ACN) (34967-2.5L); LC-MS grade methanol (34966- 2.5L); formic acid for mass spectrometry 98 % (94318-50mL-F), ammonium hydroxide solution ≥25% in water (44273-100mL-F), magnesium sulphate ≥99.5% (M7506-500g), DMSO ≥99.9% (D8418-50mL) and amber vials (27000), Aflatoxins B2, G1, G2 and M1 were obtained from Sigma-Aldrich (Dorset, UK). Aflatoxin B1 was from Romer Labs (Tulln, Austria). A Bondesil C18 40 µm (29041013) was purchased from Agilent (Berkshire, UK). PTFE syringe filters
(WHA67840402 Whatman Puradisc 4 syringe filter 0.2 µm PTFE) and polypropylene tubes
(50mL and 15mL) (TPPA91051) were obtained from VWR. Sodium chloride (S/3120/53) was
obtained from Fischer chemicals. The water used was supplied from an in-house 18 MΏ
Millipore water system, Millipore Ltd, (Hertfordshire, UK).

Methods

ToxiMet System Analysis

Sample extraction: Each sample (25g) was mixed with sodium chloride (2.5g) followed by the
addition of deionised water (40mL) and blended for 2 minutes in a Sterilmixer 12 blender. The
blender was cleaned thoroughly between each sample. Methanol HPLC Grade (60mL) was
then added and blended into the mixture. The solution was filtered through Whatman No 41
filter paper and an aliquot of extract (20mL) was diluted with PBS solution (40mL) and mixed.
This solution was then filtered through Whatman GF/A filter paper.

ToxiSep Clean Up Procedure: The ToxiSep cartridges were allowed to settle in an upright
position for one hour at room temperature and positioned on a vacuum manifold. The red cap
of the ToxiSep Aflatoxin cartridge was removed, the column tapped until the air bubbles
dislodged and travelled to just underneath the frit. An air tight seal was formed. The lower
cap was removed with the adaptor and reservoir fitted to the ToxiSep clean-up cartridge. An
aliquot of the extract solution (24mL) was added slowly to the reservoir and allowed to pass
through the ToxiSep cartridge at a flow of 3mL/min. The cartridge was then washed with PBS
(20mL) at a flow of 5mL/min. Excess PBS was removed under high vacuum from the ToxiSep
cartridge for 2-5 seconds. The retained aflatoxins were eluted into an amber volumetric flask
(10mL) using methanol HPLC grade (1mL) followed by 1ml of water at a flow rate of 1 drop
per second. The extract was diluted to 10ml on addition of water to the volumetric flask. The
diluted elute was filtered through a 25mm syringe filter. The first 2mL was discarded into the
waste beaker and the remainder collected into a 10ml amber flask.

ToxiTrace Immobilisation: The ToxiTrace cartridge was conditioned with methanol HPLC grade
(0.2mL) followed by 10% methanol (0.2mL). An aliquot of the filtered sample extract (2.0mL)
was loaded onto the column which was then washed using 10% methanol (0.4mL). The
washing was complete when 50% of the solvent had passed through the cartridge.
Quantification: The Toxitrace cartridge was plugged and inserted into the ToxiQuant instrument (ToxiMet, UK) within one hour of preparation and analysed for aflatoxins by selecting the specific commodity from the on-screen menu. For dried distillers grains there was no specific option for the analysis of this sample type therefore there these samples were analysed using the option of maize. The aflatoxin results B1, B2, G1, G2 and total aflatoxins are recorded for each sample immediately. UPLC-MS/MS Analysis Sample preparation: The sample preparation was based on the QUEChERS method [28,29] with some modifications [30]. Briefly, 1 g of homogenised sample was soaked with 5 mL of 2 % formic acid in water for 30 min followed by vortex mixing with 5 mL of acetonitrile using a DVX-2500 multi-tube vortexer set at a speed of 1000 for 30 min. The separation of the water from organic phase was achieved by addition of 2 g of magnesium sulphate and 0.5 g of sodium chloride and hand shaking for 30 sec followed by 5 min centrifugation at 4000g. The upper organic layer (2mL) was further purified by shaking for 30 sec with 0.1 g C18 silica sorbent and 0.3 g of magnesium sulphate. After centrifuging at 4000g for 1 min, an aliquot of extract (1mL) was transferred to a MS vial and DMSO (200L) added. The solvent was evaporated off under nitrogen for approximately 45-60 min at room temperature. LC-MS/MS grade methanol (800L) was added and the sample filtered using a 0.22 m filter. Calibration: Matrix matched calibration curves were prepared with each batch of samples and used for calibration. Blank maize flour, rice flour and peanut paste samples previously tested and confirmed free from aflatoxins were used. An 8 point standard calibration curve in the range 0 to 50 µg/kg is prepared by spiking known blank materials with aflatoxin working solutions before extraction. UPLC-MS/MS: A Waters Acquity UPLC system coupled to Waters Xevo TQ-S triple quadruple mass spectrometer was used (Waters, Milford, USA). The data were analyzed using TargetLynx software. The column used was CORTECS UPLC C18 1.6 µm, 2.1 ×100 mm (Waters, Milford, USA). The mobile phase A was 1 mM ammonium formate pH 6.5 in Milli-Q water and mobile phase B was 1 mM ammonium formate in methanol:acetonitrile (50:50). The gradient elution at a flow rate 0.4 mL/min started at 1 % mobile phase B and increased linearly to 99 % in 10
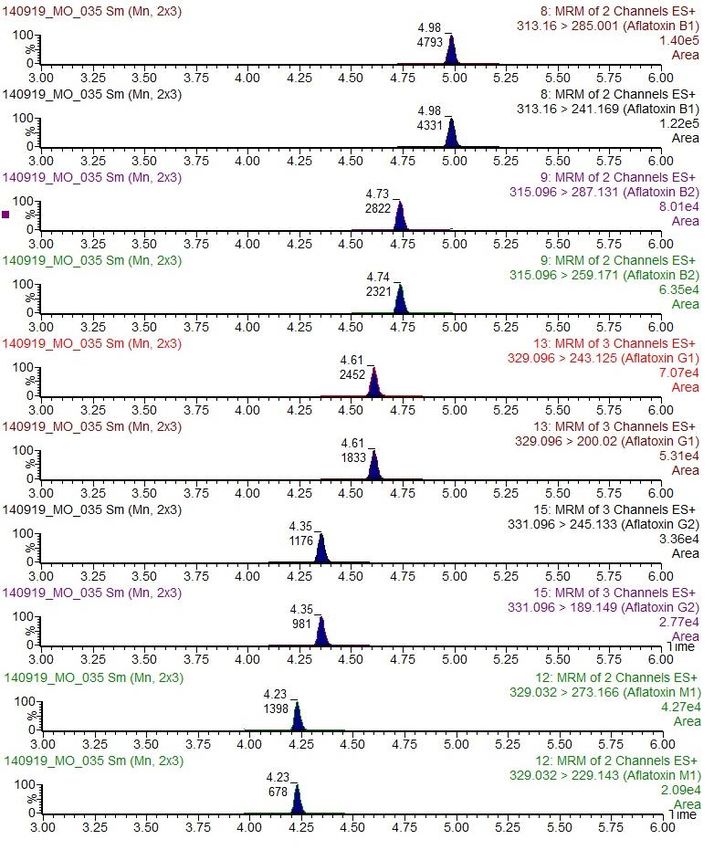
minutes, followed by 4 min equilibration. The injection volume was 1 µL. The mass
spectrometer was operated in the positive electrospray ionization mode and the parameters
were as follows: capillary voltage 1.5 kV, source temperature 150°C, desolvation temperature
500°C, desolvation gas flow 1000 L/h. The MS/MS conditions for aflatoxins are presented in
Table 1 and Figure 2 shows the retention time separation and multiple reaction monitoring
(MRM) transitions of the 5 aflatoxins (B1, B2, G1, G2 and M1) using UPLC-MS/MS. The toxins
were quantified by interpolation from a matrix-matched calibration curve (spiked before
extraction so results were corrected for recoveries). For samples whereby the toxin
concentration was above the upper calibration range these were diluted in blank matrix and
re-analysed.

Results and discussion

As aflatoxins are reported to be genotoxic carcinogens, it is important to limit their total
content in food and animal feed by complying with legislation for given commodities.
Considering that European legislation includes limits for the most toxic aflatoxin B1 alone and
the total aflatoxins (sum of aflatoxins B1, B2, G1 and G2) these are of primary focus for any
method of analysis. On deciphering the ability of a method to be fit for purpose in a given
environment a number of factors need to be considered including: accuracy; limit of
detection; application to multiple analytes; versatility; time of analysis; cost; ease of use; low
maintenance, repeatability and robustness. Key parameters were considered for both the
ToxiMet system and UPLC-MS/MS instrument applied in this study (Table 2). The benefits of
the ToxiMet system, compared with UPLC-MS/MS, included its ability to rapidly and
simultaneously determine each of the individual aflatoxins, using unskilled personnel working
outside of the laboratory environment. Additional benefits were the avoidance of the need
for internal and analytical standards and low capital and maintenance costs as compared to
the UPLC-MS/MS equipment. The benefit of the UPLC-MS/MS, in addition to being the
regulatory method of choice, was the versatility to include other toxins within the analysis of
the sample. Nonetheless, the individual determination of aflatoxins B1, B2, G1 and G2 in
peanuts, maize, rice and distillers grain samples was shown to be feasible for both methods.
The UPLC-MS/MS had the added ability of M1 determination (Supplementary Data). Table 3
summarises the range of the individual toxin concentrations determined by ToxiMet system
and UPLC-MS/MS analysis for each food and feed commodity. In general the upper limit of the range for the toxin concentration determined by UPLC-MS/MS was higher than for the ToxiMet system. Although the same lot was analysed by both methods these differences in range could be in part due to the variation in sample size from 1g to 25g taken from the lot as due to the heterogenic nature of mycotoxins this can be critical. Some of these challenges in sampling procedures to detect mycotoxins in agricultural commodities have been well described [31]. On each occasion the ToxiMet system provided an immediate result and did not indicate that the aflatoxin concentration was above an upper limit of detection. However, when the result was beyond the calibration range for UPLC-MS/MS analysis the sample was diluted and re-analysed on the instrument. Recent recommendations provided by the manufacturer since the completion of this study of evaluation of the instrument indicate that a very high levels for a quantitative as opposed to a qualitative result if the sample concentration is greater than 30µg/kg the sample should be diluted and re-analysed in the same manner as for UPLC-MS/MS. Figure 3 shows the graphical correlation of the results of the Toximet versus UPLC-MS/MS analysis for total aflatoxins (B1, B2, G1, G2) and for B1 determination in rice, maize, peanuts and dried distillers grains. The number and percentage of samples defined to be above the European regulatory limits for each sample type was compared between methods (Table 4). Rice Samples: For rice included under the EU legislation 165/2010 whereby all cereals and all products derived from cereals, including processed cereal products have the limits of 2.0g/kg for aflatoxin B1 and 4.0 g/kg for total aflatoxins (Sum of B1, B2, G1, G2). However, an exception is for AFB1 in processed cereal-based foods and baby food for infants and young children where the regulated limit is 0.1 g/kg. Therefore, comparing the results from the ToxiMet system and UPLC-MS/MS analysis, 26 out of the 88 samples (29.5%) analysed by ToxiMet and 21 out of the 88 samples (23.9%) analysed by UPLC-MS/MS had their levels of aflatoxin B1 higher than the allowed legislation. For B1 analysis the variation arose in 5 samples (7RD2, 1RD3, 3RL3, 2RD4, 4RD4) which displayed results of 2.29, 2.48, 3.38, 2.15 and 2.24g/kg by ToxiMet and 1.11, 1.13, 1.95, 1.16 and 1.43g/kg by UPLC-MS/MS. For total aflatoxins 16 out of the 88 samples (18.2%) analysed by both ToxiMet system and UPLC-MS/MS were higher than the legislative limit. For total aflatoxins analysis the variation arose in four samples (2RL2, 3RL4,
9RL1, 1RL4) which displayed results of 2.24, 3.55, 4.08 and 5.05g/kg by ToxiMet compared to 4.61, 4.3, 3.21, and 3.88g/kg by UPLC-MS/MS respectively. As observed in Table 3 the range of aflatoxin concentrations and quantification in rice varies slightly between the two methods. The R2 correlations of the concentrations determined for B1, B2, G1, G2 and total aflatoxins are 0.90, 0.45, 0.90, 0.54 and 0.92 (Supplementary data). For B2 and G2 the correlation was poor as the number of positive samples were low and bordering on the limit of quantification for both methods. The concentration range for aflatoxin M1 in the rice samples as determined by UPLC-MS/MS was 0 to 0.82 g/kg with only 7 samples having measurable levels. Maize Samples: For maize included under the EU legislation 165/2010 whereby all cereals and all products derived from cereals, including processed cereal products have the limits of 2.0g/kg for aflatoxin B1 and 4.0 g/kg for total aflatoxins (Sum of B1, B2, G1, G2). Again, there is an exception for AFB1 in processed cereal-based foods and baby food for infants and young children where the regulated limit is 0.1 g/kg. Therefore, comparing the results from the ToxiMet system and UPLC-MS/MS analysis, 40 out of the 79 samples (50.6%) analysed by ToxiMet and 36 out of the 79 samples (45.6%) analysed by LC-MS/MS had their levels of aflatoxin B1 higher than the allowed legislation. For B1 analysis the variation arose in eight samples (2M1, 3M2, 4M4, 2FP4, 4FP4, 3F4, 2M5, 2F5) which displayed results of 2.23, 0.35, 1.57, 1.53, 0.92, 1.72, 1.87 and 1.25 g/kg by ToxiMet and 1.67, 4.21, 7.92, 2.02, 2.09, 3.13, 2.36 and 2.23 g/kg by UPLC-MS/MS. For total aflatoxins 46 out of the 79 (58.2%) samples analysed by ToxiMet and 40 out of the 79 (50.6%) samples analysed by LC-MS/MS were higher than the legislative limit. For total aflatoxins analysis the variation arose in six samples (4M2, 3M2, 7M3, 2M5, 7FP5, 2F5) which displayed results of 5.59, 1.85, 3.43, 2.42, 2.96 and 3.96 g/kg by ToxiMet and 3.11, 11.12, 4.33, 4.04, 5.29 and 7.17 g/kg by UPLC-MS/MS. Most samples showing variability between the two methods were very close to the action level with the ToxiMet showing marginally lower levels overall compared to the MS method. The main discrepancies were in B1 and G1 values which were higher by UPLC-MS/MS. As observed in Table 3 the range of aflatoxin concentrations and quantification in maize varies at the upper limits of quantification. The R2 correlations of the concentrations determined for B1, B2, G1, G2 and total aflatoxins in maize are 0.93, 0.51, 0.97, 0.77 and 0.94 (Supplementary data).
Similarly, for B2 and G2 the correlation was poor as the number of positive samples were low and bordering on the limit of quantification for both methods. The concentration range for aflatoxin M1 in the maize samples as determined by UPLC-MS/MS was 0 to 5.33 g/kg with 29 samples having measurable levels above the 0.05 g/kg EU level established for M1 in milk (Supplementary data). Peanut Samples: The EU legislation for groundnuts (peanuts) and processed products thereof intended for direct human consumption or use as an ingredient in foodstuffs is 2g/kg for aflatoxin B1 and 4g/kg for total aflatoxins. The peanut samples were provided as a homogenate paste which was to be used for direct human consumption. For the analysis the peanut samples were the most difficult to handle. Both the rice and maize samples were a homogenised powder, and as such were easier to aliquot from the sample container. However, the buttery consistency of the peanut samples was troublesome and required more time for the ToxiMet system filtration step. As the extraction solvent was a 60% methanol solution the aflatoxins would be soluble and pass through the filter but the fats less soluble clogging the filter. Therefore, comparing the results from the ToxiMet system and UPLC-MS/MS analysis, 70 out of the 71 samples (98.6%) analysed by both methods had their levels of aflatoxin B1 higher than the allowed legislation and similarly their levels of total aflatoxins higher than the legislative limit. The same single sample was below legislative limits for both methods (1PA4). As observed in Table 3 the range of aflatoxin concentrations and quantification in peanut varies at the upper limits of quantification. The R2 correlations of the concentrations determined for B1, B2, G1, G2 and total aflatoxins in peanuts are 0.22, 0.02, 0.005, 0.14 and 0.19 (Supplementary data). Although the qualitative comparison for peanuts was excellent relative to the legislative limit the correlation on quantification of the individual toxins was very poor due to samples with extremely high levels of aflatoxin contamination as determined by UPLC-MS/MS. As most samples were heavily contaminated it was impossible to examine the correlation relative to the low regulatory levels. When the quantitative R2 correlation was performed for those samples with a total aflatoxins concentration below 250 g/kg the performance was much improved. The R2 correlations of the concentrations determined for B1, B2, G1, G2 and total aflatoxins in peanuts for these samples was 0.88, 0.01, 0.90, 0.38 and 0.88. The most interesting point to note was the concentration range for aflatoxin M1 in
theses peanut samples as determined by UPLC-MS/MS was 0 to 381 g/kg with only 1 sample with no measurable M1 detected and all others well above the 0.05 g/kg level established for M1 in milk (Supplementary data). Dried distillers grains: The EU legislation for dried distillers grains for use as an ingredient in animal feed is 20g/kg for aflatoxin B1 and there is currently no regulation for total aflatoxins (Directive 2002/32/EC). Therefore, comparing the results from the ToxiMet system and UPLC- MS/MS analysis, none of the 22 samples analysed by ToxiMet or analysed by UPLC-MS/MS had their levels of aflatoxin B1 higher than the recommended EU legislation of 20g/kg. The R2 correlations of the concentrations determined for B1, B2, G1, G2 and total aflatoxins in these samples was 0.91, 0.004, 0.47, 0.31 and 0.70 with levels detected by the ToxiMet system generally half of those detected by UPLC-MS/MS. The concentration range for aflatoxin M1 in these samples as determined by UPLC-MS/MS was 0 to 0.78 g/kg with only 5 samples having no measurable levels. It should be noted that for the dried distillers grains there was no choice for selection of dried distillers grains on the ToxiMet system as a commodity for analysis and as such the proprietary calibrations applied were not specific for this matrix. Therefore, the closest commodity of maize was chosen for the calibration and variations in matrix between maize and dried distillers grains could affect the performance for this commodity. Improved correlations may be obtained if the ToxiMet system is calibrated for this feed material. The comparison of the testing platforms showed the key attributes, benefits and limitations (Table 2). For the food products collected from the Ivory Coast, the ToxiMet approach displayed a very good correlation with the state of the art confirmatory technique of UPLC- MS/MS for the qualitative detection of aflatoxin B1 and total aflatoxins at the European regulatory levels for these sample types. In relation to the quantification of aflatoxin there were significant discrepancies when the toxin levels were high as in the case of the peanut samples and for the B2 and G2 toxins. For the ToxiMet system there appeared to be no upper limit of detection and for all samples a concentration value was provided even if beyond the detection range. The variations in the B2 and G2 toxins may be due to the selectivity of the ToxiSep cartridge especially at high levels of total aflatoxins contamination. Additionally, at higher level of contamination the results might be underestimated as a portion of the aflatoxin target analytes might be lost during sample preparation when the ToxiSep cartridge reaches
its binding capacity. For the UPLC-MS/MS the use of the calibration curve showed the highly
contaminated samples to be off scale and re-dilution was applied where necessary. Other
discrepancies in quantification can arise in the homogeneity of the sample mass analysed, the
efficiency of the extraction procedures and in the preparation of the analytical standards for
the UPLC-MS/MS method. Although the sample was milled and thoroughly mixed the ToxiMet
system utilised a more representative 25g compared to 1g by the UPLC-MS/MS method
reducing the potential for toxin hotspots. Generally, the correlation trend of the UPLC-MS/MS
method to the ToxiMet system is that the UPLC-MS/MS method detected higher levels of B1
and total aflatoxins. Extraction procedures with multiple steps allow for error and for
untrained personal the methods should be as simple as possible. Both methods have solvent
based extraction steps with multiple steps for the operator though the ToxiMet system uses
only methanol as a solvent and overall is a relatively faster procedure. A major advantage of
the ToxiMet system is that analytical standards are not required. For the preparation of
calibration standards precision is required for highly sensitive detection methods as even
small error margins through solvent evaporation of the stock standard on preparation, storage
or pipetting can cause differences in response at the low levels of detection which can amplify
to significant differences in the toxin concentration in the sample. The use of internal
standards for mass spectrometry procedures would be the preferable option for precision
analysis though to date these are only available for certain analytes for mycotoxin analysis and
are highly expensive for routine use.

The samples collected in this study from the Ivory Coast were for direct human consumption
in the local community. These samples showed high levels of contamination of aflatoxins well
above the European regulatory limits in the order of severity of peanuts, maize and rice. To
prevent adverse human health effects from high levels of aflatoxin contamination food
choices in this region may be an important aspect whereby rice may have less risk for toxic
concerns due to the occurrence determined in this study. Innovative cost effective detection
can offer a means of prevention of contaminated products entering into the food chain but in
regions where food supply is more important than safety from chronic toxin exposure,
research and innovation must examine strategic mitigation strategies to ensure sufficient food
supply. Limitations of both methods currently lie in their ability to detect AFB1 in processed cereal-
based foods and baby food for infants and young children at the regulated limit is 0.1 µg/kg as the
LODs for B1 using the method are currently 0.5 µg/kg for UPLC-MS/MS and 0.2 µg/kg for ToxiMet. This
would potentially pose issues for these commodities unless minor modifications to the sample
preparation can be considered for increased sensitivity. Another current limitation of the ToxiMet
system is that it currently does not detect aflatoxin M1 or as in comparison to advanced LC-
MS/MS methods the simultaneous detection of other mycotoxins. The presence of aflatoxin
M1 in maize samples highly contaminated with aflatoxin B1 has been reported previously [32].
Similarly Huang and co-workers [33] found aflatoxins M1 and M2 in peanuts with the highest
content 64.7 and 3.6 µg/kg, respectively. This study highlights in agreement with previous
authors that aflatoxin M1 is not only an important contamination concern of milk but that
regulation should also be considered for foodstuffs such as peanuts and maize.

Conclusion

The ToxiMet system provides an alternative significantly lower cost approach compared to
mass spectrometry analysis in both instrumentation and maintenance costs and day to day
operation of the assay that would be useful for the prevention of highly contaminated
foodstuffs with aflatoxins entering the food chain. This type of technology could be suitable
for use as a highly accurate food safety monitoring tool in trading, distributing and processing
companies in emerging economies where contamination in key staple foods and major export
crops can be high as illustrated in this study for maize and peanut samples. Such a system can
be useful in laboratories for the determinations and removal of contaminated lots where there
are limited resources for highly expensive analytical equipment and trained staff. In
agreement with Yao et al 2015 an integrated approach which incorporates rapid sample
screening techniques with analytical methods may be most suitable for detecting aflatoxins in
consumables. A recommendation for future consideration is for the Toximet technology to
undergo a full inter-laboratory trial with the inclusion of certified reference materials against
other techniques. Though the inclusion of both methods of analysis in proficiency testing
schemes would help determine further the accuracy of each technique especially at key
regulatory levels.

Acknowledgements

This research was funded through the Advanced ASSET project, partly funded through
InvestNI and the European Sustainable Programme 2007-2013 under the European Regional
Development Fund. The authors would like to acknowledge the EuropeAid project 3CIvoire
which funded sample collection in the Ivory Coast, preparation of the samples and shipment
to Queen’s University Belfast for analysis. The authors would like to thank both Laurine
Engrand from the Graduate School of Life Sciences of Toulouse ENSAT in France and Elise Lapie
from Lasalle Beauvais Polytechnic Institute, France for the contributions to this work during
their student placement at the Institute for Global Food Security.
References

1.   Richard JL (2008) Discovery of aflatoxins and significant historical features. Toxin Reviews,
     27 (3-4) 171-201

2.   Da Costa CL, Geraldo MRF, Arroteia CC, Kemmelmeier C (2010). In vitro activity of neem
     oil on Aspergillus flavus growth, sporulation viability of spores, morphology and aflatoxin
     B1 and B2. Advances in Biosciences and Biotechnology 1: 292-299.

3.   Shehu K and Bello MT (2011) Effect of Environmental Factors on the Growth of Aspergillus
     Species Associated with Stored Millet Grains in Sokoto. Nigerian Journal of Basic and
     Applied Science, 19(2):218-223

4.   Ehrlich KC, Montalbano BG and Cotty PJ (2003) Sequence comparison of aflR from
     different Aspergillus species provides evidence for variability in regulation of aflatoxin
     production. Fungal Genetics and Biology 38: 63-74.

5.   Medina A, Rodríguez A, Sultan Y and Magan N (2015) Climate change factors and
     Aspergillus flavus: effects on gene expression, growth and aflatoxin production World
     Mycotoxin Journal, 8 (2): 171-179

6.   Carnaghan RB, Hartley RD, O' Kelly J (1963) Toxicity and fluorescence properties of the
     aflatoxins. Nature, 200, 1101.

7.   Razzaghi-Abyaneh M, Shams-Ghahfarokhi M, Peng-Kuang C (2010) Aflatoxins:
     Mechanism of inhibition by antagonistic plants and bacteria. (Eds)
     www.Intechopen.com/books/...586-304.

8.   De Longh H, Vles Ro, Van Peltj (1964) Milk of mammals fed an aflatoxin-containing diet.
     Nature 202, 466

9.   Holzapfel CW, Steyn PS, Purchase IF (1966) Isolation and structure of aflatoxins M1 and
     M2. Tetrahedron Letters 25, 2799

10. Strosnider H, Azziz-Baumgartner E, Banziger M, Bhat RV, Breiman R, Brune MN, DeCock
    K, Dilley A, Groopman J, Hell K, Henry SH, Jeffers D, Jolly C, Jolly P, Kibata GN, Lewis L, Liu
    X, Luber G, McCoy L, Mensah P, Miraglia M, Misore A, Njapau H, Ong CN, Onsongo MT,
    Page SW, Park D, Patel M, Phillips T, Pineiro M, Pronczuk J, Rogers HS, Rubin C, Sabino M,
    Schaafsma A, Shephard G, Stroka J, Wild C, Williams JT, Wilson D. (2006) Workgroup
    report: public health strategies for reducing aflatoxin exposure in developing countries.
    Environmental Health Perspectives; 114(12):1898–1903.

11. Enyiukwu D.N., Awurum A.N., Nwaneri J.A. (2014) Mycotoxins in Stored Agricultural
    Products: Implications to Food Safety and Health and Prospects of Plant-derived
    Pesticides as Novel Approach to their Management Greener Journal of Microbiology and
    Antimicrobials, 2 (3), 32-48
12. Miller JD (1999). Fungi and mycotoxins in grain: implications for stored products research.
Proceedings of the 6th international Working Conference on Stored Product Research. 2,
971-977.
13. Williams JH, Phillips TD, Joll PE, Stiles JK, Jolly CM and Aggarwal D (2004) Human
aflatoxicosis in developing countries: a review of toxicology, exposure, potential health
consequences and interventions. American Journal of Clinical Nutrition 80 (5), 1106-1122
14. Khlangwiset P and Wu F (2010) Costs and efficacy of public health interventions to reduce
aflatoxin–induced human disease. Food Additives and Contaminants Part A Chemical
Analysis Control and Exposure Risk Assessment 27 (7) 998-1014.
15. Wild CP, Gong YY (2010) Mycotoxins and human disease: a largely ignored global health
issue. Carcinogensis 31 (1) 71-82
16. Reddy KRN, Salleh B, Saad B, Abbas HK, Abel CA, Shier WT (2010) An overview of
mycotoxin contamination in foods and its implications for human health . Toxin Reviews
29 (1) 3-26
17. Marin S, Ramos A.J., Cano-Sancho G., Sanchis V (2013) Mycotoxins: Occurrence,
toxicology, and exposure assessment Food and Chemical Toxicology 60, 218–237
18. Razzaghi-Abyaneh M, Chang PK, Shams-Ghahfarokhi M and Rai M. (2014) Global health
issues of aflatoxins in food and agriculture: challenges and opportunities. Frontiers in
Microbiology, 5 (420) 1-3
19. Wu F. (2015) Global impacts of aflatoxin in maize: trade and human health. World
Mycotoxin Journal, 8 (2): 137-142
20. International Agency for Research on Cancer (IARC), 1993. IARC Monographs on the
Evaluation of Carcinogenic Risks to Humans: Some Naturally Occurring Substances: Food
Items and Constituents, Heterocyclic Aromatic Amines and Mycotoxins. IARC Scientific
Publications No. 56, IARC, Lyon, France.
21. CAST (2003) Mycotoxins: risks in plant, animal, and human systems. Ames, Iowa: Council
for Agricultural Science and Technology.
22. Commission Regulation (EC) No 1881/2006 of 19 December 2006 setting maximum
levels for certain contaminants in foodstuffs. Official Journal of the European Union
L364/5
23. Commission Regulation (EU) No 165/2010 of 26 February 2010 amending Regulation
(EC) No 1881/2006 setting maximum levels for certain contaminants in foodstuffs as
regards aflatoxins. Official Journal of the European Union L50/824. Commission Regulation (EU) No 1058/2012 of 12 November 2012 amending Regulation
(EC) No 1881/2006 as regards maximum levels for aflatoxins in dried figs. Official
Journal of the European Union L313/14
25. Yao H, Hruska Z, Diana Di Mavungu, J (2015) Developments in detection and
determination of aflatoxins. World Mycotoxin Journal, 8 (2): 181-191
26. Piletska E, Karim K, Coker R, Piletsky S (2010) Development of the custom polymeric
materials specific for aflatoxin B1 and ochratoxin A for application with the ToxiQuant T1
sensor tool. Journal of Chromatography A, 1217 (2010) 2543–2547
27. Coker RD, Nagler MJ, Andreou MP (2006) Device for detection and measurement of a target
compound such as a food toxin Patent number WO 2006123189 A2
28. Lacina, O., Zachariasova, M., Urbanova, J., Vaclavikova, M., Cajka, T., Hajslova, J. (2012)
Critical assessment of extraction methods for the simultaneous determination of
pesticide residues and mycotoxins in fruits, cereals, spices and oil seeds employing ultra-
high performance liquid chromatography-tandem mass spectrometry, Journal of
Chromatography A, 1262, 8-18.
29. Dzuman Z, Zachariasova M, Lacina O, Veprikova Z, Slavikova P, Hajslova J (2014) A
rugged high-throughput analytical approach for the determination and quantification of
multiple mycotoxins in complex feed matrices, Talanta, 121, 263-272
30. Oplatowska-Stachowiak M, Haughey SA, Chevallier O, Galvin-King P, Campbell K,
Magowan E, Adam G, Berthiller F, Krska R, Elliott CT (2015) The determination of
mycotoxin content in dried distillers grain with solubles (DDGS) using a multianalyte
UPLC-MS/MS method: Implications for the safe use of this alternative energy source in
animal feeds. Journal of Agricultural and food chemistry DOI: 10.1021/acs.jafc.5b03844
31. Whitaker TB, Slate AB, Doko MB, Maestroni BM, Cannavan A. Sampling procedures to
detect mycotoxins in agricultural commodities 2011 Springer Netherlands
32. Shotwell OL, Goulden ML, Hesseltine CW (1976) Aflatoxin M1. Occurrence in stored and
freshly harvested corn. Journal of Agricultural and Food Chemistry, 24 (3), 683-684
33. Huang B, Han Z, Cai Z, Wu Y, Ren Y (2010) Simultaneous determination of aflatoxins B1,
B2, G1, G2, M1 and M2 in peanuts and their derivative products by ultra-high-
performance liquid chromatography-tandem mass spectrometry. Analytica Chimica Acta,
662, 62-68Figure 1: Structures of aflatoxin analogues
Figure 2. Retention time separation and multiple reaction monitoring (MRM) transitions of
the 5 aflatoxins (B1, B2, G1, G2 and M1) using UPLC-MS/MS.
Figure 3: Comparison of UPLC-MS/MS and ToxiMet System Analysis total aflatoxins (B1, B2,
G1, G2) and B1 determination in rice (a, b), maize (c, d), peanuts (e, f) and dried distillers
grain (g, h).
Table 1. The MS/MS conditions for aflatoxins analysis

  Mycotoxin      Molecular    RT [min]        MRM          Cone     Collision     Dwell
                  weight                   transitions    voltage    energy     time [ms]
                                                            [V]       [eV]
 Aflatoxin B1      312.3        5.0        313.2>285.0*     44         20          4
                                            313.2>241.2     44         36          4
  Aflatoxin B2      314.3         4.7      315.1>287.1      68         24          4
                                            315.1>259.2     68         30          4
  Aflatoxin G1      328.3         4.6      329.1>243.1      14         26          4
                                            329.1>200.0     14         36          4
  Aflatoxin G2      330.3         4.4      331.1>245.1      12         28          5
                                            331.1>189.1     12         36          5
  Aflatoxin M1      328.3         4.2      329.0>273.2       2         42          5
                                            329.0>229.1      2         22          5
* Transition in bold was used for quantification.
Table 2: Comparison of testing platforms showing the key attributes, benefits and limitations
Attribute ToxiMet System UPLC-MS/MS
Aflatoxins B1, B2, G1, G2, M1
The current UPLC-MS/MS method operating in both
Analysis Aflatoxins B1, B2, G1 and G2 positive and negative mode and requiring sample
injection in two different mobile phases can detect a
total of 79 mycotoxins
B1: LOD: 0.20 LOQ: 0.67 B1 LOD: 0.05, LOQ: 0.25
Sensitivity B2: LOD: 0.12 LOQ: 0.40 B2 LOD: 0.125, LOQ: 0.25
G1 LOD: 0.125, LOQ: 0.25
(ppb) G1: LOD: 0.21 LOQ: 0.72
G2 LOD: 0.125, LOQ: 0.25
G2: LOD: 0.04 LOQ: 0.14 M1 LOD: 0.05, LOQ: 0.25
Very specific for Aflatoxins B1, B2, G1, G2, M1 but
Specificity Specific for Aflatoxins B1, B2, G1, G2, method can be expanded to include a high number of
mycotoxins for which standards were available
Skilled personnel with previous experience in LC-MS/MS
Method is relatively easy to use but
Ease of use methods and associated software for operation and
requires initial training.
interpretation of toxin profiles is required.
Amount of sample
25 1
(g)
Sample Extraction using QuEChERS
Centrifugation
Sample Extraction with filter clean up
C18 Silica sorbent clean up
Sample Preparation ToxiSep Clean Up with filter clean up
Centrifugation
ToxiTrace Immobilisation
Nitrogen Evaporation
Filtering
Number of samples
analysed in one
round of 20 30
preparation
Speed of analysis
< 1 hour 5 hours
per sample
Toxin Extraction: 2.5 hr Toxin Extraction: 4 hr
Speed of analysis ToxiQuant Instrument Analysis: Instrument Analysis: 19 hr aflatoxins only
for one round of 0.45 hr 38 hr all mycotoxins
samples Result Determination for 4 toxins: Result Determination: 2hr aflatoxins
Immediate (including interpretation to the calibration curve)
May be applied outside the
laboratory setting at different testing
Portability points along the food chain with Not possible
basic facilities to allow for sample
preparation
Relatively fast real time result, highly Accurate identification and quantification for compounds
sensitive, highly specific multiplex with available standards. Analytical standards grade or
Benefits analysis of four aflatoxins. There is no internal standards for aflatoxins are available but due to
requirement for the purchase or expense are not routinely used in analysis but are used
preparation of analytical standards. for instrument calibration.
Biosensor is relatively inexpensive Equipment is highly expensive and requires substantial
Limitations requiring little maintenance and very maintenance, requiring fully trained personnel for
limited training in use. operationTable 3: Range of aflatoxin concentrations determined by each method for each sample type
Method of B1 B2 G1 G2 Total M1
Sample Type
Analysis (g/kg) (g/kg) (g/kg) (g/kg) (g/kg) (g/kg)
ToxiMet 0 - 178 0 - 10.6 0 - 47.9 0.12 - 11.1 0.23 - 204.0 N/A
Peanuts
(n=71) UPLC-
0.63 - 4535 1.05 - 1098 0.72 - 2193 0.71 - 267.4 1.4 – 8094 0 – 381.1
MS/MS
ToxiMet 0 – 57.9 0 – 8.5 0 – 39.3 0 – 8.9 0.01 – 114.6 N/A
Maize
(n=79) UPLC-
0 – 80.5 0 – 7.0 0 – 83.6 0 – 3.8 0 – 172.7 0 – 5.3
MS/MS
ToxiMet 0.16 – 12.4 0 – 2.9 0 – 8.8 0 – 1.9 0.15 – 26.0 N/A
Rice
(n=88) UPLC-
0 – 14.1 0 – 1.1 0 – 16.6 0 – 0.9 0 – 32.7 0 – 0.8
MS/MS
Dried distillers ToxiMet 0-5.5 0-2.8 0-1.2 0.1-0.4 2.7-7.3 N/A
grains
UPLC-
(n=22) 0-12.5 0-3.7 0-2.9 0-0.5 0.6-16.5 0 – 0.8
MS/MSTable 4: Number of samples above the regulatory level by each method
Number of samples Number of samples above
Sample Type Regulatory level above the regulatory the regulatory levels by
levels by ToxiMet UPLC-MS/MS
B1
26 (29.5%) 21 (23.9%)
Rice (>2g/kg)
(n=88) Total
16 (18.2%) 16 (18.2%)
(>4g/kg)
B1
40 (50.6%) 36 (45.6%)
Maize (>2g/kg)
(n=79) Total
46 (58.2%) 40 (50.6%)
(>4g/kg)
B1
70 (98.6%) 70 (98.6%)
Peanuts (>2g/kg)
(n=71) Total
70 (98.6%) 70 (98.6%)
(>4g/kg)
Dried distillers B1
0 0
grains (n=22) (>20g/kg)You can also read