Evaluating Hierarchical Diversity and Sustainability of Public Transport: From Metropolis to a Weak Transport Demand Area in Western Japan
←
→
Page content transcription
If your browser does not render page correctly, please read the page content below

ORIGINAL RESEARCH
                                                                                                                                                  published: 31 May 2021
                                                                                                                                           doi: 10.3389/frsc.2021.667711

                                              Evaluating Hierarchical Diversity and
                                              Sustainability of Public Transport:
                                              From Metropolis to a Weak Transport
                                              Demand Area in Western Japan
                                              Ryota Nakase, Chun-Chen Chou, Yasuchika Aoki, Kento Yoh and Kenji Doi*

                                              Department of Civil Engineering, Division of Global Architecture, Graduate School of Engineering, Osaka University, Osaka,
                                              Japan

                                              A variety of transport options must be utilized to enhance public transportation
                                              sustainability. Previous studies have rarely developed quantitative methods for evaluating
                                              the performance of transport diversity. Thus, this study proposes measurement indicators
                                              to evaluate transport diversity on the basis of biodiversity indicators. For the hierarchy of
                                              public transport networks, we considered that the public transport system is analogous
                                              to ecosystems with a taxonomic hierarchy. The number of operation stations, route
                                              length, and operating frequency were used to evaluate the spatial and temporal coverage
                             Edited by:       of the transport services. We analyzed the latent correlation between transport diversity
               Kh Md Nahiduzzaman,            and sustainable transport indicators and then examined the spatial distribution of
         University of British Columbia
                                              transport diversity. By visualizing the spatial distribution of transport diversity, we found
                   Okanagan, Canada
                                              that high-speed railway stations are instrumental in the hierarchy of public transport
                        Reviewed by:
                       Luis A. Guzman,        networks. Furthermore, improving diversity would increase the modal share of public
    University of Los Andes, Colombia         transport, which is considered crucial for developing sustainable transport, especially
                          Uneb Gazder,
        University of Bahrain, Bahrain        in the period of depopulation. Finally, this paper presents a demonstration experiment
                 *Correspondence:             conducted in a regional city that introduced a variety of transport services integrated on
                             Kenji Doi        a MaaS platform, attempting to provide a multimodal and seamless mobility service in a
           doi@civil.eng.osaka-u.ac.jp
                                              weak transport demand area.
                    Specialty section:        Keywords: public transport, sustainability, diversity index, hierarchical structure, high-speed railway
          This article was submitted to
            Sustainable Infrastructure,
                a section of the journal      INTRODUCTION
         Frontiers in Sustainable Cities

         Received: 14 February 2021           Owing to the accelerated development of aging and shrinking population in Japan, the age
            Accepted: 03 May 2021             composition of the people in the country has drastically changed. The problem of protracted and
            Published: 31 May 2021            significant population loss makes the provision of public transport increasingly difficult, especially
                              Citation:       in rural areas. A heady discussion relates the concept of sustainable development to transportation
  Nakase R, Chou C-C, Aoki Y, Yoh K           (Ministry of Land, Infrastructure, Transport and Tourism, 2020a). According to the (Ministry
          and Doi K (2021) Evaluating         of Land, Infrastructure, Transport and Tourism, 2020b,c), the efficient resource allocation of
             Hierarchical Diversity and
                                              various transport modes can reduce operating costs, accommodate diverse needs and preferences
    Sustainability of Public Transport:
 From Metropolis to a Weak Transport
                                              of users, and encourage the maintenance of a wider public transport network. Increasing diversity
     Demand Area in Western Japan.            in transport systems by providing a variety of transport options supports the development of
     Front. Sustain. Cities 3:667711.         sustainable transport. Despite the need for evaluation measures, the literature has rarely developed
      doi: 10.3389/frsc.2021.667711           measurement indicators that can assess the performance of transport diversity.

Frontiers in Sustainable Cities | www.frontiersin.org                                1                                              May 2021 | Volume 3 | Article 667711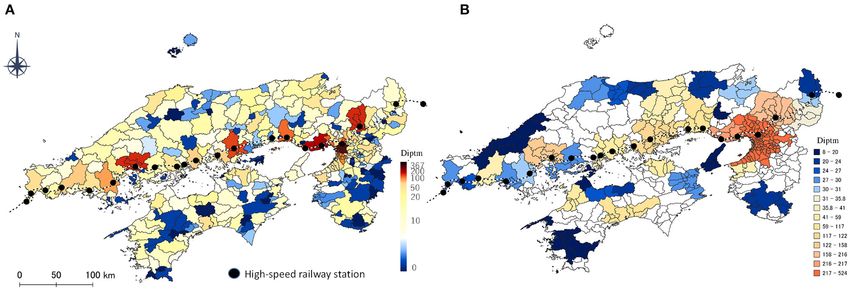
Nakase et al.                                                                                                 Diversity and Sustainability of Transport

   Thus, this study attempts to establish quantitative indicators         usage of public transport services, adds value across multiple
that can be deployed to evaluate the diversity of urban transport         perspectives, and enriches collaboration in the system.
systems in consideration of transport sustainability. To examine              There is a limited number of studies specifically focusing on
transport diversity, it is important to identify the role and             the transport diversity as a measure to evaluate urban transport
characteristics of each transport mode in the network, rather             systems (Pareekh et al., 2017). Many studies have been conducted
than counting the number of modes present. For instance,                  on transport network performance measurements (Nakagawa
intercity rail services cover longer distances than intracity             et al., 1994; Aratani and Todoroki, 2010; Nezu et al., 2013).
transit, and personalized transport has higher mobility than              Most of these studies aimed to derive the effects of infrastructure
mass transit, whereas mass transit has a better capacity. In              investment, focusing on its impact on regions. For example,
this research, we characterized the hierarchical structure of             Nakagawa et al. (1994) examined railway network performance
public transport as analogous to the ecological hierarchy, aiming         from the perspective of accessibility. With the indicator “staying
to concretize and quantify the concept of a hierarchy of                  time” used, the level of social interaction between cities was
transport diversity.                                                      compared to their railway networks. In addition, the benefits
                                                                          of a high-speed rail (HSR) system on the regional economy
                                                                          and urban mobility were highlighted (Aratani and Todoroki,
LITERATURE REVIEW                                                         2010; Nezu et al., 2013). Network performance measurements
                                                                          have mainly been conducted on railway services in previous
Measuring Diversity and Sustainability in a                               studies. Nonetheless, the evaluation should be conducted at the
Public Transport Network                                                  network level, as transport is provided by an integrated system.
Though the common identified definition of sustainability is              Despite the evaluations of the social impact of infrastructure,
not available, there is growing interest in the concepts of               the examination of the public transport system itself has rarely
sustainable development, indicators and measures for sustainable          been discussed.
transport planning (Litman, 2016). Transportation Research                    Litman (2017) defines Transport Diversity as “the variety
Board (1997) interpreted sustainable transport as “it is about            of mobility and accessibility options available in a particular
how environmental, economic, and social systems interact to               situation, including various modes, services, and destinations.” A
their mutual advantage or disadvantage at various space-based             variety of transport options help cities with diverse populations
scales of operation.” To access sustainability of urban transport         to cater to their diverse mobility needs, supporting the
systems, Doi and Kii (2012) conducted an impact analysis of               realization of sustainable urban transport. Increasing diversity
public transport and land use strategies for all of 269 urban             in public transport has not only contributed to the availability
areas in Japan. The influence of compact city planning on the             of transport services but also increased system efficiency,
sustainability of public transport was evaluated by indicators,           equity, and resilience (Litman, 2017; Rahimi-Golkhandan et al.,
including financial balance of public transport operation, user           2019). Several studies have attempted to approach the concept
benefits, and CO2 emissions reduction. Despite the results                of diversity in public transport in recent years. Feng and
obtained from quantitative analysis, the essence of public                Hsieh (2009) developed a conceptual framework to explore
transport was ignored as the simplifying objects were applied.            the relationships among transport diversity, sustainability,
Public transport consists of a variety of modes and services with         and quality of life. Evaluating diversity from stakeholders’
different characteristics and functionalities. The public transport       perspectives, it was suggested that diversity could assist planners
service is interdependent with other infrastructure and provides          in resource allocation to improve sustainability and quality of
a critical connection for residential and business activities             life by investing the infrastructure or service in areas with the
in an urban context. For sustainable transport assessment, it             least diversity. For a better understanding of transport diversity,
is necessary to further characterize the transport system by              Pareekh et al. (2017) employed an exploratory factor analysis
considering all modes.                                                    to reveal the latent structure underlying this concept. With a
    Providing public transport service with diverse options               sample of 51 cities with various demographic characteristics,
extends citizens’ freedom of choice. With the aim to broaden              factors such as public transport modal share, city population,
citizens’ freedom of choice in mobility, United Nations (2007)            and smart infrastructure were proven to positively influence
emphasized the development of a wide range of policies and                transport diversity. However, there remains a need for multiple
opportunities for sustainable transport. More choices lead to             quantitative and qualitative approaches to measure transport
better choices, being considered an important device to increase          diversity (Pareekh et al., 2017).
well-being (Weikard, 1996). Sustainable transport is expected                 A few studies have linked ecological diversity to transport
to not only cater diverse mobility needs of a society but also            diversity (Feng and Hsieh, 2009; Amoaning-Yankson and
improve the welfare of people and their communities. Mobility             Amekudzi-Kennedy, 2017; Hatoko, 2019; Rahimi-Golkhandan
users ought to be able to select their optimal mobility from              et al., 2019). For resilience assessment of transport infrastructure,
among several alternatives. A diverse transport system promotes           Amoaning-Yankson and Amekudzi-Kennedy (2017) confirmed
freedom of choice, enabling better mobility choices of users              the similarity among ecological, social and economic systems,
by providing better access to other services and opportunities.           applying the ecological concepts to transport system resilience.
The transport system consists of various modes referred to as             Hatoko (2019) employed a biodiversity index to evaluate
multimodal transport. A multimodal system enables efficient               diversity in regional functionalities. The relationship between

Frontiers in Sustainable Cities | www.frontiersin.org                 2                                        May 2021 | Volume 3 | Article 667711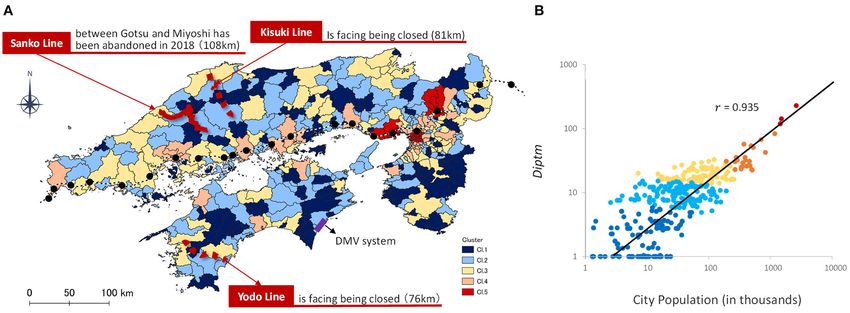
Nakase et al.                                                                                                                Diversity and Sustainability of Transport

various regional characteristics (e.g., industrial composition
and employment opportunities) and the level of community
interaction represented in the transport network (e.g., passenger
volumes of intercity transits) were examined. However, this
research focused on the diversity of regional functionalities
without assessing transport diversity. Feng and Hsieh (2009)
adapted the ecological diversity concepts of richness and
evenness to characterize transport diversity in their conceptual
framework. To improve the resilience of transport infrastructure
under increasing demand resulting from rapid urbanization,
Rahimi-Golkhandan et al. (2019) further explored these two
measures of functional richness and functional evenness and
translated them to transport infrastructure as a predictor of
system resilience. Nonetheless, there is a lack of studies to
                                                                                      FIGURE 1 | Definition of taxonomic distance.
characterize and quantify transport diversity with concrete and
well-defined metrics. With the aim to bridge the gap, this research
seeks to conduct a complete study of both quantitative measures
with the numerical usage data and qualitative insights on the                        two species reflects their similarity, giving a weight (wij ) in
nature of various public transport modes.                                            the formulation.

Taxonomic Diversity Indices
Research on diversity has long been of interest in the field of                      MATERIALS AND METHODS
biology. With numerous measurements of biodiversity having
been developed, we adopted the interpretation of Ohgaki (2008)
                                                                                     Applying Taxonomic Hierarchy to Public
as a reference. The traditional diversity indices, such as Shannon                   Transport Classification
entropy and Simpson’s index, are computed using the number of                        To present the abundance of all transport modes in the
species and their proportions. Nevertheless, these indices cannot                    community, diversity was assessed based on their functionalities.
account for taxonomic relatedness between species. Consider                          Diverse transport modes have different functionalities. For
the following examples: (1) There are savanna, forest, Indian,                       example, railways demonstrate the advantages of high speed and
and Ceylon elephants. (2) There are elephants, zebras, tigers,                       punctuality, despite that most users find it easier to access bus
and lions. For both cases, the degrees of diversity were both                        stops than rail stations. A public transport network comprising
evaluated as four species. Given the hierarchical structure of                       a variety of modes contributes to a high overall functional
ecosystems, different weights should be assigned corresponding                       performance level of the services. In this study, we applied a
to their similarity.                                                                 taxonomic hierarchy to classify public transport modes based on
    Warwick and Clarke (1995) proposed new biodiversity                              their characteristics and functionalities.
indices. As shown in Figure 1, the new concept captures the                             As mentioned previously, we first considered the classification
structure of not only the distribution of abundances among                           of all public transport modes. In comparison with the taxonomic
species but also their taxonomic relatedness. The taxonomic                          hierarchy, which today has eight ranks from specific to general,
distance between species i and j is defined as:                                      (species, genus, family, order, etc.), the hierarchy of transport
    0, if they are the same species.                                                 modes has not been clearly defined. Figure 2A illustrates the
    1, if they are different species within the same genus.                          conceptual model for classifying the public transport. Transport
    2, if they are of different genera within the same family.                       modes can be grouped into three broad categories: land, water,
    3, if they are of different families within the same order.                      and air transport. Rail transit composed of a traced path was
    The biodiversity index (1∗ ) defined by Clarke and Warwick                       distinguished from road transport. For intercity transport, modes
(1998) is expressed as follows:                                                      were further divided depending on their operating speed. In
                                                                                     intracity transport systems, the right-of-way and node size in the
                   S P
                     S                         S P
                                                 S                                  network were further considered. The right-of-way establishes
          1∗ =
                   P                           P
                             ωij · ni · nj /             ni · nj i > j ,   (1)       the right in terms of priority to a traffic signal or road space.
                   i=1 j=1                     I=1 J=1                               For instance, the bus rapid transit (BRT) systems with dedicated
                                                                                     median lanes or exclusive bus lanes have a higher right-of-
where S is the total number of species present; ni and nj are the                    way than conventional urban bus service. The definition of a
total number of individuals in the samples of species i and j,                       four-level hierarchy and taxonomic distances of public transport
respectively; and wij indicates the “taxonomic distances” given                      classification is shown in Figure 2B.
to the path length linking species i and j in the hierarchical                          Initially, from a transport planning perspective, intercity
classification. For the double summation, i and j range over the                     transport and intracity transport differ significantly in their
S species; it can be reduced to the same statistic as S(S − 1)/2. In                 functional characteristics. The first level and the most general
Clarke and Warwick’s index, the expected path length between                         rank were thus defined as intercity and intracity networks.

Frontiers in Sustainable Cities | www.frontiersin.org                            3                                             May 2021 | Volume 3 | Article 667711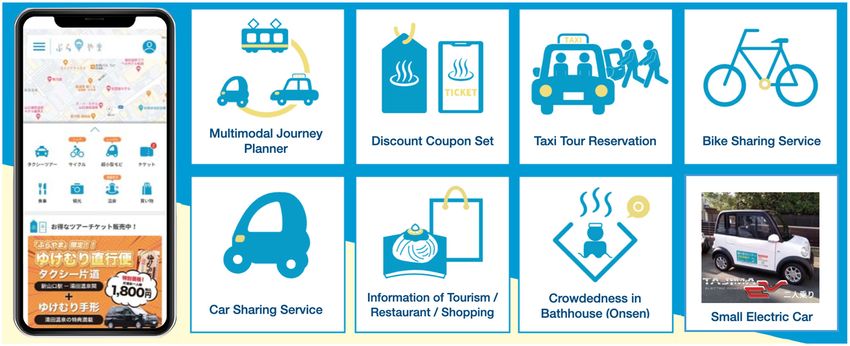
Nakase et al.                                                                                                                       Diversity and Sustainability of Transport

 FIGURE 2 | (A) Conceptual model to classify public transport. (B) Definition of taxonomic distance in a hierarchical structure of public transport.

Next, in the second level corresponding to family in taxonomic                              This study interpreted the evenness in transport diversity as
hierarchy, transport modes were divided depending on whether                            the spatial and temporal extent of public transport services. The
they were rail transit for both intercity and intracity networks.                       spatial extent consists of the number of operation stations and
In intracity transport systems, the BRT system, which is referred                       route length of transport services. An increase in the number of
to as the new transport system (NTS) in Japan, was also divided                         stations in an area makes the service more available and easier to
into the category of rail transit due to its exclusive right-of-                        access. As continuous data, route length has advantages in terms
way. Finally, the third level defined herein was also the most                          of precision and accuracy. In addition, for some long-distance
specific rank applied to our classification. For intracity transport,                   bus routes operated in barely inhabited areas such as mountains,
transport modes were further classified depending on whether an                         using both variables can avoid overestimation compared with
efficient network could be formed within a city. In other words,                        using route length only.
the node size of each transport mode, which indicates the number                            The temporal extent refers to the operating frequency of a
of stations, was examined. Additionally, for intercity rail systems,                    service, which is reflected in the timetable. For instance, the
we distinguished the high-speed railway (Shinkansen) from the                           Midosuji Line (Osaka Metro) in Osaka has a minimum headway
others. The bus services were categorized into the same group                           between 3 and 4 min. In contrast, the Geibi Line (JR conventional
in both intercity and intracity networks. Highway infrastructure                        line) in Hiroshima provides only three trains a day inbound to
was not discussed and included in the figures since this research                       Bingo-Ochiai. As shown above, there is a sharp contrast in the
focused on mobility measures.                                                           operating frequency of transport services provided in different
                                                                                        regions. The operating frequency of each service corresponds
Applying Biodiversity Index to Measure                                                  to the number of individuals per mode from the viewpoint of
                                                                                        temporal coverage.
Transport Diversity                                                                         The number of operation stations, route length, and
As discussed in the previous section, this section clarifies how
                                                                                        operating frequency (the spatio-temporal data) are employed
biodiversity indices can be applied to evaluate transport diversity.
                                                                                        to measure transport diversity in this paper. Nevertheless,
This study adopted a measure developed by Warwick and Clarke
                                                                                        some characteristics of the different transport systems differ
(1∗), which was introduced in section Taxonomic diversity
                                                                                        markedly. For example, stations in subway networks may be
indices. In Warwick and Clarke’s formulation, the measure of
                                                                                        much more than high-speed railway stations. To prevent the case
diversity considers the number of individuals per species to
                                                                                        mentioned and place different variables on the same scale, we
represent species evenness. The number of entities and operators
                                                                                        first standardized the data. The standardized spatial and temporal
involved in public transport might be used to calculate the
                                                                                        coverage of the transport service (ε) is defined as:
number of individuals of transport services. However, natural
monopolies are common phenomena in the markets, except
for some metropolitan areas, as transport is a capital-intensive                                                (
                                                                                                                       aix −aiave
industry. There remain questions regarding whether a transport                                                   1 + aimax  −aiave (ai > aiave )
                                                                                                          εix =        aix −aiave                                        (2)
service is expected to be offered by multiple operators.                                                          1 + aiave −aimin (ai < aiave )

Frontiers in Sustainable Cities | www.frontiersin.org                               4                                                May 2021 | Volume 3 | Article 667711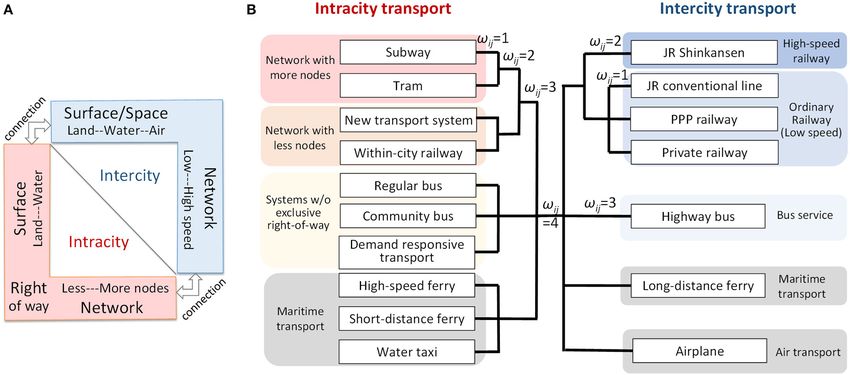
Nakase et al.                                                                                                        Diversity and Sustainability of Transport

 FIGURE 3 | Analytical framework.

To start the formulation illustration, we set up aix as the                       Analytical Framework
spatio-temporal data of transport mode i in city x. The                           Sections Introduction and Literature Review provided the broad
number of stations, route length, and number of trains (or                        background and the problem statement of this study. The
buses) departing per hour in one direction were inputted                          illustration of the approach to public transport diversity was
separately. For each transport mode, aimax , aimin , and aiave are                given in the last two sections. This section elaborates on the
the maximum, minimum, and average values, respectively. The                       analytical framework developed to address the research questions
service performances in the three aspects are calculated as εstation ,            and the data analysis plan (Figure 3).
εroute , and εdepart . The overall spatial and temporal coverage of                   To empirically quantify the concept of hierarchical transport
the transport mode in each city is evaluated as:                                  diversity, a measure of Diptm was applied to a study area
                                                                                  consisting of cities with diverse population size and a wide
                        εix station + εix route + 2εix depart
                                                                                 variety of public transport options. For a better understanding
                εix =                                               .   (3)       of the spatial distribution of diversity, we firstly visualized the
                                            4
                                                                                  calculated diversity value of each city. The potential influence
                                                                                  of the HSR network in a hierarchy of public transport was
Thus, the spatial and temporal weights are balanced. The
                                                                                  explored. Next, a correlation analysis was conducted to examine
difference in the spatial and temporal extents of each public
                                                                                  the association among transport diversity, human population,
transport service is well-reflected in the index (εix ). We set up
                                                                                  and public transport usage in the cities. To capture the features
the diversity index of public transport modes (Diptm) as:
                                                                                  of metropolises and weak demand areas, the cluster analysis
                                                                                  was performed. Cluster analysis is an effective and widely used
                              X S
                              S X                                                 method for analyzing multivariate data. It is an exploratory

                Diptmx =                wij · εix · εjx i > j ,         (4)       analysis used to describe a family of statistical procedures
                              i=1 j=1                                             specifically designed to discover classifications within complex
                                                                                  data sets (Tinsley and Brown, 2000).
where S is the total modes of public transport present in city x                      Aside from a city-based analysis, this study evaluated
and wij indicates the taxonomic distances between modes x and j                   transport diversity from the viewpoint of metropolitan areas,
in the hierarchical classification. Compared with Warwick and                     considering the influence of a central city on the suburban area.
Clarke’s formulation (1∗ ), the transport diversity index is not                  The degree of dependence of a UEA’s transport diversity on its
standardized by the number of species. This can be explained                      central city was examined.
by the fact that transport diversity is based on a complete
survey, rather than the sampling methods applied to investigate                   Study Area
biodiversity. In addition, spatial and temporal coverage was                      The study area is located in western Japan, including the
defined as a standardized indicator. In terms of the scale of each                Kansai (excluding Mie Prefecture), Shikoku, and the Chugoku
variable in Diptem, w is on a scale of 1–4, while ε ranges from                   regions. The diverse population of cities in selected areas
0 to 2. Accordingly, both the features of “hierarchy structure”                   forms city clusters with diverse transport needs. For instance,
and “species abundance” are not only well-reflected but also                      there are central metropolises in the Kansai region—Osaka, the
weighted equally.                                                                 conurbation—Kyoto, Osaka, and Kobe, regional central cities

Frontiers in Sustainable Cities | www.frontiersin.org                         5                                       May 2021 | Volume 3 | Article 667711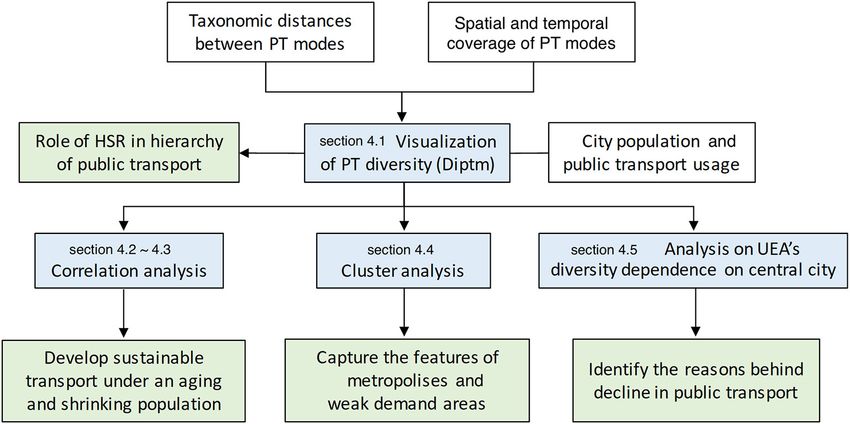
Nakase et al.                                                                                                  Diversity and Sustainability of Transport

with a population of over 500 thousand, and the regional core               not only strengthen the hierarchy of public transport networks
cities with a population of over 200 thousand. The sharp contract           but also improve the performance of other transport services in
between the growth in city centers (especially in Tokyo) and                the city.
shrinking suburbs has become more noticeable in the recent
decade. The population decline is supposed to result in a weak              Analysis on Transport Diversity,
transport demand in the selected area, making it increasingly
difficult to provide public transport services in the future.
                                                                            Population, and Public Transport Usage
                                                                            With the aging society and population decline in Japan, it has
    The air and maritime transport are excluded from the subject
                                                                            become difficult to maintain public transport in areas with
of this study since both of them are used relatively little for
                                                                            weak transport demand. Improving sustainability in a declining
passenger transport and accounted few for daily number of
                                                                            population is essential to ensure that older people can still
passenger journeys in the study area. Despite that a discussion
                                                                            enjoy a high quality of life. To investigate whether public
of maritime and air transport has not been included in the main
                                                                            transport diversity differed between cities and UEA with different
body, they were also contained in the hierarchical structure owing
                                                                            population size, a correlation analysis was conducted. Population
to the potential for future research.
                                                                            size data were based on the 2015 National Population Census
    Due to a relaxation of land use restriction, the urban areas are
                                                                            (Statistics Bureau of Japan, 2016). A Pearson correlation showed
formed beyond jurisdictional boundaries in many Asian cities
                                                                            that diversity had a significant positive relationship with the city
such as Japan. This study evaluated the hierarchical diversity
                                                                            population, with a correlation coefficient (r) of 0.935. Similarly,
and sustainability of public transport from the perspectives of
                                                                            a strong positive relationship was observed between the UEA
both cities and urban employment areas (UEA). The concept
                                                                            population and diversity (r = 0.959). The results suggest that
of UEA was proposed by Kanemoto and Tokuoka (2001), in
                                                                            the diversity of public transport is linked to human population
which an area consists of a central city and its associated outlying
                                                                            size. That is, a population decline may result in a reduction
municipalities (suburbs) with a certain number of commuters.
                                                                            in diversity.
A central city was defined as a municipality with at least
                                                                                Modal share is regarded as a critical component in the
10,000 densely inhabited district population. Municipalities with
                                                                            development of sustainable transport within a city. Regardless of
more than 10% of the population commuting to the central
                                                                            a declining population hitting especially hard in rural areas, the
city were defined as suburbs. In this study, 399 cities and
                                                                            growth of public transport use could be promoted by providing
48 UEA were examined. The difference between central cities
                                                                            effective and efficient services. To explore whether the modal
and suburbs related to public transport systems were taken
                                                                            share in a city was affected by diversity in public transport,
into consideration.
                                                                            a correlation analysis was conducted. A sample of 23 cities
Data Collection Method                                                      was collected from the 2015 Nationwide Person Trip Survey
The data used for the study included the number of stations,                (Ministry of Land, Infrastructure, Transport and Tourism,
route length, and timetable of each public transport service. The           2016). A Pearson correlation analysis indicated that there was
route length and station/stop information of rail and bus services          no significant relationship between modal share and diversity
were obtained from the Japanese National Land Numerical                     (r = 0.649).
Information (Ministry of Land, Infrastructure, Transport and                    We examined the relationship between diversity with city
Tourism, 2017, 2019a,b) and administrative boundaries dataset               population and the number of public transport users (modal
(Official Statistics of Japan, 2019). The timetables of each station        share times city population). In Figure 6, Osaka was set to 1,
were collected from the Yahoo Japan Transit information. As the             and the relative proportions for other cities were estimated. For
data were not available online for part of community bus services           cities with larger populations and higher diversity, compared
and demand responsive transport, the average value of 1 was                 with Osaka and Kobe, there is a tendency for less public transport
assigned to their spatial and temporal coverage.                            use to result from a lower level of diversity in Kyoto, Hiroshima,
                                                                            and Sakai (Figure 6A). In addition, cities with small populations
                                                                            and limited diversity tend to underperform in terms of public
RESULTS AND ANALYSIS                                                        transport usage (Figure 6B).
Role of High-Speed Railway in Hierarchy of
Public Transport                                                            Evaluating Transport Diversity From the
Figure 4A shows the spatial distribution of the diversity of public         Viewpoint of Metropolitan Areas
transport in cities, and Figure 4B depends on the UEA. The                  Next, the analysis was conducted from the viewpoint of the
visualization of spatial data illustrated that cities situated on the       UEA. For the central cities located in the Japan national axis
HSR corridor tended to have a higher diversity in their transport           zone, a significant positive relationship (r = 0.954) was observed
networks. To verify the influence of the HSR network on the                 between the modal share and average diversity per person
hierarchical diversity of urban transport, we reevaluated the               (diversity value divided by population size) (Figure 7).
diversity without considering Shinkansen. The findings showed                   In addition, the suburban cities in the UEA, formed by a
that despite the exclusion of the Shinkansen data from the                  central city with high diversity, tended to have better public
calculation, the cities where Shinkansen stations still had a higher        transport usage. To make it easier to understand, cities are
level of diversity (Figure 5). Accordingly, the Shinkansen can              listed in descending order of the modal share in Table 1.

Frontiers in Sustainable Cities | www.frontiersin.org                   6                                       May 2021 | Volume 3 | Article 667711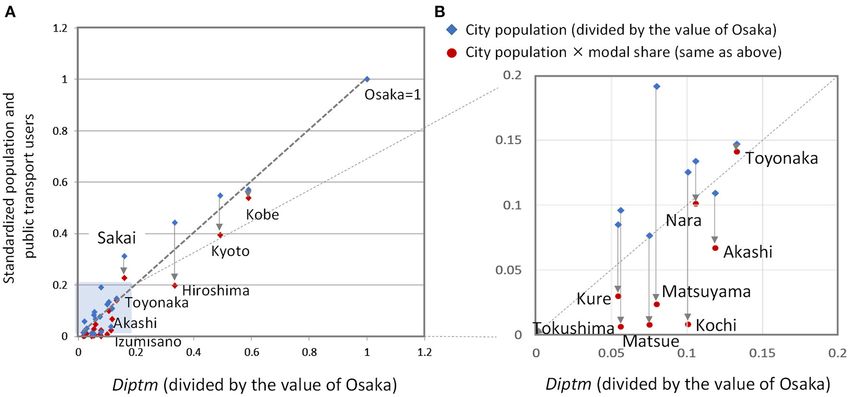
Nakase et al.                                                                                                           Diversity and Sustainability of Transport

 FIGURE 4 | (A) Diptm of cities in western Japan. (B) Diptm of UEA in western Japan.

 FIGURE 5 | Diptm of cities excluding the effects of high-speed railway.

Cities located in metropolitan areas, such as Toyonaka, Nara,                       Cluster Analysis to Capture Features of
and Uji, had a better modal share of public transport, despite                      Metropolises and Weak Demand Areas
that the estimated diversity was just average. Based on these                       Cluster analysis was performed to identify present issues and
results, we considered the effect of transport diversity in central                 discuss implications from the analytical results by allowing us to
cities on their associated outlying municipalities. The diversity                   better understand the unique combination of characteristics in
data of a suburban city were replaced with the average of                           city clusters. According to the results obtained in the last section,
the city’s diversity and its central city’s diversity. A significant                a major city impacts their suburban cities on public transport
positive relationship (r = 0.922) was observed (Figure 8). The                      usage. Cluster analysis was thus conducted twice depending on
results revealed that public transport usage in a suburban city                     whether the role of a central city in UEA was considered.
was affected by the transport diversity of the major city in                           Initially, the analysis was applied to identify homogeneous
the area.                                                                           city clusters based on the population and diversity estimated

Frontiers in Sustainable Cities | www.frontiersin.org                           7                                        May 2021 | Volume 3 | Article 667711
Nakase et al.                                                                                                                        Diversity and Sustainability of Transport

 FIGURE 6 | (A) Relationship between Diptm, city population, and public transport usage. (B) Cities shown near the origin (the blue area in Figure 6A).

                                                                                      TABLE 1 | Cities listed in descending order of the modal share.

                                                                                      City                  Diversity index           Modal share (%)             Central city

                                                                                      Osaka                       366.6                      35.5                 Osaka
                                                                                      Toyonaka                      48.7                     34.1                 Osaka
                                                                                      Kobe                        216.6                      33.5                 Kobe
                                                                                      Nara                          38.9                     26.8                 Osaka
                                                                                      Sakai                         58.6                     26.0                 Osaka
                                                                                      Kyoto                       180.5                      25.6                 Kyoto
                                                                                      Uji                           22.4                     24.6                 Kyoto
                                                                                      Izumisano                     41.7                     22.1                 Osaka
                                                                                      Akashi                        43.5                     21.8                 Kobe
                                                                                      Hiroshima                   122.4                      15.9                 Hiroshima
                                                                                      Kure                          19.9                     12.5                 Hiroshima
                                                                                      Omihachiman                   11.0                     12.0                 Higashiomi
                                                                                      Otake                         20.2                     10.0                 Iwakuni
                                                                                      Kainan                         8.1                       7.4                Wakayama
                                                                                      Soja                           9.1                       6.4                Okayama
                                                                                      Matsuyama                     29.3                       4.4                Matsuyama
 FIGURE 7 | Relationship between the modal share and the average Diptm per
                                                                                      Matsue                        27.6                       3.6                Matsue
 person in central cities.
                                                                                      Yasugi                         6.9                       3.3                Matsue
                                                                                      Nankoku                       29.0                       3.1                Kochi
                                                                                      Nagato                        17.4                       2.8                Nagato
in each city. The 399 cities in western Japan were divided into
                                                                                      Tokushima                     20.6                       2.4                Tokushima
five clusters (Figure 9). Clusters 4 and 5 were clusters with a
                                                                                      Kochi                         36.9                       2.3                Kochi
relatively high level in both population and diversity, whereas                       Imabari                        8.4                       1.7                Imabari
Clusters 1 and 2 had a lower level in population size and diversity.
Next, the role of a central city in UEA was taken into account.                       Notes: Central cities with the higher diversity (the top 4) were colored in Figure 1 to
                                                                                      highlight the fact that cities surrounding a central city with high diversity value tended
In cluster analysis, we considered variables including the city’s                     to have a higher modal share of public transport. In addition, the central cities colored
population and diversity, as well as the population and diversity                     were cities with a population size of over one million while the populations in the other
of UEA to which the city belongs. A sample of 48 central cities                       cities were all below one million.
was classified into six clusters. Ecl_1 (4 cities), Ecl_2 (3 cities),
and Ecl_3 (7 cities) were considered as clusters with a level of                      Analysis on Diversity Dependence of
diversity corresponding to their population size, whereas Ecl_4                       Metropolitan Area on Central City
(14 cities), Ecl_5 (13 cities), and Ecl_6 (7 cities) were clusters with               To measure the degree of dependence of a UEA’s transport
limited diversity relative to their population size. These results are                diversity on its central city, this study defined the diversity
discussed later in the next section.                                                  dependence on central city as:

Frontiers in Sustainable Cities | www.frontiersin.org                             8                                                   May 2021 | Volume 3 | Article 667711
Nakase et al. Diversity and Sustainability of Transport
hierarchy of transport diversity. We interpreted the evenness in
transport diversity as the spatial and temporal extent of public
transport services corresponding to the number of individuals in
biodiversity. With a clear definition of the transport hierarchical
structure, a biodiversity index was adapted to evaluate the
diversity in public transport systems. The measures developed
in this study can be deployed to other regions and countries.
Compared to a city-based analysis performed in the previous
study (Pareekh et al., 2017), this research further considered
the influence of a central city on the metropolitan area related
to public transport usage and diversity. The findings of this
paper are identified and discussed to provide implications for
sustainable transport planning.
First, the results suggest that the diversity of public transport
is linked to the city population. Owing to the shrinking
population in Japan, it has become difficult to fund and maintain
public transport links, especially in areas with weak transport
demand. To sustain public transport services, it is essential to
provide innovative and effective policies that consider the diverse
FIGURE 8 | Relationship between Diptm and modal share considering the
impact of central cities. characteristics of cities. Through cluster analysis of cities, the
features of areas with weak transport demand were captured.
Clusters 4 and 5 have a relatively high level in both population
and diversity and are considered able to sustain public transport
UEA’s diversity dependence on central city services in the future. Conversely, the cities in Clusters 1 and 2
may have challenges in maintaining effective transport services.
Diptemcentral /DiptemUEA To illustrate this point, a number of recent cases are presented in
. (5)
Pop.central /Pop.UEA Figure 9A. Some railway lines extended to cities in Cluster 1 or
Cluster 2 have been abandoned or are facing closure. Therefore, it
The numerator is a ratio calculated by dividing the diversity in the is especially important to provide innovative transport solutions
central city by the diversity in the UEA. To prevent a bias toward in areas with weak transport demand. For example, a dual-mode
cities with higher transport diversity, the ratio is divided by the vehicle (DMV) system, which can operate on both conventional
dependence of the UEA population on their central city. road surfaces and a railway track, has been introduced in
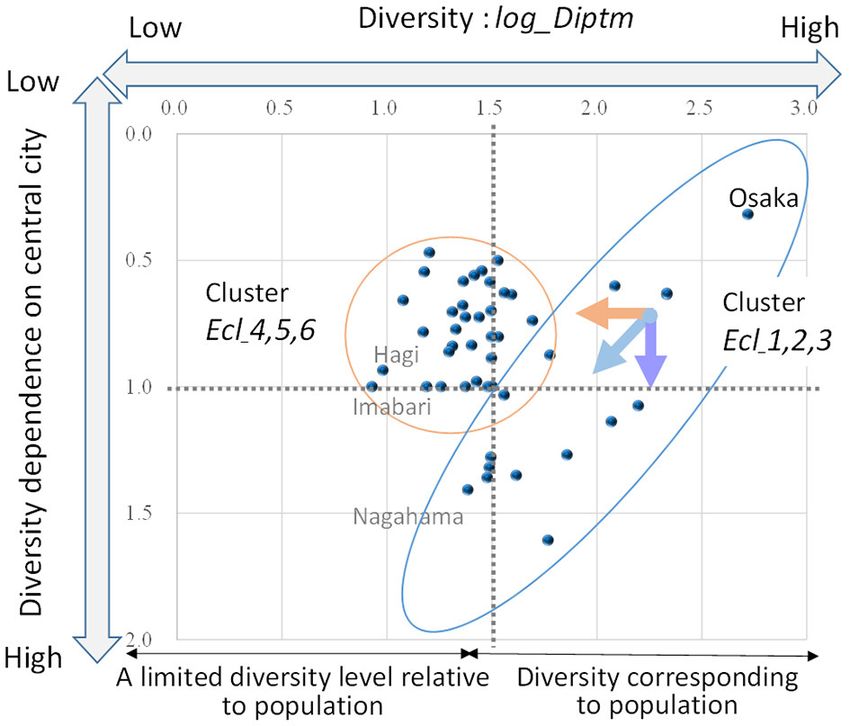
Figure 10 illustrates the relationship between the diversity in some rural areas in Tokushima Prefecture. The DMV system is
the central city and the diversity dependence of the UEA on expected to encourage tourism and ensure the travel demands of
the central city. A distinct difference was observed between the senior citizens. Cluster 3 is considered a critical cluster because
clusters derived in the previous section. First, for Ecl_1, Ecl_2, sustainable public transport can be realized due to appropriate
and Ecl_3, which have the level of diversity corresponding to their strategies implemented in these cities.
population, a decrease in diversity results from the population Second, cities located in the high-speed railway corridor
decline (as shown by the light blue circle in Figure 10). Second, tended to have higher diversity. The high-speed railway could
the light-blue vector can be divided into two components. The not only strengthen the hierarchy of the public transport
downward arrow indicates that when a central city maintains its network but also improve the overall performance of urban
diversity, an increase in diversity dependence on the central city transport services. However, among the cities situated on the
will result in a decrease in diversity in suburban cities. Finally, the Shinkansen corridor, Aioi (Cluster 1), Onomichi (Cluster 2),
leftward arrow indicates a decreasing diversity in central cities and Higashi-Hiroshima (Cluster 3) have a relatively lower level
and points to clusters Ecl_4, Ecl_5, and Ecl_6 (as shown in the of diversity. In addition, Yamaguchi (Cluster 3) is considered
orange circle). As these clusters have a limited diversity relative underperforming possibly because it is a prefectural capital as
to their population size, it can be interpreted that the decline in well as a central city of UEA with Shinkansen station stopped
diversity of public transport in these cities is more serious than by Nozomi (the super-express bullet train that only served
the decline in population. at the largest stations). The common feature in these cities
mentioned is that the Shinkansen stations are located far from
DISCUSSIONS AND CONCLUSIONS the city’s main station. Moreover, the lack of connections between
the urban transport network and high-speed railway makes it
This study attempts to empirically quantify the concept of difficult for the HSR service to function effectively. Consequently,
transport diversity in current cities. The findings of this to achieve connectivity between transport infrastructure, a
study substantiate previous studies suggesting that population multimodal transport planning is considered essential. This
and public transport modal share are positively related to finding is supported strongly by Litman (2017). For the purpose
transport diversity. This study’s contribution lies more with a mentioned above, a regional city—Yamaguchi has conducted a
concrete and well-defined metric to concretize the concept of a demonstration experiment to promote its public transport usage
Frontiers in Sustainable Cities | www.frontiersin.org 9 May 2021 | Volume 3 | Article 667711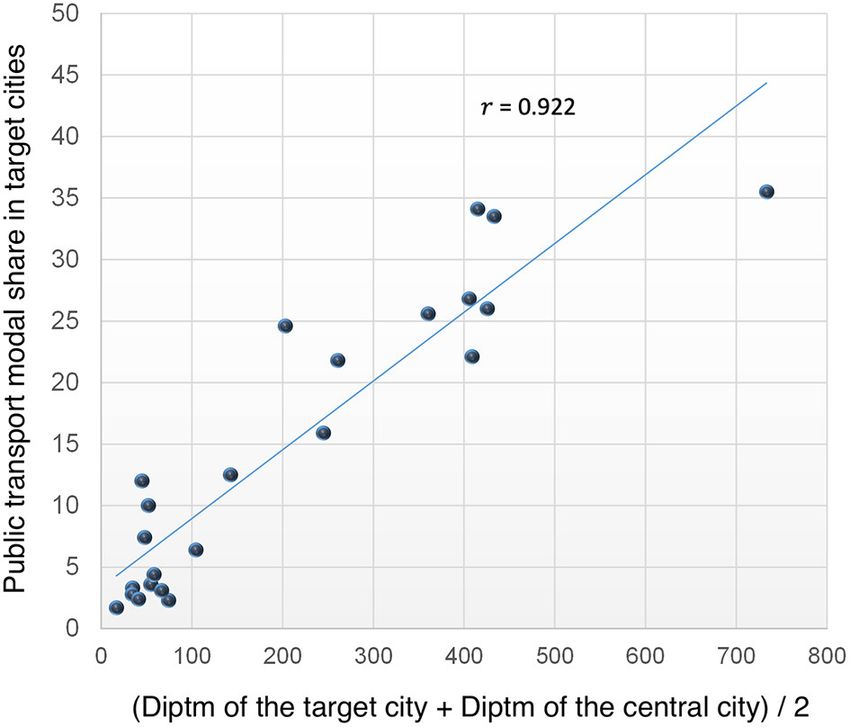
Nakase et al.                                                                                                                         Diversity and Sustainability of Transport

 FIGURE 9 | (A) Spatial distribution of city clusters identifying areas with challenges maintaining railway services in terms of transport diversity. (B) Scatter graph to
 visualize city clusters.

                                                                                           usage and city diversity. However, a strong relationship emerged
                                                                                           when considering diversity in their central cities. Improving the
                                                                                           overall transport diversity in a metropolitan area is considered
                                                                                           effective to increase public transport usage. Compared to the
                                                                                           qualitative methods suggested in previous studies, this study
                                                                                           provides quantitative evidence that a multimodal transport
                                                                                           system supports attractive public transport.
                                                                                               Fourth and lastly, the reasons behind the decline in public
                                                                                           transport are identified and three types of public transport
                                                                                           decline are derived from the research findings demonstrated in
                                                                                           Figure 10. First of all, a decrease in diversity results from the
                                                                                           population decline. The loss of population density in the mid-
                                                                                           sized cities, the regional core cities in Japan, leads to challenges in
                                                                                           maintaining public transport diversity. Moreover, a decrease in
                                                                                           diversity in suburban cities results from an increase in diversity
                                                                                           dependence on the central city. This may occur in the new towns
                                                                                           in the suburb of metropolitan areas. Last, for regional cities
                                                                                           with small populations, the decline in public transport diversity
                                                                                           in these cities is more serious than the decline in population.
 FIGURE 10 | Relationship between Diptm of central cities and diversity
                                                                                           To develop appropriate strategies and ensure sustainable public
 dependence on central city.
                                                                                           transport services, it is necessary to consider the types of decline
                                                                                           in public transport in cities.
                                                                                               For circumstances of a shrinking population and super-aging,
                                                                                           the compact city has been regarded as a desired urban form
by enhancing the transport diversity in the city (see Appendix A                           in Japan. Compact city planning focuses on relatively high
for case study).                                                                           residential density and promotes public transport usage through
   Third, this study revealed that public transport usage in a                             the intensification of public transport and optimal access to
suburban city was significantly influenced by a major city nearby.                         cities (Bibri et al., 2020). Despite a reduction of infrastructure
The suburban cities in the UEA, formed by a central city with                              cost in a concentrated transport network, the compact city
high diversity, tended to have better public transport usage. As                           planning in Japan has not focused on the variety of transport
a result, evaluating transport diversity from the viewpoint of                             modes, especially in the weak demand areas. Transport diversity
metropolitan areas is critical. A transport network with high                              is considered an important factor for infrastructure resilience
diversity conducted in central cities can enhance public transport                         (Rahimi-Golkhandan et al., 2019), which provides the ability of
usage in suburbs. These findings could be confirmed by the                                 a transport network to withstand, operate, and to recover nature
current situation of a growing need to travel between cities in the                        hazards. In terms of sustainable transport, it is suggested that
UEA, such as commuting and shopping. As mentioned earlier,                                 transport diversity should be maintained in metropolises while
there was no significant relationship between public transport                             more transport options are needed in weak demand areas.

Frontiers in Sustainable Cities | www.frontiersin.org                                 10                                                May 2021 | Volume 3 | Article 667711
Nakase et al. Diversity and Sustainability of Transport
With the aim to achieve sustainable public transport in AUTHOR CONTRIBUTIONS
both metropolises and weak transport demand areas, this
research focused on measuring mobility choices. Future research RN conceived of the presented idea, was in charge of the
could explore the role of highway infrastructure in transport data curation and analysis, and drafted the manuscript. C-CC
diversity. This research has identified the reasons behind helped in strengthening the theoretical thinking of the study,
the decline in public transport, future works could explore compiled the literature review and case study, and wrote the final
appropriate strategies for each type of transport decline. manuscript. YA conceived the idea and participated in the design
Owing to the recent impact of COVID-19, users’ needs of the study. KY and KD did proofreading and corrections and
for transport services are expected to become more diverse. were in charge of overall supervision. All authors discussed the
There is a potential to improve the diversity index by results and contributed to the final approval of the version to be
considering comfort and safety, such as infection control, for submitted.
future research.
ACKNOWLEDGMENTS
DATA AVAILABILITY STATEMENT
The authors are grateful to the office of Yamaguchi Prefecture
The raw data supporting the conclusions of this article will be who supported this research by providing their feedback and
made available by the authors, without undue reservation. helpful advice.
REFERENCES Ministry of Land, Infrastructure, Transport and Tourism. (2019b). National
Land Numerical Information: Railroad Data. National land numerical
Amoaning-Yankson, S., and Amekudzi-Kennedy, A. (2017). Transportation information download. Available online at: http://nlftp.mlit.go.jp/ksj/gml/
system resilience: opportunities to expand from principally technical to datalist/KsjTmplt-N02-v2_3.html
sociotechnical approaches. Trans. Res. Rec. 2604, 28–36. doi: 10.3141/ Ministry of Land, Infrastructure, Transport and Tourism. (2020a). To
2604-04 Realize Regional Sustainable Public Transport. Available online at: https://
Aratani, T., and Todoroki, T. (2010). Time series analysis of intercity mobility wwwtb.mlit.go.jp/hokkaido/bunyabetsu/tiikikoukyoukoutsuu/78jinzaiikusei/
by public transportation service in Japan. Infrastruct. Plann. Rev. 27, 643–652. koutuukikakuka.pdf (accessed February 4, 2021).
doi: 10.2208/journalip.27.643 Ministry of Land, Infrastructure, Transport and Tourism. (2020b).
Bibri, S. E., Krogstie, J., and Kärrholm, M. (2020). Compact city planning Act on the Revitalization and Rehabilitation of Local Public
and development: emerging practices and strategies for achieving the goals Transportation Systems. Available online at: https://www.mlit.go.jp/
of sustainability. Dev. Built Environ. 4:100021. doi: 10.1016/j.dibe.2020. sogoseisaku/transport/sosei_transport_tk_000055.html (accessed January
100021 20, 2020).
Clarke, K. R., and Warwick, R. M. (1998). A taxonomic distinctness Ministry of Land, Infrastructure, Transport and Tourism. (2020c). Abandoned
index and its statistical properties. J. Appl. Ecol. 35, 523–531. Railroads in Recent Years. Available online at: https://www.mlit.go.jp/common/
doi: 10.1046/j.1365-2664.1998.3540523.x 001344605.pdf (accessed January 12, 2021).
Doi, K., and Kii, M. (2012). Looking at sustainable urban mobility through Nakagawa, D., Hatoko, M., and Kato, Y. (1994). A Study on the
a cross-assessment model within the framework of land-use and changes of possibility of mutual access by improvement of inter city
transport integration. IATSS Res. 35, 62–70. doi: 10.1016/j.iatssr.2012. transportation. Doboku Gakkai Ronbunshu 1994, 47–56. doi: 10.2208/jscej.
02.004 1994.47
Feng, C. M., and Hsieh, C. H. (2009). Implications of transport diversity for quality Nezu, Y., Kanda, Y., Koike, A., Shiromizu, Y., and Fujii, S. (2013). Study of
of life. J. Urban Plann. Dev. 135, 13–18. doi: 10.1061/(ASCE)0733-9488(2009) prediction of the total effect by building resilient infrastructure in west
135:1(13) Japan. J. Jpn. Soc. Civ. Eng. Ser. F4 69, I57–I68. doi: 10.2208/jscejcm.
Hatoko, M. (2019). A basic study on measuring diversity index of inter-regional 69.I_57
access and its relationship with regional structure. JSCIP 75, I201–I212. Official Statistics of Japan. (2019). Boundary Data by Municipality. E-Stat. Available
doi: 10.2208/jscejipm.75.I_201 online at: https://www.e-stat.go.jp/gis
Kanemoto, Y., and Tokuoka, K. (2001). Metropolitan Area Definitions in Japan. Ohgaki, S. (2008). “Distinctness and similarity: new indicators for taxonomic,” in
CSIS Discussion Paper 37, 1–81. Argonauta 15, 10–22. Available online at: http://www.mus-nh.city.osaka.jp/iso/
Litman, T. (2016). Well Measured. Victoria Transport Policy Institute. argo/nl15/nl15-10-22.pdf
Litman, T. (2017). Evaluating Transportation Diversity: Multimodal Planning Pareekh, P., Mitra, S., and Majumdar, B. B. (2017). Quantifying
for Efficient and Equitable Communities. Victoria, BC: Victoria Transport dimensions of transportation diversity: a City-based comparative
Policy Institute. approach. Trans. Res. Procedia 25, 3174–3187. doi: 10.1016/j.trpro.2017.
Ministry of Land, Infrastructure, Transport and Tourism. (2016). 05.359
Nationwide Person Trip Survey. Available online at: http://www. Rahimi-Golkhandan, A., Garvin, M. J., and Brown, B. L. (2019). Characterizing
mlit.go.jp/toshi/tosiko/toshi_tosiko_tk_000033.html (accessed January and measuring transportation infrastructure diversity through linkages
20, 2020). with ecological stability theory. Trans. Res. A Policy Pract. 128, 114–130.
Ministry of Land, Infrastructure, Transport and Tourism. (2017). National doi: 10.1016/j.tra.2019.07.013
Land Numerical Information: Bus Route Data. National land numerical Statistics Bureau of Japan. (2016). 2015 Population Census. Available online
information download. Available online at: http://nlftp.mlit.go.jp/ksj/gml/ at: https://www.stat.go.jp/data/kokusei/2015/kekka.html
datalist/KsjTmplt-N07.html Tinsley, H. E., and Brown, S. D. (Eds.). (2000). Handbook of
Ministry of Land, Infrastructure, Transport and Tourism. Applied Multivariate Statistics and Mathematical Modeling.
(2019a). List of Community Buses. Available online at: https:// Academic Press.
www.mlit.go.jp/common/001193366.pdf (accessed December Transportation Research Board (1997). “Committee for a study of transportation,
16, 2019). and sustainable environment,” in Toward a Sustainable Future: Addressing the
Frontiers in Sustainable Cities | www.frontiersin.org 11 May 2021 | Volume 3 | Article 667711Nakase et al. Diversity and Sustainability of Transport Long-Term Effects of Motor Vehicle Transportation on Climate and Ecology, Vol. Conflict of Interest: The authors declare that the research was conducted in the 251 (Washington, DC: National Academy Press), 254. absence of any commercial or financial relationships that could be construed as a United Nations. (2007). Third High-Level Meeting on Transport, Environment and potential conflict of interest. Health (2008). Available online at: https://unece.org/fileadmin/DAM/env/cep/ 14%20CEP/ECE_AC21_SC_2007_3_e.pdf Copyright © 2021 Nakase, Chou, Aoki, Yoh and Doi. This is an open-access article Warwick, R. M., and Clarke, K. R. (1995). New ‘biodiversity’ measures distributed under the terms of the Creative Commons Attribution License (CC BY). reveal a decrease in taxonomic distinctness with increasing The use, distribution or reproduction in other forums is permitted, provided the stress. Mar. Ecol. Prog. Ser. 129, 301–305. doi: 10.3354/meps original author(s) and the copyright owner(s) are credited and that the original 129301 publication in this journal is cited, in accordance with accepted academic practice. Weikard, H. P. (1996). Sustainable Freedom of Choice: A New Concept (No. 11). No use, distribution or reproduction is permitted which does not comply with these Finanzwissenschaftliche Diskussionsbeiträge. terms. Frontiers in Sustainable Cities | www.frontiersin.org 12 May 2021 | Volume 3 | Article 667711
Nakase et al.                                                                                                                Diversity and Sustainability of Transport

APPENDIX A                                                                                  between the intracity transport network and high-speed rail
                                                                                            service, thereby enhancing the availability of public transport.
MULTIMODAL TRANSPORT SOLUTION                                                               With a variety of transport services integrated on a MaaS
INTRODUCED IN A REGIONAL CITY OF                                                            platform, a demonstration experiment was started in December
                                                                                            2020 (Figure A1).
JAPAN                                                                                          To implement innovative urban transport solutions in a local
Yamaguchi City is a mid-sized city, known as the regional core                              context, Yamaguchi City encourages diverse transport options.
city of the nation, with a population of ∼200 thousand people.                              The new mobility services introduced in the demonstration
With a Shinkansen station located a 20-min commuting distance                               experiment include a more flexible tour, free small electric
away from the main station in the city center, the conventional                             car sharing service, bike sharing service, and discount
railway and bus systems serve as major modes for the city’s public                          coupon set combined transport tickets and coupons for
transport. Similar to other regional cities in Japan, Yamaguchi                             local restaurants. The various services are integrated into
City has to meet the challenge of maintaining transport services                            a single platform (application or web portal) (Table A1),
under a shrinking population and weak demand within the                                     enabling users to access convenient transport options as well
context of growing sustainability concerns. For the following                               as to shape users’ experiences and preferences. With greater
purposes, multimodal transport services have been introduced                                awareness of the “sharing economy” as well as undertaking
to Yamaguchi City: (1) to link local tourist destinations with                              ICT solutions, diverse transport options in sustainable
existing transport infrastructure, thereby supporting regional                              transport systems are possible to be achieved without intensive
business and development and (2) to improve the connection                                  capital investment.

    FIGURE A1 | Integration of various forms of transport services into a MaaS platform. Access from: https://maas-y.com/.

TABLE A1 | Functions combined in a single application and web portal.

No.         Function                Detail

1           Multimodal              Multimodal route planning service integrating
            journey planner         railway, bus, taxi, small electric car, and
                                    bicycle-sharing services
2           Taxi                    Discount coupon set for taxi tour, booking a
                                    taxi service, and searching for best route
3           Small electric car      A free car-sharing service: searching for rental
                                    sites and making a reservation
4           Bike sharing            Finding rental stations and making a reservation
5           Digital tickets         Online booking and payment for restaurants,
                                    hot spring, and transport services
6           Tourism/restaurant/     Travel guides including information of gourmet
            shopping                and shopping
7           Crowdedness in          Realtime information of bathhouse
            bathhouse               crowdedness in Yuda hot spring (Onsen)

Frontiers in Sustainable Cities | www.frontiersin.org                                  13                                     May 2021 | Volume 3 | Article 667711
You can also read