Estimation of COVID-19 Impact in Virginia
←
→
Page content transcription
If your browser does not render page correctly, please read the page content below
Network Systems
  Science & Advanced
           Computing
                           Estimation of
Biocomplexity Institute
           & Initiative
                           COVID-19 Impact
  University of Virginia   in Virginia
                           June 22nd, 2022
                           (data current to June 18th – June 21st)
                           Biocomplexity Institute Technical report: TR BI-2022-1605

                              biocomplexity.virginia.edu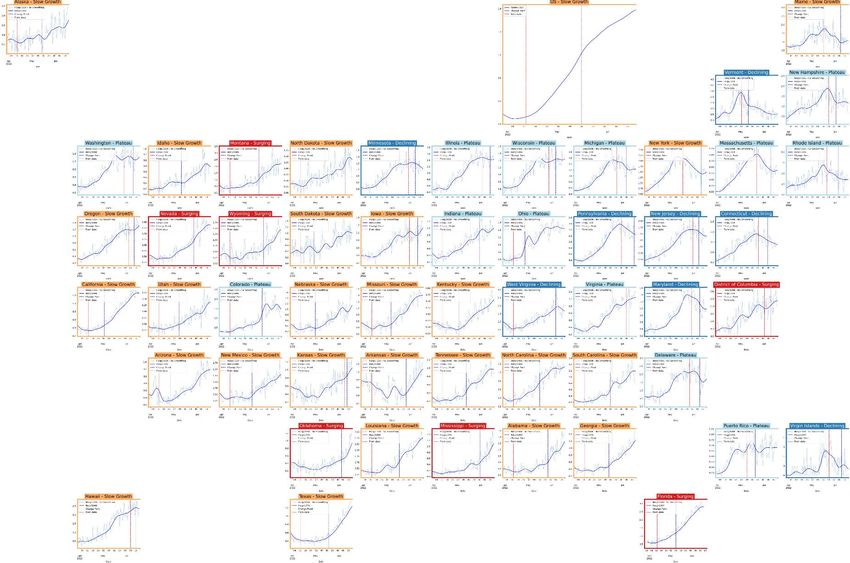
About Us
• Biocomplexity Institute at the University of Virginia
       • Using big data and simulations to understand massively
         interactive systems and solve societal problems
• Over 20 years of crafting and analyzing infectious
  disease models
       • Pandemic response for Influenza, Ebola, Zika, and others

Points of Contact

Bryan Lewis                             Model Development, Outbreak Analytics, and Delivery Team
brylew@virginia.edu                     Przemyslaw Porebski, Joseph Outten, Brian Klahn, Alex Telionis,
Srini Venkatramanan                               Srinivasan Venkatramanan, Bryan Lewis,
srini@virginia.edu              Aniruddha Adiga, Hannah Baek, Chris Barrett, Jiangzhuo Chen, Patrick Corbett,
Madhav Marathe                    Stephen Eubank, Galen Harrison, Ben Hurt, Dustin Machi, Achla Marathe,
marathe@virginia.edu        Madhav Marathe, Mark Orr, Akhil Peddireddy, Erin Raymond, James Schlitt, Anil Vullikanti,
Chris Barrett                      Lijing Wang, James Walke, Andrew Warren, Amanda Wilson, Dawen Xie
ChrisBarrett@virginia.edu

   24-Jun-22                                                                                                   2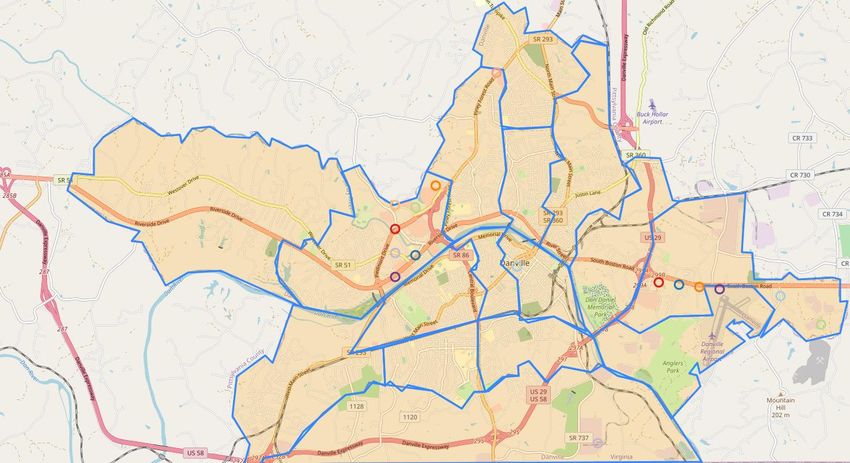
Overview
• Goal: Understand impact of COVID-19 mitigations in Virginia
• Approach:
    • Calibrate explanatory mechanistic model to observed cases
    • Project based on scenarios for next 4 months
    • Consider a range of possible mitigation effects in "what-if" scenarios
• Outcomes:
    • Ill, Confirmed, Hospitalized, ICU, Ventilated, Death
    • Geographic spread over time, case counts, healthcare burdens

 24-Jun-22                                                                     3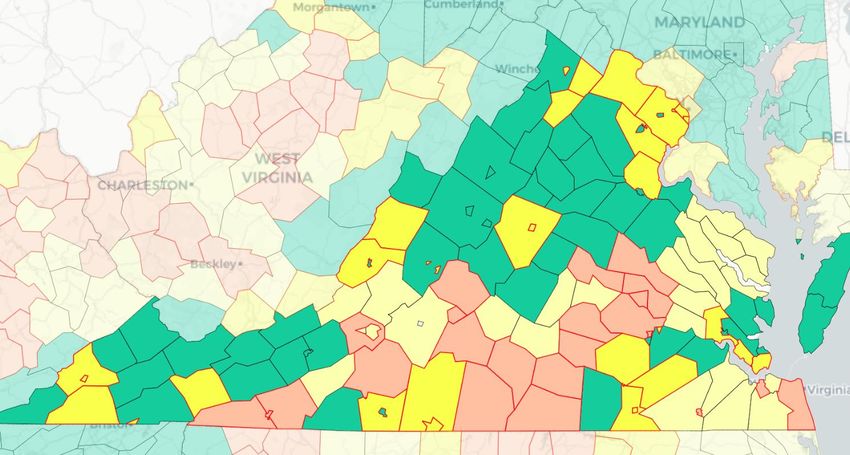
Key Takeaways
Projecting future cases precisely is impossible and unnecessary.
Even without perfect projections, we can confidently draw conclusions:

• Case rates remain high but are slowly declining, hospitalizations have started to decline
• VA 7-day mean daily case rate down to 29/100K from 34/100K
     • US has flattened, only slightly up to 30/100K from 29/100K
     • VA hospital occupancy (rolling 7 day mean of 544) has declined slightly after a couple weeks in a plateau

• Omicron sub-variants BA.4 and BA.5 continue to grow with BA.5 starting to outpace BA.4

• Model projections from last week remain on target

The situation continues to change. Models continue to be updated regularly.

  24-Jun-22                                                                                                        4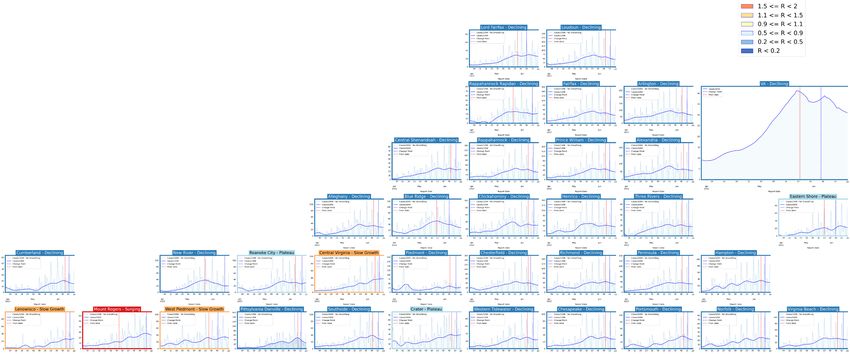
Situation Assessment

24-Jun-22                          5
Case Rates (per 100k) and Test Positivity

                                            County level RT-PCR test positivity
                                            Green: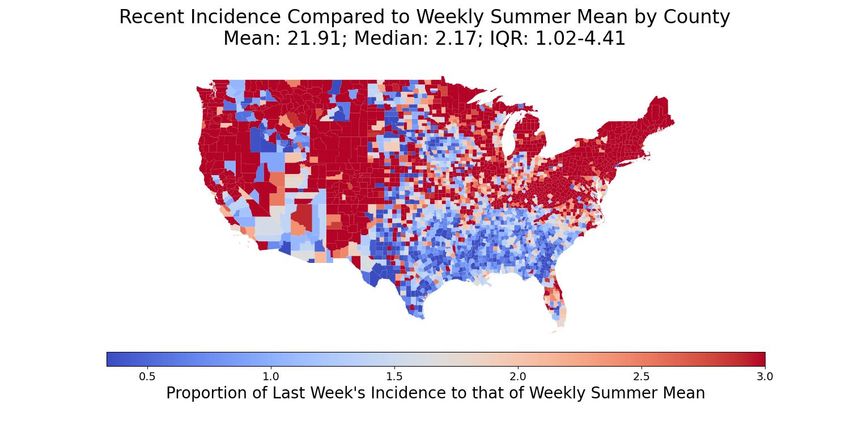
District Trajectories                                                               Hockey stick fit

 Goal: Define epochs of a Health District’s COVID-19 incidence
 to characterize the current trajectory
 Method: Find recent peak and use hockey stick fit to find
 inflection point afterwards, then use this period’s slope to
 define the trajectory

                                                                                    Weekly Case Rate
Trajectory        Description
                                                                                    (per 100K) bounds
Declining         Sustained decreases following a recent peak                            below -0.9
Plateau           Steady level with minimal trend up or down                      above -0.9 and below 0.5
Slow Growth       Sustained growth not rapid enough to be considered a Surge      above 0.5 and below 2.5
In Surge          Currently experiencing sustained rapid and significant growth        2.5 or greater

   24-Jun-22                                                                                             7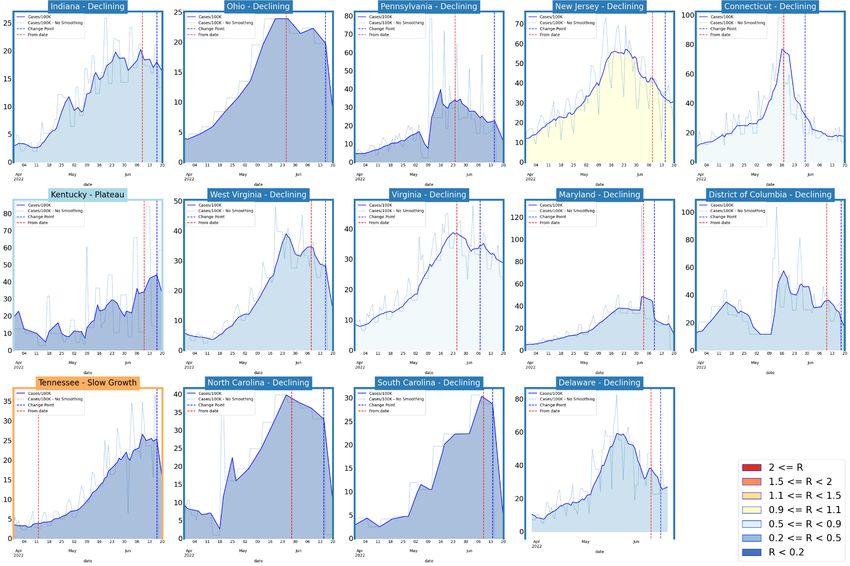
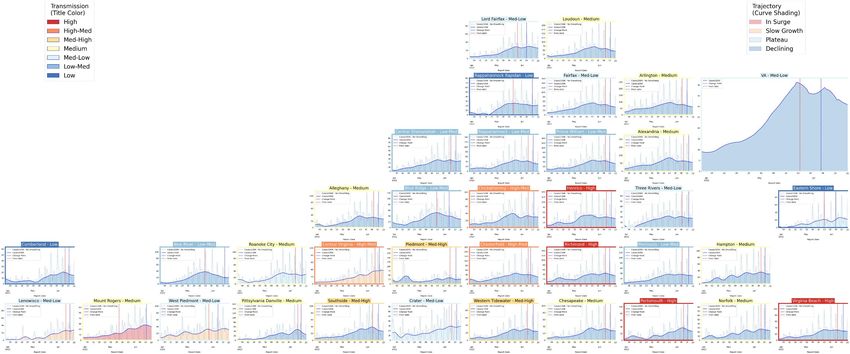
District Trajectories – last 10 weeks
                          # Districts
     Status
                         (prev week)
     Declining              28 (15)
     Plateau                 3 (5)
     Slow Growth             3 (8)
     In Surge                 1 (7)
Curve shows smoothed case rate (per 100K)
Trajectories of states in label & chart box
Case Rate curve colored by Reproductive
number

      24-Jun-22                               8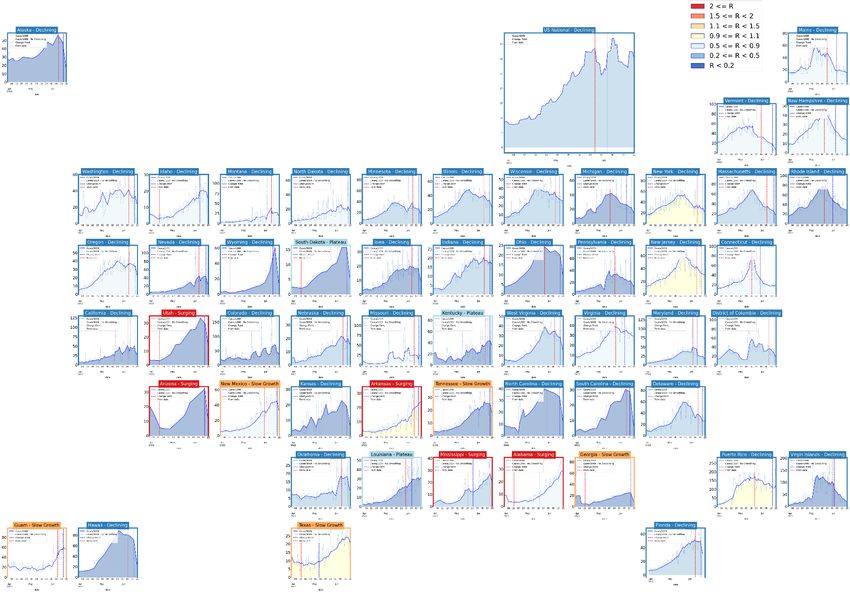
CDC’s new COVID-19 Community Levels

                        Last week

                                      CDC Data Tracker Portal
24-Jun-22                                               9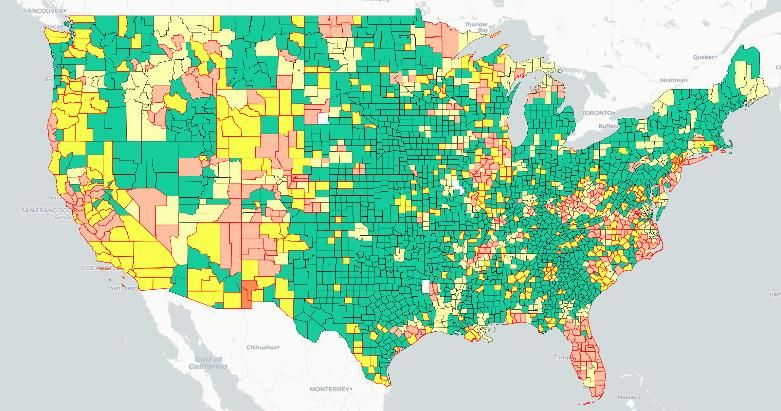
CDC’s new COVID-19 Community Levels
     Last week
                                   Red outline indicates county had 200 or
                                   more cases per 100k in last week

                                   Pale color indicates either beds or occupancy
                                   set the level for this county
                                   Dark color indicates both beds and
                                   occupancy set the level for this county

                    VA     USA

Last week
        24-Jun-22                         Data from: CDC Data Tracker Portal   10
District Trajectories with Community Levels
Community Level
Curve shows smoothed case rate (per 100K) Last week
CDC’s new Community Level aggregated to district
level in label & chart box color
Case Rate curve colored by Trajectory
District’s Aggregate
Community Level
Aggregate level a simple mean
of all levels for counties in district
Case rate
Trajectory
24-Jun-22 11Estimating Daily Reproductive Number –
Redistributed gap
June 20th Estimates
Date Confirmed Date Confirmed
Region
Re Diff Last Week
State-wide 0.902 -0.040
Central 0.867 -0.063
Eastern 0.950 -0.015
Far SW 0.897 -0.075 Skipping Weekend Reports & holidays biases estimates
Near SW 0.916 -0.050 Redistributed “big” report day to fill in gaps, and then estimate R from
”smoothed” time series
Northern 0.891 -0.049
Northwest 0.907 0.023
Methodology
• Wallinga-Teunis method (EpiEstim1) for cases by confirmation date
• Serial interval: updated to discrete distribution from observations (mean=4.3, Flaxman et al, Nature 2020)
• Using Confirmation date since due to increasingly unstable estimates from onset date due to backfill
1. Anne Cori, Neil M. Ferguson, Christophe Fraser, Simon Cauchemez. A New Framework and Software to Estimate
Time-Varying Reproduction Numbers During Epidemics. American Journal of Epidemiology, Volume 178, Issue 9, 1
November 2013, Pages 1505–1512, https://doi.org/10.1093/aje/kwt133
12
24-Jun-22Mask Usage and Vaccination Self-reported mask usage continues to fall • VA has remained relatively steady while US continues steady decline • Vaccination has leveled off and has leveled off after a slight rise in early April, majority 2nd boosters Data Source: https://covidcast.cmu.edu 24-Jun-22 13
Wastewater Monitoring
Wastewater provides a coarse early warning of COVID-19 levels in communities
• Overall in the US, there is an increase in sites with increased levels of virus compared to 15 days ago
• Current virus levels are at or exceeding max of previous historical levels, has slowed, though more sites are entering upper quintiles

  USA

   VA

                                                                                                     Data Source: CDC Data Tracker
      24-Jun-22                                                                                                                    14
COVID-like Illness Activity COVID-like Illness (CLI) gives a measure of COVID transmission in the community • Emergency Dept (ED) based CLI is more correlated with case reporting • Urgent Care (UC) is a leading indicator but prone to some false positives • Current trends in UC CLI have plateaued for last four weeks state-wide, mixed by region 24-Jun-22 15
SARS-CoV2 Variants of Concern
Emerging new variants will alter the future trajectories
of pandemic and have implications for future control
• Emerging variants can:
      • Increase transmissibility
      • Increase severity (more hospitalizations and/or deaths)
      • Limit immunity provided by prior infection and vaccinations
Omicron Updates
• BA.2.12.1 growth has stagnated, remaining in the 65%-75% prevalence range
  for the last 5 weeks (Region 3)
• BA.4 continues to grow, nowcasted at 11% (up from 8% last week)
• BA.5 growing rapidly, nowcasted at 14% (up from 6% last week)
• BA.4 and BA.5 have same mutation as BA.1 that          SGTF in San Diego
  produces S-gene target failure, so can be tracked
  in more real time with SGTF from some PCR tests

                                           Walgreens
                                            detecting
                                           BA.4 / BA.5
                                            in 45% of
                                           their typed
                                             samples       Estimated 50% on June 15th, Region 9
   24-Jun-22                                             nowcast at 35% for 6/18 indicates variant                          16
                                                                geographic heterogeneity             CDC Variant Tracking
SARS-CoV2 Omicron and Sub-Variants
As detected in whole Genomes in public repositories VoC Polynomial Fit Projections
Note: Data lags
force projections
to start in past.
Everything from
dotted line
forward is a
projection.
24-Jun-22 171 2
Pandemic Pubs
1. When administered as an early-stage treatment, Paxlovid
might prevent COVID-19–related hospitalization among persons
with mild-to-moderate COVID-19 who are at risk for progression
to severe disease.
2. Reinfection adds risks of mortality, hospitalization, and
adverse outcomes in the acute and post-acute phase.
3. Additional public health, regulatory, and policy efforts might
help decrease barriers to oral antiviral access, particularly in
communities with high social vulnerability.
4. Further evidence for dynamic polymorphic viral populations in
immunocompromised patients, suggesting that a compromised
immune system selects for antibody evasion in particular niches
in a patient’s body “COVID-19–related hospital admissions and emergency department (ED) encounters
5. Measurements indicate that in a healthy volunteer, the occurring 5–15 days after Paxlovid treatment were described using data from a large
integrated health care system. Reports of such hospitalizations or ED encounters occurred
airborne mass of speech aerosol far exceeds that generated by infrequently, representing1 2
Pandemic Pubs (last week)
1. HCW who became infected during the B.1.1.529 wave
showed enhanced immunity against earlier variants, but
reduced nAb potency and T cell responses against
B.1.1.529 itself.
2. T cells specific for SARS-CoV-2 elevated in blood of
pulmonary PASC, associated with increased IL-6, a
cytokine strongly associated with COVID-19 severity,
and decreased lung function.
3. Cohort study of 7772 infants delivered during the
COVID-19 pandemic, those born to the 222 mothers with
a positive PCR test during pregnancy were more likely to
receive a neurodevelopmental diagnosis in the first 12 Ab immunity in triple-vaccinated HCW following infection during the B.1.1.529 (Omicron)
months after delivery, even after accounting for preterm wave. Analysis of a cohort of London healthcare workers with heterogeneous, immune-
imprinted repertoires derived from their distinctive histories of infection and vaccination.
delivery. Concerningly, the authors suggest that “(Omicron) infections and reinfections likely reflects
4. Antigen test swabs are comparable to nasopharyngeal considerable subversion of immune recognition at both the B, T cell, antibody binding and
swabs for sequencing of SARS-CoV-2 nAb level, although with considerable differential modulation through immune imprinting.”
https://www.science.org/doi/10.1126/science.abq1841
Researchers at University of Colorado found that
4 individuals with pulmonary symptoms associated with
3 Long Covid were more likely to have elevated SARS-
CoV-2-specific CD4+ and CD8+ T cells in peripheral
blood. Indicate pulmonary PASC may be, in part, driven
by the production of inflammatory cytokines by SARS-
CoV-2-specific T cells. Pulmonary complications include
tussis, dyspnea, fatigue, exercise intolerance and
hypoxia
https://journals.plos.org/plospathogens/article?id=10.1
371/journal.ppat.1010359
Authors compare the results of RT-qPCR and viral genome sequencing using samples
from positive BinaxNOW™ COVID-19 Antigen Card swabs (N=555) to those obtained
from previously collected nasopharyngeal (NP) swabs used for nucleic acid Harvard Medical School researchers suggest that maternal
amplification testing (N=135). They show that swabs obtained from antigen cards are immune activation during pregnancy may be associated with
comparable in performance to clinical excess samples from NP swabs neurodevelopmental effects in offspring.
https://www.medrxiv.org/content/10.1101/2022.06.09.22276150v1 https://www.biorxiv.org/content/10.1101/2022.05.25.493397v1United States Case Rates
Trajectories of States
• Rebounding activity,
mainly in the Northeast
Status # States
Declining 41 (26)
Plateau 3 (4)
Slow Growth 5 (11)
In Surge 5 (13)
24-Jun-22 20Virginia and Her Neighbors 24-Jun-22 21
United States Hospitalizations
                                 Trajectories of States
• Hospital admissions are
  lagging case rates
• Declines seem to be leveling
  off in Northeast, surges in
  southern in Central US
  follow cases

 Status          # States

 Declining       8 (11)
 Plateau         13 (9)
 Slow Growth     25 (29)
 In Surge         7 (4)

    24-Jun-22                                             22
Around the World – BA.4 and BA.5 impacted countries
Confirmed cases Hospitalizations
Our World in Data
24-Jun-22 23County-level comparison to last Summer
Last week Last week
24-Jun-22 24Using Ensemble Model to Guide Projections Ensemble methodology that combines the Adaptive with machine learning and statistical models such as: • Autoregressive (AR, ARIMA) • Neural networks (LSTM) • Kalman filtering (EnKF) Weekly forecasts done at county level. Models chosen because of their track record in disease forecasting and to increase diversity and robustness. Ensemble forecast provides additional ‘surveillance’ for making scenario-based projections. Also submitted to CDC Forecast Hub. 24-Jun-22 25
Last projection comparison – 1 week ago
       With Last Week’s Case Data   With This Week’s Case Data

24-Jun-22                                                        26
Key Takeaways
Projecting future cases precisely is impossible and unnecessary.
Even without perfect projections, we can confidently draw conclusions:
• Case rates remain high but are slowly declining, hospitalizations have started to decline
• VA 7-day mean daily case rate down to 29/100K from 34/100K
• US has flattened, only slightly up to 30/100K from 29/100K
• VA hospital occupancy (rolling 7 day mean of 544) has declined slightly after a couple weeks in a plateau
• Omicron sub-variants BA.4 and BA.5 continue to grow with BA.5 starting to outpace BA.4
• Model projections from last week remain on target
The situation continues to change. Models continue to be updated regularly.
24-Jun-22 27Additional Analyses 24-Jun-22 28
Overview of relevant on-going studies
Other projects coordinated with CDC and VDH:
• Scenario Modeling Hub: Consortium of academic teams coordinated via MIDAS / CDC
  to that provides regular national projections based on timely scenarios
• Genomic Surveillance: Analyses of genomic sequencing data, VA surveillance data, and
  collaboration with VA DCLS to identify sample sizes needed to detect and track
  outbreaks driven by introduction of new variants etc.
• Mobility Data driven Outreach locations: Collaboration with VDH state and local,
  Stanford, and SafeGraph to leverage anonymized cell data to help identify sites most
  frequently visited by different demographic groups

 24-Jun-22                                                                         29
COVID-19 Scenario Modeling Hub – Round 13
Collaboration of multiple academic https://covid19scenariomodelinghub.org/viz.html
teams to provide national and state-
by-state level projections for 4
aligned scenarios
• Round 13 results getting finalized
• Scenarios: New Variant in Summer
and waning compared (yes/no new
variant vs. 4 month or 10 month
waning)
• Prelim results shared internally
• Only national consortium tracking
Omicron wave well
• Rounds 4-12 now available
Round 4 Results were published
May 5th, 2021 in MMWR
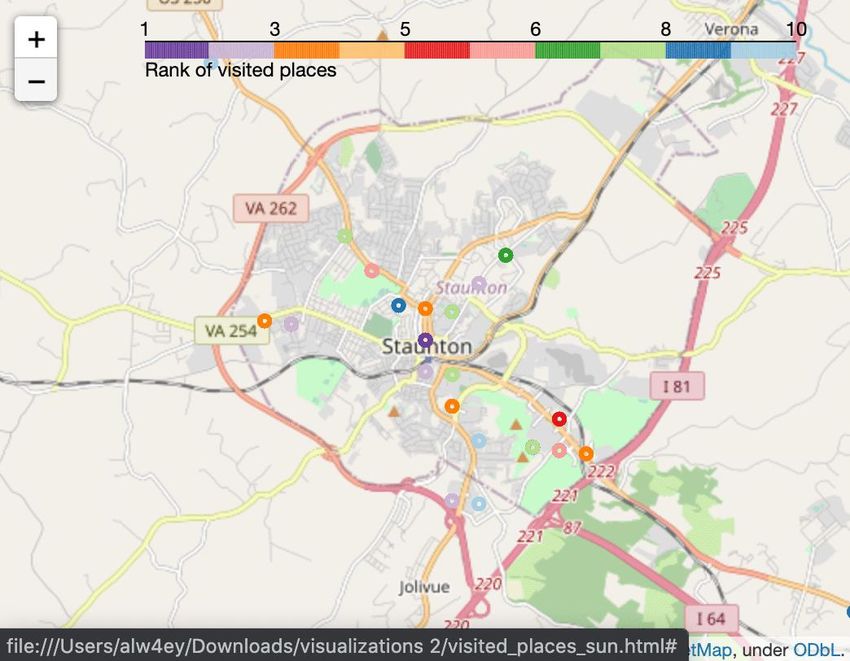
24-Jun-22 30Busiest Places: Mobility Data Can Assist
SafeGraph provides fine-grained mobility measures
● SafeGraph: anonymized geolocation data aggregated from numerous cell
phone apps
● One of the most fine-grained and high-coverage mobility data sources
available: 6.4 million POIs in the US; 158,869 POIs in VA
● Has been utilized by hundreds of researchers, governments, and the CDC
to aid COVID-19 efforts (Chang, Pierson, Koh, et al., Nature 2020; Chang
et al, KDD 2021)
● Daily and hourly number of visits to points-of-interest (POIs), i.e., non-
residential locations such as restaurants, bars, gas stations, malls, grocery
stores, churches, etc.
● Weekly reports per POI of where visitors are coming from (at the census
block group level)
● Still has limitations to be aware of (e.g., less representation among
children and seniors)Find the Busiest Locations
POIs are individual addresses,
need some aggregation to busy
areas
Busiest locations vary by day of week (and time of day)Find locations visited by Target Population
Census Block Groups in Danville 1. Use census data to characterize the
populations of the different census block
groups
2. Identify most frequently visited POIs for each
CBG
3. Cluster most visited POIs
4. Provide potential sites grouped by the
demographic groups they likely serve
Goal: Provide frequently visited locations based on populations and
vaccination levels one desires to reach
Example: List of locations in the Southside frequented by Black VirginiansOverview of the current roster of targeted populations These are the current roster of targeted population groups that we are providing as part of the weekly delivery to VDH. (This roster is subject to change.) ● Whole population (eg, no target population filters are applied) ● Race Black ● Ethnicity Latinx ● Ages 20-40 ● Ages 20-30 ● Ages 30-40 ● Unvaccinated populations ● Latinx or Black
HighlyVisitedAddress
                                                                                                       This is the address of the POI in
     Data Elements in the CSV                                                                          the L14 that sees the most
                                                                                                       visits. It is provided to make it
                                                         Rank & LocationWeight                         easier to find the L14 on the
                                                    The LocationWeight is estimated #                  map.
                                                                                                                                     AreaMostVisitedPeriod
                                                    of visits to POIs in the L14 from the                                          This is the 4-hour period in
                                                    target group. Rank indicates the                                               the week when the L14 sees
                                                    order from most- to 25th most-                                                 its highest traffic. This is not
                                                    visited                                                                        target group-specific.

                        Population Group
               For a targeted file like this one,                                   AreaMostVisitedDay                                                            Lat and Lon
                                                                                This is the day of the week                                                       This is the latitude
               these will all be the same value.
                                                                                when most visitors go to this                                                     and longitude for
                                                                                S2 location. This is not target                                                   the center of the
         VDH District                         S2 Key                            group-specific.                                                                   L14.
                                               (L14)
County
Mobility Data Updated Weekly
Box: https://virginia.box.com/s/03kq8el0kzd9w43wz2g3myozov76uizo
● Excel sheets and simple HTML maps packaged for use
VDH has a dashboard available upon request to allow interactive viewing
● https://arcgis.vdh.virginia.gov/portal/apps/opsdashboard/index.html#/8
631cfc4f181460fafc7e1923f41d581
● Dashboard is restricted to VDH offices
and those who VPN into the CoV
Network
36References Venkatramanan, S., et al. "Optimizing spatial allocation of seasonal influenza vaccine under temporal constraints.” PLoS Computational Biology 15.9 (2019): e1007111. Arindam Fadikar, Dave Higdon, Jiangzhuo Chen, Bryan Lewis, Srinivasan Venkatramanan, and Madhav Marathe. Calibrating a stochastic, agent-based model using quantile-based emulation. SIAM/ASA Journal on Uncertainty Quantification, 6(4):1685– 1706, 2018. Adiga, Aniruddha, Srinivasan Venkatramanan, Akhil Peddireddy, et al. "Evaluating the impact of international airline suspensions on COVID-19 direct importation risk." medRxiv (2020) NSSAC. PatchSim: Code for simulating the metapopulation SEIR model. https://github.com/NSSAC/PatchSim Virginia Department of Health. COVID-19 in Virginia. http://www.vdh.virginia.gov/coronavirus/ Biocomplexity Institute. COVID-19 Surveillance Dashboard. https://nssac.bii.virginia.edu/covid-19/dashboard/ Google. COVID-19 community mobility reports. https://www.google.com/covid19/mobility/ Biocomplexity page for data and other resources related to COVID-19: https://covid19.biocomplexity.virginia.edu/ 24-Jun-22 37
Questions?
                                   Biocomplexity COVID-19 Response Team

                            Aniruddha Adiga, Abhijin Adiga, Hannah Baek, Chris Barrett,
                            Golda Barrow, Richard Beckman, Parantapa Bhattacharya,
Points of Contact
                            Jiangzhuo Chen, Clark Cucinell, Patrick Corbett, Allan
Bryan Lewis                 Dickerman, Stephen Eubank, Stefan Hoops, Ben Hurt, Ron
brylew@virginia.edu         Kenyon, Brian Klahn, Bryan Lewis, Dustin Machi, Chunhong
                            Mao, Achla Marathe, Madhav Marathe, Henning Mortveit,
Srini Venkatramanan         Mark Orr, Joseph Outten, Akhil Peddireddy, Przemyslaw
srini@virginia.edu          Porebski, Erin Raymond, Jose Bayoan Santiago Calderon,
                            James Schlitt, Samarth Swarup, Alex Telionis, Srinivasan
Madhav Marathe              Venkatramanan, Anil Vullikanti, James Walke, Andrew
marathe@virginia.edu
                            Warren, Amanda Wilson, Dawen Xie
Chris Barrett
ChrisBarrett@virginia.edu

24-Jun-22                                                                                 38
You can also read


