Energy Outlook Report 2019 - Data Report
←
→
Page content transcription
If your browser does not render page correctly, please read the page content below
Energy Outlook
 Report 2019
 Data Report

June 2019
20-06-2019

This report has been conducted for the Electricity and Renewable Energy
Authority in Vietnam (EREA) and the Danish Energy Agency (DEA). The report
should be cited as EREA & DEA: Balmorel Data Report. Background to the
Vietnam Energy Outlook Report 2019 (2019)

The report is authored by
Nina Dupont
Mikael Togeby

Ea Energy Analyses
Gammeltorv 8, 6 sal
1457 Copenhagen K
Denmark
T: +45 88 70 70 83
Email: info@eaea.dk
Web: www.eaea.dk

2 | Energy Outlook Report 2019 - Data report - 20-06-2019

Contents
1 Introduction and background ...............................................................4

2 The Balmorel model ............................................................................5
 2.1 Investment approach ......................................................................... 5
 2.2 Time resolution................................................................................... 6
 2.3 Geographical scope ............................................................................ 7

3 Existing and committed system ............................................................9
 3.1 Existing generation capacity ............................................................... 9
 3.2 Existing and committed transmission capacity ................................ 13

4 Future developments......................................................................... 16
 4.1 Electricity demand ............................................................................ 16
 4.2 Import from third countries ............................................................. 17
 4.3 Fuels and fuel prices ......................................................................... 18

5 Investment options ........................................................................... 20
 5.1 Technology catalogue ....................................................................... 20
 5.2 Interconnector investment costs ..................................................... 27

6 Fuel and RE resources and potentials ................................................. 29
 6.1 Domestic coal and natural gas.......................................................... 29
 6.2 Hydro ................................................................................................ 31
 6.3 Biomass and MSW ............................................................................ 32
 6.4 Onshore wind ................................................................................... 34
 6.5 Offshore wind ................................................................................... 37
 6.6 Solar .................................................................................................. 38
 6.7 Renewable energy requirements ..................................................... 39

References................................................................................................ 41

Appendix .................................................................................................. 43
 Appendix I: Exogenous capacity ............................................................... 43
 Appendix II: Unit commitment parameters for existing units ................. 50
 Appendix III: Large hydro characteristics ................................................. 53

3 | Energy Outlook Report 2019 - Data report - 20-06-2019
1 Introduction and background
 This is a Data Report relating to the project ‘Capacity building within Balmorel
 and scenarios’. The project is being carried out by Ea Energy Analyses in col-
 laboration with the Institute of Energy (Viện Năng lượng) as part of the Devel-
 opment Engagement 1: “Capacity Development for long-range energy sector
 planning with Electricity and Renewable Energy Agency of Viet Nam”, current-
 ly being conducted under the Energy Partnership Programme between Viet
 Nam and Denmark (DEPP).

 This Data Report documents the data and assumptions used for representing
 the Vietnamese power sector in the Balmorel modelling framework. This Data
 Report is prepared as supporting documentation to the Energy Outlook Tech-
 nical Report (EOR) 2019.

Approach To identify and quantify benefits and disadvantages of different development
 scenarios within the Vietnamese power system, the country’s generation and
 transmission system is modelled based on the concept of least-cost optimiza-
 tion. Several scenarios are set up in consultation with Institute of Energy and
 the Danish Energy Agency to illustrate the economic consequences of possible
 future strategies.

 All cost data in this report are in USD 2016 real terms.

 4 | Energy Outlook Report 2019 - Data report - 20-06-2019
2 The Balmorel model
The Vietnamese power system analyses are carried out with the Balmorel
model, which is a least-cost dispatch power system model. The model is based
on a detailed technical representation of the existing power system; all power
generation plants are represented on individual basis as well as the intercon-
nected transmission grid.

The output is a least-cost optimisation of all the production and transmission
units represented in the model. In addition to simulating least-cost dispatch of
generation units, the model simultaneously allows for investments to be
made in different new generation units (hydro, coal, gas, wind, solar, biomass
etc.) as well as in new interconnectors.

2.1 Investment approach
The Balmorel model is myopic in its investment approach, in the sense that it
does not explicitly consider revenues beyond the year of installation. This
means that investments are undertaken in each year if the annual revenue
requirement (ARR) in that year is satisfied by the market. Construction time is
not explicitly considered in the model (although interests during construction
are included in the investment costs for new technologies). Capacity appears
in the beginning of the year of commissioning. This means that the decision
for investment should be considered as taken in an earlier year (considering
planning and construction).

A balanced risk and reward characteristic of the market is assumed, which
means that the same ARR is applied to most technologies, specifically 0.1175,
which is equivalent to 10% internal rate of return for 20 years. This rate
should reflect an investor’s perspective. For transmission capacity this ARR
becomes 0.1023 (10% internal rate of return for 40 years).

It should be stressed that the recommended socio-economic discount rate in
many countries is significantly lower than the 10% rate applied in the present
study (Germany: 2.2%, Sweden and Norway: 4%, Denmark and Finland: 2-4 %,
UK: 1.0-3.5%, EU: 3.5-5.5%1). Applying a lower discount rate would favour
capital-intensive technologies like wind power, nuclear power and solar pow-

1
 European Commission (2008): Guide to Cost-Benefit Analysis of investment
Projects; Concito (2011): Den samfundsøkonomiske kalkulationsrente – fakta og etik.

5 | Energy Outlook Report 2019 - Data report - 20-06-2019
er as opposed to, e.g. gas power plants. The current 10% discount rate was
agreed upon as an appropriate value.

2.2 Time resolution
The model is set up to analyse the year 2017 as reference year and the period
2020-2050 in 10-year intervals.

To limit the computation time, not all hours of the year are included in the
simulation. The dispatch and investment optimisation, both in generation
capacity and in transmission capacity, are performed with 14x26 (364) time
steps. The 13 seasons represent two-week periods in the year, where the
hours are aggregated into 14 intervals representing evening peak demand,
afternoon solar peaks, nights, morning etc. A more accurate dispatch optimi-
zation can be analysed in 7x168 (1176) time steps, where all hours of 7 weeks
are simulated. The 7 selected weeks of the year are: week 4, 10, 16, 34, 39,
47, 52. The chosen weeks are important in relation to the data profiles includ-
ed in the model. These weeks were chosen to represent low and high de-
mand, high and low wind and solar generation, dry and wet weeks. This re-
lates to electricity demand, hydro inflow, wind and solar profiles.

6 | Energy Outlook Report 2019 - Data report - 20-06-2019
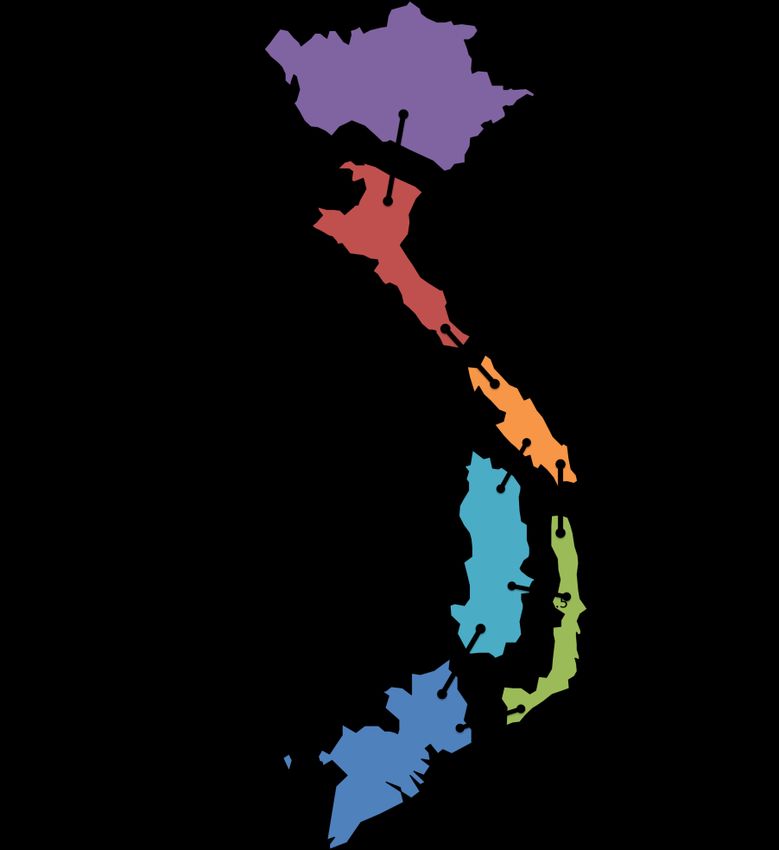
2.3 Geographical scope
The model contains data of the electricity system of Vietnam. The map below
(Figure 1) illustrates the interconnected power system in Vietnam in 2019.

Figure 1. Current interconnectors in Vietnam (2019).

The country is represented in the Balmorel model as 6 transmission regions,
each with its own electricity consumption. The transmission regions are con-
nected by electricity transmission lines with fixed capacity. The six regions are
selected to represent in more detail the central region of Vietnam, where a
large part of the potential for wind and solar power is located. Moreover, the
six regions were chosen in order to represent potential transmission bottle-
necks in the system.

To allocate generation capacity to the transmission regions, areas are used.
Areas are modelling entities in which generating units are placed. For each
area, characteristics such as fuel prices, full load hours and hourly profiles for
wind, solar and hydro, hydro-reservoir sizes etc. can be defined. Any area
7 | Energy Outlook Report 2019 - Data report - 20-06-2019
must be included in exactly one region. Each transmission region contains one
or more areas. As such, it is possible to assign different technological proper-
ties to power plants within one transmission region by using several areas.

 Countries

 Region Region
 Regions

 Areas

 Electrical
 transmission

Figure 2: The geographical entity representation structure in the Balmorel model.

In the case of Vietnam, each transmission region has one corresponding area
for existing generation and one area for new generation introduced after
2018 in which all generation capacity is allocated, and characteristics of solar
and small hydro production are defined. Exceptions are made for all large
hydro plants (reservoir plants), each one assigned to a specific area per indi-
vidual plant to be able to describe their plant-specific inflow profiles, full load
hours and reservoir sizes. Wind sites of Vietnam are also modelled in three
separate areas per region, where wind speed profiles are assigned.

Electricity balances are given on a regional basis. Hence, for each region an
electricity balance must be fulfilled but electricity may be exchanged between
regions. Therefore, the transmission, and its constraints, losses and costs, are
the motivation for the concept of regions.

8 | Energy Outlook Report 2019 - Data report - 20-06-2019
3 Existing and committed system
Generation technologies in the Balmorel model can be divided into two
groups: exogenous generation and endogenous generation. All exogenous
capacity is fed into the model as input and is not the result of model optimiza-
tion. On top of the exogenous capacity, the model can decide to invest in ad-
ditional capacity, choosing from a list of options, namely the technology cata-
logue. This model-based additional capacity is called endogenous.

This chapter will look into exogenous generation and transmission capacity

3.1 Existing generation capacity
The generation capacity of existing and committed (i.e. planned with a high
likelihood of being realized) power plants is entered in the model exogenous-
ly, meaning that it is put in “by hand” and not optimally “chosen” by the mod-
el. The exogenous generation fleet is taken from PDP 7 Revised [1]. A detailed
list of all PDP 7 revised power plants implemented in the model is presented
in the Appendix I. Existing technologies and planned facilities until 2025 as per
PDP 7 revised are entered in the model as exogenous, except for coal-based
technologies which are only committed until 2023, as investments are less
certain due to public resistance and difficulties finding financing. RE capacities
are committed until 2025 based on [2]. The exogenously implemented tech-
nologies are shown by fuel type in Figure 3.
 100
 90 Solar
 80 Wind
 70 Hydro

 60 Other RE
 GW

 50 Biomass

 40 Oil

 30 Imp. LNG
 Dom. NG
 20
 Imp. coal
 10
 Dom. coal
 0
 2017 2020 2030 2040 2050

Figure 3: Exogenous generation capacity (existing and planned until 2025). The plants are exog-
enously decommissioned after their technical lifetime.

9 | Energy Outlook Report 2019 - Data report - 20-06-2019
Existing and committed capacity (by 2025) is shown by region in Figure 4.
 30

 Solar
 25
 Wind

 20 Hydro
 Other RE
 GW 15 Biomass
 Oil
 10
 Imp. LNG

 5 Dom. NG
 Imp. coal
 0
 Dom. coal
 North North Centre Highland South South
 Central Central Central

 Figure 4: Existing and committed capacity per region (by 2025)

 Exogenous decommissioning is applied to the existing and committed genera-
 tion fleet, i.e. the technologies are removed from the model after their life-
 time has ended.
 The existing power plant capacity is based on 2018 statistics. However for
 solar PV and wind power the development has since then been remarkable
 due to profitable subsidy schemes. In end of June 2019 the capacity of con-
 nected solar PV and wind in Vietnam reached 4.5 GW and 0.45 GW solar PV
 and wind, respectively, however at this point the EOR19 modelling were al-
 ready finalised. Comparing with the capacity in the model it shows that in the
 model year 2020 (the models are not run for 2019) a similar amount of capac-
 ity of 4.1GW and 1.4 GW solar PV and wind, respectively, in the model. Thus
 the solar PV capacity in 2020 in the model is only marginally lower than the
 realized June 2019 capacity in Vietnam, a correction of this would not in any
 significant way affect the EOR19 calculation results.
O&M for existing and Generic assumptions for fixed and variable operation and maintenance (O&M)
committed units costs are applied for existing and committed power plants and are uniform
 across the regions. The costs can be seen in the Table 1 below and are based
 on data from [3] and [1].

 10 | Energy Outlook Report 2019 - Data report - 20-06-2019
Fixed O&M Variable O&M Lifetime
 Generation type Efficiency
 ($1000/MW el.) ($/MWh el.) (years)
 Coal 35-41%* 21.68 2.28 30
 CCGT 59% 26.32 2.19 30
 Oil thermal 24-44%** 8.00 6.4 25
 Biomass 32% 56.56 3.0 25
 Hydro FLHs 45.00 0.6 40
 Wind FLHs 79.40 0.0 25
 Solar FLHs 15.00 0.0 25
 Pumped hydro 70% 15.00 2.0 20
 Coal 35-41% 21.68 2.28 30

 Table 1: Generic fixed and variable O&M and lifetime for existing and committed power plants.
 * Depending on coal grade
 ** Depending on individual plant

Unit commitment Unit commitment is implemented in Balmorel as a relaxed mixed integer
 problem. This means that variables which in the ideal case would be binary
 values (0 or 1) are represented as linear values (e.g. a unit can be 56% online).
 Variables in the unit commitment problem include:
 • Whether the unit is online or not
 • Whether the unit is starting-up or not
 • Whether the unit is shutting-down or not
 As the modelling includes many different units, the general impact of imple-
 menting unit commitment on a large scale in this form will be close to the
 realistic impact. For modelling dispatch of one specific unit, (non-relaxed)
 mixed integer programming is recommended.
 Unit commitment is implemented with data on unit size, start-up costs and
 minimum generation, received from [1], for a large number of specific existing
 technologies, as can be found in Appendix II. For thermal technologies, where
 no specific data was available, as well as for investment options, the unit
 commitment parameters are implemented as shown in Table 2, based on [3].

 11 | Energy Outlook Report 2019 - Data report - 20-06-2019
Mini- Ramp
 Start-up Mini-
 mum up- Mini-
 Unit size cost mum
 gen. down mum up
 (MW) (USD/M down
 (% of (%/hour (hours)
 W) (hours)
 MW) )
 2020 Nuclear 1000 260 50% 1.2 6 6
 Subcritical 600 180 67% 0.6 4 2
 Supercritical 600 180 75% 0.6 4 2
 Ultrasuper 600 180 30% 3.0 4 2
 CCGT 250 131 56% 4.2 4 2
 Biomass 25 180 30% 6.0 4 2
 2030 Nuclear 1000 260 50% 1.2 6 6
 Subcritical 600 180 25% 2,1 4 2
 Supercritical 600 180 25% 2,4 4 2
 Ultrasuper 600 180 25% 3,0 4 2
 CCGT 250 131 30% 12,0 4 2
 Biomass 25 180 30% 6,0 4 2
 2050 Nuclear 1000 260 50% 1.2 6 6
 Subcritical 600 180 20% 2,1 4 2
 Supercritical 600 180 20% 2,4 4 2
 Ultrasuper 600 180 20% 3,0 4 2
 CCGT 250 131 15% 12,0 4 2
 Biomass 25 180 30% 6,0 4 2

 Table 2: Unit commitment parameters for thermal units.

Emission factors The level of SO2 and CO2 emissions per fuel type is determined by the fuel
 used for power production in each time-period by the individual generation
 units and the corresponding emission factors. An overview regarding the
 emission factors employed in the current analysis is provided in Table 3. Coal
 technologies with CCS remove 90% of the CO2 emissions in coal.
 CO2 content SO2 content
 Fuel
 (kg/GJ fuel) (kg/GJ fuel)
 Coal 95 0.714
 Natural gas 56.8 0
 Fuel oil 78 0.446
 Light oil 74 0.023
 Coke 106 1.428

 Table 3: Assumptions regarding the CO2 and SO2 content in different fuels per GJ of fuel energy
 content. Only fuels emitting SO2 and/or CO2 have been listed.

Decommissioning Decommissioning in Balmorel can take place both exogenously and endoge-
 nously. As explained above, existing and committed generation is decommis-
 12 | Energy Outlook Report 2019 - Data report - 20-06-2019
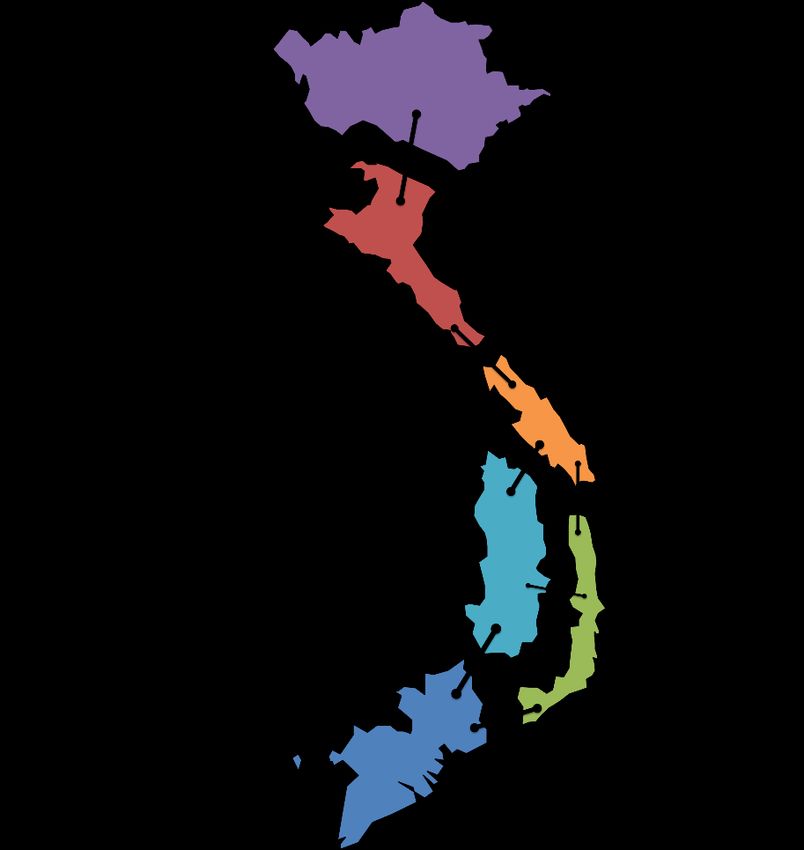
sioned exogenously by calculating the decommissioning year from the start
 year. Endogenous decommissioning is not allowed in this study.

Outages Forced and planned outages are assumed for both existing, committed and
 candidate power plants. All thermal units are characterized by an ‘availability
 factor’ of 90% to reflect the downtime for planned and unplanned outages.
 For coal power plants this outage rate is set at 80%. This factor is, however,
 applied as a constant over time, meaning that at any given time 10% (or 20%)
 of the rated generation capacity is not available. Wind, solar, and hydro are
 not set to be de-rated due to planned outages, since this is assumed to take
 place when there is no generation on the unit. Unplanned outages on these
 units are considered in their yearly energy output (full load hours).

 3.2 Existing and committed transmission capacity
 The starting point of the interconnected grid within Vietnam comprises all
 existing and committed interconnectors. The country is divided into 6 trans-
 mission regions. These regions are then connected by the transmission grid.

 Committed interconnectors are projects that are under construction, projects
 that are decided and financed, or project planned with a very high likelihood
 of being realized. . These committed interconnection projects and their net
 transfer capacities are considered as exogenous capacity just as the existing
 interconnectors.

 The figures below show maps of Vietnam with all existing and committed in-
 terconnectors for 2020 and 2030, as in PDP 7 [1].

 13 | Energy Outlook Report 2019 - Data report - 20-06-2019
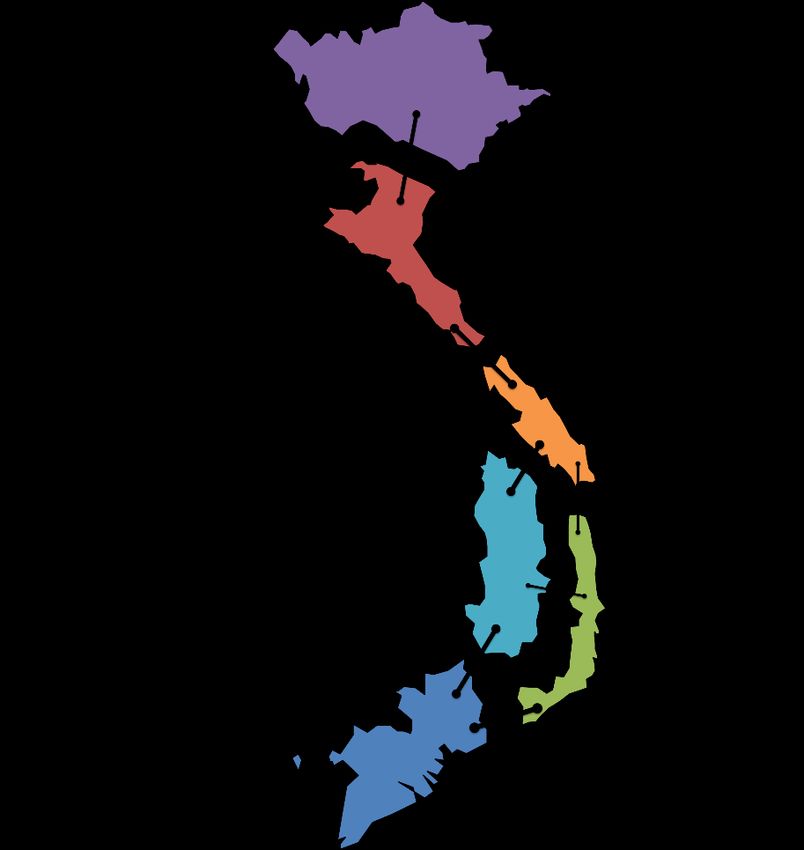
Figure 5: Existing and committed interconnectors in Vietnam, total capacity in 2020.

Figure 6. Existing and committed interconnectors in Vietnam, total capacity in 2030.

14 | Energy Outlook Report 2019 - Data report - 20-06-2019
The net transfer capacity of all interconnectors in the model is de-rated by
10% to account for planned and unplanned outages of the lines based on own
assumptions.

15 | Energy Outlook Report 2019 - Data report - 20-06-2019
4 Future developments
 4.1 Electricity demand
Annual electricity de- The power demand projections used in this study, presented in Figure 7, are
mand forecasts supplied by Institute of Energy, as result from the all-sector modelling of the
 Vietnamese energy system in the TIMES-Vietnam model. Power demand is an
 output of the latter and is used as input for the Balmorel model. More details
 can be found in the Technical background report for the EOR [4]. Disaggrega-
 tion of the national demand over the six transmission regions is based on the
 regional division used in [5].
 1,200

 1,000

 800 North
 North Central
 TWh

 600 Centre Central
 Highland
 400
 South Central

 200 South

 0
 2016
 2019
 2022
 2025
 2028
 2031
 2034
 2037
 2040
 2043
 2046
 2049

 Figure 7: Annual electricity demands per transmission region

Demand profiles Hourly demand profiles are used for all years based on statistics of 2017 [1].

 16 | Energy Outlook Report 2019 - Data report - 20-06-2019
2.5 350

 300

 TWh (North and South)
 2.0
 250

 TWh (Other)
 1.5 200

 1.0 150

 100
 0.5
 50

 0.0 0
 1
 4
 7
 10
 13
 16
 19
 22
 25
 28
 31
 34
 37
 40
 43
 46
 49
 52
 Weeks

 North South North Central
 Centre Central Highland South Central

Figure 8: Weekly demands based on hourly demand profile (2017).

4.2 Import from third countries
The import of electricity to Vietnam from third countries is shown in Figure 9.
North Vietnam imports electricity from China, while the regions North Central,
Centre Central and Highland import from Laos. For the Laos connection, a
hydro generation profile was used to represent the expected import from the
designated hydro plants in Laos, whereas for China an hourly profile was ob-
tained from [1].
 50
 45
 40
 35
 30
 TWh

 25
 20
 15
 10
 5
 0

 Highland Centre Central North Central North

Figure 9: Annual import to Vietnam

17 | Energy Outlook Report 2019 - Data report - 20-06-2019
The import of electricity from Cambodia does not have clear signals from the
government and investors, so import from Cambodia is not considered in this
report.

4.3 Fuels and fuel prices
The fuels represented in the model are summarized in Table 4.
Fuel Description Origin Available
Nuclear Uranium Imported Everywhere
NG (South-East) Natural gas Domestic South
NG (South-West) Natural gas Domestic South
NG (Block B) Natural gas Domestic South
NG (CVX) Natural gas Domestic Centre Central
LNG Liquidized natural gas Imported Everywhere
Dom. Coal (4b-5) Coal (grade 4b or 5) Domestic North/North Central
Dom. Coal (6) Coal (grade 6) Domestic North/North Central
Dom. Coal (7) Coal (grade 7) Domestic North/North Central
Imp. Coal Coal (grade 4) Domestic Everywhere
Fuel oil Fuel oil Imported Everywhere
Light oil Light oil Imported Everywhere
Rice husk Biomass Domestic Regional*
Straw Biomass Domestic Regional*
Bagasse Biomass Domestic Regional*
Wood Biomass Domestic Regional*

Table 4: Fuels used in the Balmorel model, including a description of whether the fuel is import-
ed or domestic, and in which regions the fuel is available
*These fuels are restricted by generation capacity and by fuel potential, see Figure 20.

The fuel prices used in the Balmorel model are shown in Figure 10. These are
based on the prices projected in [6], which contains details on price for-
mation, components and assumptions for the projections used. The prices
considered are CIF (Cost, Insurance and Freight) prices, i.e. reflecting the cost
associated with the fuel while still on board a ship in a Vietnamese harbour.
For imported coal and LNG, Vietnam-specific cost add-ons2 are added to ob-
tain the fuel prices as seen by the plants.

2Add-ons for coal: domestic shipping fee and transit port fee. Furthermore, differentiation in CIF price is
made depending on whether the coal is shipped to the two Northern regions, the two Central regions or
the two Southern regions. Add-ons for LNG: terminal and storage fee, transportation and distribution fee,
management and profit fee.

18 | Energy Outlook Report 2019 - Data report - 20-06-2019
Figure 10: Fuel prices. The model also uses wind, sun, hydro and geothermal power, but for
those technologies, the “fuel price” is assumed zero.

19 | Energy Outlook Report 2019 - Data report - 20-06-2019
5 Investment options
 In this chapter, investment options for generation and transmission capacity
 will be discussed together with their characteristics, learning curves, and loca-
 tions in which they can be invested in. Based on this technology catalogue, the
 Balmorel model can optimize the additional generation capacity needed to
 fulfil demand increases and to compensate for exogenous decommissioning of
 existing or committed capacity. The model will find the least-cost solution by
 choosing the cost-optimal set of generation technologies and transmission
 lines.

 5.1 Technology catalogue
 The Balmorel model has a technology catalogue with a set of power genera-
 tion technologies available for investment. The investment module allows the
 model to invest in a range of different technologies including (among others):
 coal power, gas power (combined cycle plants), small hydro, geothermal, bi-
 omass, solar PV and wind power.

Investment technology Technical and economic data for the power generation technologies that the
catalogue model may invest in can be viewed in Table 5. The data is based on [3] as well
 as some other Vietnamese and international sources. The technology assump-
 tions develop from 2020 to 2050, which means that the costs and efficiencies
 are assumed to develop depending on the learning curves of the specific
 technologies. Generally, the technologies develop to have higher efficiencies
 and lower investments costs.

 For the CCGT technologies, the model can invest in units that use domestic
 natural gas or in units that use imported LNG depending on the region.
 Ultra-supercritical coal and advanced-ultra-supercritical coal technologies
 exist as investment options. A subcritical coal unit exists with carbon-capture
 storage (CCS) as well, where the unit is more expensive, but the CO2 emissions
 are reduced by 90%.

 Slow learning curves exist for CCGT technologies, while the learning curves of
 the investment costs for solar and wind are expected to be steeper.

 Battery investments can occur independently for generation/charging capaci-
 ty and storage size. The investment characteristics are shown in Table 6.

 20 | Energy Outlook Report 2019 - Data report - 20-06-2019
CAPEX incl. Variable Technical
 Fixed O&M Efficiency
 IDC O&M lifetime
Technology type Available (Year)
 (USD/MWhe
 (kUSD/MW) (kUSD/MW) (%) (Years)
 l)
Nuclear 2030 - 2050 6,042 20.33 0.15 33% 50
Coal subcritical 2020 - 2029 1,316 39.40 0.70 36% 30
 2030 - 2049 1,422 38.20 0.12 36% 30
 2050 1,387 37.00 0.12 36% 30
Coal supercritical 2020 - 2029 1,739 41.20 0.12 37% 30
 2030 - 2049 1,598 40.00 0.12 38% 30
 2050 1,551 38.70 0.11 39% 30
Coal ultra-supercritical 2030 - 2049 1,739 54.90 0.11 43% 30
 2050 1,681 53.20 0.10 44% 30
Coal AUSC 2035 - 2050 2,427 54.90 0.11 50% 30
Coal CCS subcritical 2030 - 2049 5,049 141.89 2.28 36% 30
 2050 4,923 137.43 2.28 36% 30
CCGT 2020 - 2029 881 29.35 0.45 52% 25
 2030 - 2049 812 28.50 0.13 59% 25
 2050 755 27.60 0.12 60% 25
Small hydro 2020 - 2050 2,057 38.00 0.46 FLHs 50
Wind (Low wind) 2020 - 2024 2,145 50.11 5.20 FLHs 27
 2025 - 2029 1,915 47.56 4.92 FLHs 28.5
 2030 - 2039 1,687 44.92 4.63 FLHs 30
 2040 - 2049 1,518 42.67 4.34 FLHs 30
 2050 1,349 40.26 4.04 FLHs 30
Wind (Medium wind) 2020 - 2024 2,049 47.88 4.96 FLHs 27
 2025 - 2029 1,830 45.44 4.70 FLHs 29
 2030 - 2039 1,611 42.91 4.43 FLHs 30
 2040 - 2049 1,450 40.77 4.15 FLHs 30
 2050 1,289 38.46 3.86 FLHs 30
Wind (High wind) 2020 - 2024 1,749 40.86 4.24 FLHs 27
 2025 - 2029 1,552 38.54 3.99 FLHs 29
 2030 - 2039 1,359 36.18 3.73 FLHs 30
 2040 - 2049 1,209 33.99 3.46 FLHs 30
 2050 1,064 31.76 3.18 FLHs 30
Solar PV (Low land-
 2020 - 2024 1,247 9.20 - FLHs 25
costs)
 2025 - 2029 1,095 8.25 - FLHs 25
 2030 - 2039 942 7.30 - FLHs 25
 2040 - 2049 845 6.75 - FLHs 25
 2050 747 6.20 - FLHs 25
Solar PV (High land-
 2020 - 2024 1,333 9.20 - FLHs 25
costs)
 2025 - 2029 1,177 8.25 - FLHs 25

 21 | Energy Outlook Report 2019 - Data report - 20-06-2019
2030 - 2039 1,021 7.30 - FLHs 25
 2040 - 2049 924 6.75 - FLHs 25
 2050 826 6.20 - FLHs 25
 Geothermal 2020 - 2029 4,675 20.00 0.37 10% 30
 2030 - 2049 4,229 18.50 0.34 11% 30
 2050 4,229 16.90 0.31 12% 30
 Biomass 2020 - 2029 1,892 47.60 3.00 31% 25
 2030 - 2049 1,781 43.80 2.80 31% 25
 2050 1,558 38.10 2.40 31% 25
 MSW 2020 - 2029 9,949 234.70 24.10 28% 25
 2030 - 2049 9,263 224.80 23.40 29% 25
 2050 8,234 193.50 22.60 29% 25
 Tidal 2020 - 2050 2,961 21.75 4.00 FLHs 30

 Table 5: Power generation technology catalogue. Investment costs for battery and pumped hydro (PH) technologies are
shown per MWh storage capacity.
*Investment can either be made for using grade 4b/5 or 6 domestic coal or for using imported coal.
**Investment can either be made for using grade 4b/5 domestic coal or for using imported coal.
***Advanced ultra-supercritical; only imported coal.
IV Investment can either be made for West, East or CVX domestic natural gas or imported natural gas. Domestic natural gas

technologies can also use imported natural gas.
V Generation and charging capacity is one fourth of the storage capacity.

 CAPEX incl. CAPEX incl.
 Available Fixed O&M Variable O&M Technical life
 IDC IDC Efficiency (%)
 (Year) (kUSD/MW) (USD/MWh) time (years)
 (kUSD/MWh) (kUSD/MW)
Battery 2020 - 2029 270 500 0.62 2.28 91% 20

 2030 - 2049 160 300 0.62 2.06 92% 25

 2050 90 140 0.62 1.83 92% 30

Table 6: Battery investment options. The battery is a Li-ion battery. Battery investments can be optimized per MWh and per
MW independently.

22 | Energy Outlook Report 2019 - Data report - 20-06-2019
Interest paid during Interest during construction (IDC) is of importance when evaluating the capital
construction costs of one technology option compared to another. Units with a short con-
 struction phase pay less IDC than plants with longer construction time.
 Most capital cost data on power generation are given in overnight costs,
 meaning that no IDC is considered. Therefore, the IDC costs are added to the
 investment costs taken from [3], to ensure that the true costs of technologies
 are represented in the model.

 In this study an IDC calculation approach is used which assumes that all costs
 are distributed equally during the construction phase. The distribution of costs
 will be different from one project to another, therefore as a generic assump-
 tion this method is considered valid. The following formula is applied when
 calculating IDC.
 (1 + ) − 1
 = × × (1 + ) −
 i×t 2
 Figure 11: IDC formula. i = interest rate, t = construction time (years), a = invested capital

 The IDC has already been included in the investment costs shown in Table 5
 with an annuity factor of 10%. Construction times are used as documented in
 [3].

 Years of construction Added cost due to IDC
 1 5.0%
 1.5 7.6%
 2 10.3%
 3 15.9%
 4 21.8%
 5 28.2%
 6 35.0%
 7 42.3%
 8 50.1%
 9 58.4%
 10 67.3%

 Table 7: IDC cost depending on years of construction.

Wind technologies Three turbine types are implemented as investment options in Balmorel. Their
 investment and fixed O&M costs have been based on the technology cata-
 logue [3], but adapted to the turbine specifications used in the model. The
 technology catalogue details costs for a specific development in turbine tech-
 nology. The turbine characteristics modelled in Balmorel differ from those in
 the technology catalogue (TC) because they are optimized for the wind re-
 sources in Vietnam. To adjust for the differences between the Balmorel tur-
 bines and the TC turbines, the investment costs and O&M costs are scaled
according to the diameter size and the hub height. This method is described in
[7]. The specific power (SP) and hub heights of the three modelled turbines
are shown in Table 8. As the generator size is assumed to increase over the
years, the rotor diameter is also expected to increase.

 SP Hub height
Low wind class 200 100
Medium wind class 200 90
High wind class 285 85
Table 8: Specific power (SP) in W/m2 and hub height in m for the 3 onshore wind turbines mod-
elled as investment options.

The Low and the Medium wind class power turbines share the same power
curve and differ only in height. The power curves of the wind turbines used in
Balmorel are shown in Figure 12.

 100%

 90%

 80%

 70%
 % of capacity

 60%

 50%

 40%

 30%

 20%

 10%

 0%
 0 1 2 3 4 5 6 7 8 9 10 11 12 13 14 15 16 17 18 19 20

 Low & medium High Offshore

Figure 12: Power curves used in Balmorel

The power generation is modelled according to the following equation:

 =
 1+ (− ∗ ∗( − − ))

Where P is the generation share of capacity, u the wind speed, is the peak
capacity (between 0 and 1), g the growth rate, Kw the smoothening factor, M
the max growth and a reality factor.

24 | Energy Outlook Report 2019 - Data report - 20-06-2019
The reality factor has been set to 0.7 as an average value.
 The smoothening and peak factor are representing that the power curve
 should represent many turbines spread over a large region and therefore a
 smoother power curve should be applied. The smoothening and peak factor
 are based on region size and shown in Table 9.

 Kw γ
 North 0.80 0.95
 North Central 0.90 0.98
 Centre Central 0.95 0.99
 Highland 0.95 0.99
 South Central 0.90 0.98
 South 0.90 0.98
 Table 9: Smoothening and peak factor per region.

 The offshore wind technology is based on [3], both for the specific power and
 the hub height (Table 10). Its power curve for 2050 can be seen in Figure 12.

 SP Hub height
 2020 309 90
 2030 353 125
 2050 332 140
 Table 10: Specific power (SP) in W/m2 and hub height in m for the offshore wind turbines mod-
 elled as investment options.

Solar technologies For solar technologies, the generation profile and full load hours are based on
 irradiation data and temperature data. The technology assumptions made to
 determine these generation profiles are the following:
 • South facing panels, with a tilt of 12˚
 • 16% efficiency under test conditions
 • 0.07%/˚C efficiency reduction under temperatures higher than 25˚C
 • 1.1 Wp/Wac
 • 10% for other losses (not due to high temperatures)
 A learning curve is applied to the FLHs. The relative increase in FLHs is shown
 in Figure 13, based on the development described in [3].

 25 | Energy Outlook Report 2019 - Data report - 20-06-2019
12%

 10%

 8%

 6%

 4%

 2%

 0%
 Existing 2020 - 2024 2025 - 2029 2030 - 2039 2040 - 2049 2050

 Figure 13: Relative increase in solar full load hours due to technology improvements.

 The model can invest in solar technologies with two different capital costs:
 • Low land cost: assumes a cost of 6 USD/m2 for land use
 • High land cost: assumes a cost of 12 USD/m2 for land use
 For the land cost calculation, a land use factor of 12 m2/kWp or 14.4m2/kWac is
 assumed based on existing solar PV cases in Vietnam. The land cost is esti-
 mated from the feasibility study document of the solar PV projects [1] and
 decisions on land prices by land use purposes of some potential provinces
 (average land cost).

Pumped hydro projects Apart from the generic technologies, the model can also invest in specific
 large pumped hydro projects with reservoir, which are planned in PDP7 after
 2020. These projects are located in a specific region and have a maximum
 capacity (Table 11). Pumped hydro is assumed to have efficiencies of 80%.
 Maximum Maximum
 CAPEX incl. IDC Turbine/Pump Reservoir
 Project (Area) MWh/ MW
 (kUSD/MWh) capacity capacity
 (MW) (MWh)
 Moc Chau PSPP (North) 92 900 7,129 8
 Phu Yen East PSPP (North) 62 1,200 17,518 15
 Phu Yen West PSPP (North) 105 1,000 8,502 9
 Chau Thon PSPP (North Central) 106 1,000 8,502 9
 Don Duong PSPP (Highland) 107 1,200 10,479 9
 Ninh Son PSPP (Highland) 98 1,200 10,390 9
 Ham Thuan Bac PSPP (South Central) 101 1,200 10,390 9
 Bac Ai PSPP (South Central) 97 1,200 10,104 8

 Table 11: Specific large hydro projects [8].

 26 | Energy Outlook Report 2019 - Data report - 20-06-2019
Locations for invest- Most technologies can be invested in by the model in all 6 regions. However,
ments some exceptions to this rule apply:
 • Nuclear capacity: Only in Centre Central and South Central
 • Domestic coal technologies: Only North and North Central
 • Domestic NG (East and West) technologies: Only in South
 • Domestic NG (CVX gas) technologies: Only in Centre Central

Investment restrictions Nuclear power plants historically have been characterized by complex devel-
 opment process and lengthy construction timelines. In order to make sure
 that the modelling results are realistic with regard to the build-out of nuclear
 capacity, a maximum capacity addition cap is set for every 5-year period, as
 illustrated in Figure 14.

 35

 30

 25

 20
 GW

 15

 10

 5

 0
 2015 2020 2025 2030 2035 2040 2045 2050
 Nuclear limit 0 0 5 10 15 20 25 30

 Figure 14: Nuclear capacity build-out limitations implemented in the Balmorel model.

 5.2 Interconnector investment costs
 The investment costs for new lines are shown in Figure 15. The investment
 rate of the transmission lines is taken from the PDP7 revised [5].
 Investment costs for each transmission line ($/MW/km) are assumed as fol-
 lows:
 - 500kV line: 600 $/MW/km
 - 220kV line: 850 $/MW/km
 Based on the distance between regions, the investment cost is estimated in
 Table 12.

 27 | Energy Outlook Report 2019 - Data report - 20-06-2019
Connection Length Investment
Connection
 Voltage (kV) (km) cost ($/MW)
North - North Central (1-2) 500 300 180,000
North Central - Centre Central (2-3) 500 350 210,000
Centre Central - Highland (3-4) 500 250 150,000
Centre Central - South Central (4-5) 500 350 210,000
Highland - South (4-6) 500 300 180,000
South Central - South (5-6) 500 250 150,000
Highland - South Central (4-5) 220 150 127,500

Table 12: Voltage levels, lengths and investment costs for each transmission line.

Figure 15: Investment costs in new transmission capacity between the 6 regions

When using higher voltage lines (1000kV AC or 800kV DC), the investment
cost will be double compared to the 500kV AC line, but the transmission ca-
pacity of the line also will be double. In this way, we still can use the reported
investment rate (USD/kW) for transmission investment (Table 12).

28 | Energy Outlook Report 2019 - Data report - 20-06-2019
6 Fuel and RE resources and potentials
For domestic coal, domestic natural gas, hydro, biomass, MSW, solar PV and
wind, investment restrictions are set to account for the limited resource avail-
ability. These restrictions are based on best available estimates of different
resource potentials and act as upper limits not to be exceeded. These, how-
ever, might not necessarily be ‘binding’ in the model in the sense that the
optimization might end up with results well below the potentials.

6.1 Domestic coal and natural gas
For domestic coal and domestic natural gas the restrictions are set on the fuel
potential, expressed in energy terms, as presented in Figure 16, Figure 17 and
19. Domestic coal is only found in Northern Vietnam and is represented as
two coal grades with different qualities:
 • High: High quality and higher fuel price (coal grade 4b and 5)
 • Low: Lower quality and lower fuel price (coal grade 6).
 • Very Low: Lowest quality and lower fuel price (coal grade 7) - not re-
 stricted (only few existing plants use this fuel and there are no in-
 vestment options)
The domestic coal resources are based on [9].

Two types of domestic natural gas are only used in the South and limited in
fuel resource (East and West NG, Figure 17) [10]. The third type (CVX gas) of
natural gas is used only in Centre Central and is limited in generation capacity
(see Figure 18). A fourth type of domestic natural gas (Block B gas) is only
found in the South region but no restrictions are implemented as there is no
investment option available for this fuel type.

To represent the take-or-pay contracts in place for natural gas, 95% of the
annual domestic natural gas resource available for the power sector must be
used for electricity generation. For the domestic coal resource, the same re-
striction is applied to represent coal use contracts for domestic mines.

29 | Energy Outlook Report 2019 - Data report - 20-06-2019
500
 450
 400
 350
 300
 250

 PJ
 200
 150
 100
 50
 0

 Coal grade 4b+5 Coal grade 6 Coal grade 7

Figure 16: Maximum domestic coal use (PJ).

 350

 300

 250

 200
 PJ

 150

 100

 50

 0

 South East NG South West NG CVX gas

Figure 17: Maximum domestic natural gas use in South (East and West NG, PJ).

30 | Energy Outlook Report 2019 - Data report - 20-06-2019
5

 4.5

 4

 3.5

 3
 GW
 2.5

 2

 1.5

 1

 0.5

 0

 Figure 18: Maximum domestic natural gas use in Centre Central (CVX gas, GW).

 6.2 Hydro
Hydro resource There are two types of hydro power plants – hydro run-of-river plants and
 hydro reservoir plants. For both types the annual generation (ignoring spillag-
 es) is set by the full load hours of the area in which the plant is located and
 the capacity of the plant. Run-of-river plants do not have any reservoir capaci-
 ty, and therefore must generate in accordance with the water inflow into the
 plant (though the option for water spillage is still available).

 Reservoir plants can store the water and the model will use this functionality
 to maximise the value of the water. Both run-of-river and reservoir hydro
 plants are assigned a hydro inflow profile in the model. This profile in combi-
 nation with the full load hours will correspond to the generation profile of a
 run-of-river plant, since the water must be used when available for this tech-
 nology type. For a reservoir plant this profile will tell the model the level of
 water inflow to the reservoir throughout the year.
 Run-of-river plants are modelled per region (one area per region). This means
 all run-over-river plants in the same region have the same inflow profile and
 full load hours. All regions see 2850 full load hours for small hydro.

 Each existing and committed large hydro plant (modelled as reservoir plant) is
 modelled in its own area. This means that each plant has its own full load
 hours and reservoir size (acquired from [1]), as shown in Appendix III. When

 31 | Energy Outlook Report 2019 - Data report - 20-06-2019
no FLHs were available, a regional average was used based on the hydro
plants for which data was available.

The reservoir sizes are expressed in the model as percentages of total annual
generation and are calculated for the hydro plants for which data was availa-
ble. For the hydro generation, where no reservoir information was found (in-
cluding all committed generation), the average for that region was used. Full
load hours and reservoir averages are shown in Figure 19.

 5,000 60%
 4,500
 50%
 4,000
 3,500
 40%
 3,000
 Hours

 2,500 30%

 %
 2,000
 20%
 1,500
 1,000
 10%
 500
 0 0%
 North North Centre Highland South South
 Central Central Central

 FLHs Reservoir size

Figure 19: Full load hours and reservoir size for large hydro (average per region).

The hydro inflow profiles are based on the monthly inflow data received from
IE [11] for 69 individual hydro plants and are averaged per region to approxi-
mate an inflow profile for the remaining plants (both reservoir and run-of-
river).

6.3 Biomass and MSW
Restrictions on biomass-fired power generation capacity have been imple-
mented based on an estimate of biomass resources that could be realistically
used for power generation applications [12], as presented in Figure 20.

32 | Energy Outlook Report 2019 - Data report - 20-06-2019
5.0

 4.5

 4.0

 3.5 South
 3.0 South Central

 2.5 Highland
 GW
 2.0 Centre Central
 North Central
 1.5
 North
 1.0

 0.5

 0.0
 Rice husk Wood Bagasse Straw Biomass

Figure 20: Resource limits on biomass-fired power generation capacity implemented in the
Balmorel model (GW).

Similarly, limitations on the availability of Municipal Solid Waste (MSW), have
been implemented [12], presented in Figure 21. The MSW potential has been
based on the urban population in each of the 63 provinces and the proportion
of solid waste assumed to be available for power production out of the total.
A maximum annual capacity factor of 70% is implemented for power plants
using MSW.

 1,800
 1,600
 1,400
 1,200
 1,000
 MW

 800
 600
 400
 200
 0

 North North Central Centre Central Highland South Central South

Figure 21: Resource limits on MSW-fired power plant generation capacity implemented in the
Balmorel model (MW).

33 | Energy Outlook Report 2019 - Data report - 20-06-2019
In addition to the capacity restraints, fuel constraints for bagasse, (all other)
 biomass and MSW are implemented based on the results from TIMES model-
 ling by [4]
 400

 350

 300

 250
 Bagasse
 200
 PJ

 Other biomass
 150 MSW

 100

 50

 0
 2020 2030 2040 2050

 Figure 22: Resource limits on biomass and MSW fuel use implemented in the Balmorel model
 (PJ) – based on TIMES results.

 6.4 Onshore wind
Wind resource In order to represent the intermittent and variable nature of wind resources,
 hourly wind speed time series per regional wind class are used in the model.
 Within the framework of the current study, hourly wind speed time series
 have been kindly provided by Vestas, as well as DTU Wind (output from the
 wind resource mapping component of the activity “Resource Mapping and
 Geospatial Planning Vietnam” under contract to The World Bank, for which no
 publicly available results were available at the time of writing this report).
 Hourly wind speed time series of a ‘normal’ wind year (i.e. the year with the
 median annual average wind speed out of a sample of 9 modelled years) have
 been selected to be used in the model. The wind speed profiles provided by
 DTU Wind have been applied in the analysis due to the higher number of data
 points (63 locations nationally) in the data set obtained.

 The wind speed profiles of 18 provinces were used to represent the 18 wind
 areas (6 regions with 3 wind speed classes each).
 The 63 Vietnamese provinces were grouped per region and divided over the
 wind classed by average annual wind speed by the following classification
 which matches the wind speed groups 4.5 – 5.5 m/s, 5.5 - 6 m/s, above 6 m/s
 at a height of 100m instead of 80m (shear factor of 0.175 assumed).
 • Low: 4.67 – 5.72 m/s
 • Medium: 5.72 – 6.24 m/s
 34 | Energy Outlook Report 2019 - Data report - 20-06-2019
• High: 6.24 m/s and higher
The average annual wind speed per region and per wind class was used to
scale the wind speed profile which was closer to this annual wind speed.
The resulting provinces and average wind speeds are shown in Table 13.

 Average wind
 Wind Wind speed
 Region speed
 Category Province
 (at 100m)
North High Thai Binh 6.88
 Medium Ha Giang 6.12
 Low Hai Duong 4.92
North Central High Quang Binh 7.57
 Medium Ha Tinh 6.01
 Low Thanh Hoa 4.83
Centre Central High Quang Ngai 6.84
 Medium Thua Thien - Hue 6.05
 Low Da Nang City 4.86
Highland High Dak Lak|Dac Lac 7.74
 Medium Kon Tum 6.08
 Low Dac Nong 5.33
South Central High Binh Dinh 8.28
 Medium Phu Yen 6.50
 Low Binh Thuan 5.50
South High Ca Mau 7.39
 Medium Dong Thap 5.99
 Low Binh Phuoc 4.86
Table 13: The 18 wind areas in Balmorel, 3 per region and wind category.

 9
 8
 7
 6
 5
 m/s

 4
 3
 2
 1
 0
 North North Centre Highland South South
 Central Central Central

 Low Medium High

Figure 23: Average wind speed (at 100m) per region and wind speed class.

35 | Energy Outlook Report 2019 - Data report - 20-06-2019
It is important to note that the wind speeds used in the power curves men-
 tioned in section 5.1 on wind technologies, will be at hub height. The average
 wind speed at hub height can be calculated from the given number as:

 = 100 × ( )
 100
 Where x is the hub height and α is the shear factor. The shear factor of a re-
 gion depends on the roughness and height of the location. For Vietnam they
 were assumed as shown in Table 14:

 α
 North 0.18
 North Central 0.18
 Centre Central 0.18
 Highland 0.17
 South Central 0.17
 South 0.17
 Table 14: Shear factor per region.

Wind capacity potential Land-based wind resource potential estimates have been based on [2], as
 shown in Table 15. The Low wind speed class has wind speeds between 4.5-
 5.5m/s, the Medium between 5.5-6 m/s and High wind speed classes 6 m/s
 and up at a height of 80m.

 (m/s at 80m)
 4.5-5 5-5.5 5.5-6 6-6.5 6.5-7 7-7.5 > 7.5 Total
 →
 North 9,681 2,410 421 38 15 0 0 12,565
 North Center 6,691 2,655 1,212 123 28 0 8 10,717
 Mid Center 6,362 3,392 1,240 179 57 5 0 11,235
 Highland 34,397 27,773 14,822 3,369 154 27 30 80,572
 South Center 12,767 7,689 4,463 2,381 973 271 34 28,578
 South 15,070 41,518 16,765 285 0 0 0 73,638
 Total 84,968 85,437 38,923 6,375 1,227 303 72 217,305

 Table 15: Wind potential in Vietnam (MW).

 The resulting regional potentials divided over the different wind speed classes
 can be seen in Figure 24.

 36 | Energy Outlook Report 2019 - Data report - 20-06-2019
80

 70

 60

 50
 GW High
 40 Medium

 30 Low

 20

 10

 0
 North North Central
 Centre CentralHighlandSouth Central South

Figure 24: Resource potentials for onshore wind generation capacity per region and wind speed
class implemented in the Balmorel model. Low: 4.5-5.5 m/s, Medium: 5.5-6 m/s, High: over 6
m/s (all at 80 m height).

6.5 Offshore wind
Vietnam displays potential for offshore wind power. In this study, the off-
shore wind areas close to Ninh Thuan (South Central region) have been con-
sidered in the modelling and included as 6 areas (Figure 25) each with a po-
tential of 1000 MW (based on the size of the area). Each of the 6 areas is
modelled with individual wind speed profiles based on [13]. Offshore wind
shows much higher wind speeds compared to onshore wind (average of 9.73
m/s for the whole area, with area “E” having an average windspeed of 10.31
m/s). Other areas for offshore wind, in addition to the Ninh Thuan region,
could be further investigated in future studies.

37 | Energy Outlook Report 2019 - Data report - 20-06-2019
Figure 25: Offshore wind potential close to Ninh Thuan (South Central).

 6.6 Solar
Solar resource The solar generation profiles in Balmorel are calculated by assigning hourly
 profiles and full load hours to generate a production profile.
 Solar irradiation and temperature profiles for 5 measurement locations are
 used from the project under the auspices of the ESMAP initiative of the World
 Bank [14]. These were used to calculate the generation profile assuming solar
 panels characteristics as described in section 5.1. The resulting solar full load
 hours of the 6 regions for existing technologies are shown in Figure 26. These
 full load hours increase in future years due to technology developments as
 shown in Figure 13.

Solar capacity potential The solar potentials are based on the draft Vietnam Renewable Energy Devel-
 opment Plan [2], as shown in Table 16. The figures for the high potential case
 are used in the model, along with the full load hours (existing technologies),
 as shown in Figure 26. It is assumed that half of this potential can be used at
 low land costs, and the other half at high land costs. It should be noted that
 the methodology for the solar potential is roughly estimated and does not
 include potential increases in connection costs or construction costs (e.g.
 when moving to areas further away from the transmission grid or roads re-
 spectively).
 38 | Energy Outlook Report 2019 - Data report - 20-06-2019
Base High
North 40 6,689
North Central 100 736
Centre Central 664 8,938
High land 28,289 140,466
South Central 41,549 71,422
South 95,725 152,201
Total 166,367 380,452
Table 16: Solar potential for a base and high case (MW) [2].

 160 1,800
 140 1,600

 120 1,400
 1,200
 100

 Hours
 1,000
 GW

 80
 800
 60
 600
 40 400
 20 200
 0 0
 North North Centre Highland South South
 Central Central Central

 Potential Full load hours

Figure 26: Solar potential and full load hours per region implemented in Balmorel.

6.7 Renewable energy requirements
In the model a renewable energy requirement is enforced. This requirement
states that a certain percentage of the total generation in Vietnam needs to
be supplied by renewable energy sources.

The shares of renewable energy that need to be achieved for each modelled
year are shown in Figure 27 and based on The Renewable Energy Plan, Prime
Minister’s Decision No. 2068, 2015. The goal of the RE Plan is to increase the
contribution of RE in power generation, including large hydro [15].

39 | Energy Outlook Report 2019 - Data report - 20-06-2019
50%
 45%

 RE share (%) of total generation
 40%
 35%
 30%
 25%
 20%
 15%
 10%
 5%
 0%
 2020 2025 2030 2035 2040 2045 2050
 Main 38% 35% 32% 35% 38% 40% 43%

Figure 27: Renwable energy (RE) goals in Vietnam.

The following fuels are implemented as renewable in the model:
 • Wind
 • Solar
 • Hydro (including large hydro)
 • MSW
 • Rice husk
 • Straw
 • Bagasse
 • Wood
 • Other biomass
 • Geothermal
 • Tidal

40 | Energy Outlook Report 2019 - Data report - 20-06-2019
References

[1] IE, Institute of Energy.

[2] MOIT, “Draft Vietnam Renewable Energy Development Plan,” 2019.

[3] EREA & DEA, “Vietnamese Technology Catalogue. Technology data input
 for power system modelling in Vietnam,” Hanoi, 2019.

[4] EREA & DEA, “Technical report. Background to the Vietnam Energy
 Outlook Report 2019,” Hanoi, 2019.

[5] Institute of Energy, “PDP7-Revised,” MOIT.

[6] EREA & DEA, “Fuel Price Projections for Vietnam. Background to the
 Vietnam Energy Outlook Report.,” 2019.

[7] International Energy Agency, “Task 26 - Impacts of Wind Turbine
 Technology on the System Value of Wind in Europe,” 2017.

[8] JICA, “Master plan study for Pumped Storage Hydro power plant and
 optimization of peak power generation in Vietnam,” 2004.

[9] Vinacomin, “Vietnam Coal industry development plan up to 2030,” 2016.

[10] PVN (Vietnam Petrolium Corporation), “Vietnam Gas industry
 development plan up to 2035,” 2016.

[11] JICA, EVN, IE, “Study on review of the hydrological data of hydro power
 projects in Vietnam,” 2004.

[12] “Viet Nam’s Renewable Energy Development Strategy up to 2020 with an
 Outlook to 2050,” 2015.

[13] Van Quang Doan et al., “Offshore wind power potential in Vietnam sea,”
 Wind Energy, 2018.

[14] World Bank, “Energydata,” November 2018. [Online]. Available:
 https://energydata.info/dataset/esmap-solar-measurements-in-vietnam.

[15] IEA, “Reducing emissions from fossil-fired generation - Indonesia,

41 | Energy Outlook Report 2019 - Data report - 20-06-2019
Malaysia and Viet Nam,” International Energy Agency, Paris, 2016.

[16] S. P. a. I. Staffell, “Renewables Ninja,” 2016. [Online]. Available:
 https://beta.renewables.ninja/.

[17] D. G. Nguyen, “ “The Potential of Biogas and Biomass from Agriculture
 and Agro-Industry for Power and Heat Generation in Vietnam”,” 2013.

[18] T. Dung, Solarlab-Institute of Physics, 2009.

[19] GIZ, “Wind Data Analysis,” 2013.

[20] GIZ, “Feasibility studies,” 2015.

[21] International Energy Agency, “World Energy Outlook,” 2016.

[22] GIZ, “The Potential of Biogas and Biomass from Agriculture and Agro-
 Industry for Power and Heat Generation in Vietnam”.

[23] Institute of Energy, “BÁO CÁO TỔNG KẾT THỰC HIỆN NHIỆM VỤ”.

[24] IEA Wind Task 26, “Wiser, R., Jenni, K., Seel, J., Hand, M., Lantz, E., and
 Smith, A. Forecasting Wind Energy Costs & Cost Drivers - The Views of the
 World's Leading Experts,” 2016.

[25] Ea Energy Analyses and DHI GRAS, “Macroeconomic Cost-Benefit Analysis
 for Renewable Energy Integration (interim results),” 2017.

[26] CIEMAT, CENER and IDAE, “Maps of solar resource and potential in
 Vietnam,” AECID and MOIT.

[27] DTU, Work-in-progress output from the wind resource mapping
 component of the activity Resource Mapping and Geospatial Planning
 Vietnam under contract to The World Bank, 2017.

[28] Ea Energy Analyses, Institute of Energy, “Long term fuel price projections
 for Vietnam,” Hanoi, 2019.

42 | Energy Outlook Report 2019 - Data report - 20-06-2019
Appendix
Appendix I: Exogenous capacity

43 | Energy Outlook Report 2019 - Data report - 20-06-2019
Name Region Capacity (MW) Fuel Start year
Da Nhim South - Center 160 Hydro 1964
Thu Duc #1 ST South 33 East FO 1966
Thu Duc #5 GT South 15 East FO 1968
Thu Duc #6 GT South 15 East FO 1969
Thu Duc #2 ST South 66 East FO 1972
Thu Duc #3 ST South 66 East FO 1972
Thac Ba North 120 Hydro 1973
ND Can Tho South 33 FO 1975
Uong Bi North 105 Domestic coal 4b&5 1977
Pha Lai 1 North 400 Domestic coal 4b&5 1986
Tri An South 400 Hydro 1989
Thu Duc #4 GT South 23 East FO 1989
DRAY HLING Central Highlands 28 Hydro 1990
Ba Ria GT #1 South 23 East FO 1991
Ba Ria GT #2 South 23 East FO 1991
Thu Duc #7 GT South 33 East FO 1992
Thu Duc #8 GT South 33 East FO 1992
Hoa Binh North 1920 Hydro 1994
Vinh Son South - Center 66 Hydro 1994
SUOI VANG Central Highlands 10 Hydro 1995
Thac Mo South 150 Hydro 1995
Phu My 2-1extension South 440 East Gas, East LNG 1999
 after 2026
TBK Can Tho South 150 Diesel 1999
Hiep Phuoc (IPP) #1 ST South 0 East FO, retired after 1999
 2025
Hiep Phuoc (IPP) #2 ST South 0 East FO, retired after 1999
 2025
Hiep Phuoc (IPP) #3 ST South 0 East FO, retired after 1999
 2025
Song Hinh South - Center 70 Hydro 2000
Buorbon South 24 Biomass 2000
Ham Thuan South - Center 300 Hydro 2001
Da Mi South - Center 175 Hydro 2001
BaRiaC/C#1GT3x37.5ST56 South 168,5 East Gas, East LNG 2001
 after 2023
Pha Lai 2 North 600 Domestic coal 4b&5 2002
Ba Ria C/C#2 GT3x37.5MW, South 174,5 East Gas, East LNG 2002
ST1x62M after 2023
Can Don South 78 Hydro 2003
Phu My 2-1 South 450 East Gas, East LNG 2003
 after 2024
Na Loi North 9 Hydro 2004
Ryninh Central Highlands 9 Hydro 2004
Amata+Vedan South 92 East FO 2004
Formosa 1 South 150 Imported coal 2004
Phu My 1 South 1090 East Gas, East LNG 2004
 after 2024
Na Duong I #1 North 55 Domestic coal 6 2005
Na Duong I #2 North 55 Domestic coal 6 2005
Phu My 2.2 South 720 East Gas, East LNG 2005
You can also read