Elevation-dependent behavior of hoar-prominent snowpack on forest slopes in the Japanese Central Alps based on a decade of observations
←
→
Page content transcription
If your browser does not render page correctly, please read the page content below
Annals of Glaciology 59(77) 2018 doi: 10.1017/aog.2018.33 77
© The Author(s) 2018. This is an Open Access article, distributed under the terms of the Creative Commons Attribution licence (http://creativecommons.
org/licenses/by/4.0/), which permits unrestricted re-use, distribution, and reproduction in any medium, provided the original work is properly cited.
Elevation-dependent behavior of hoar-prominent snowpack on
forest slopes in the Japanese Central Alps based on a decade
of observations
Yusuke HARADA,1 Ryuzo WAKABAYASHI,2 Yoshikage INOUE3
1
Snow Avalanche and Landslide Research Center, Public Works Research Institute, Myoko 944-0051, Japan
E-mail: y-harada@pwri.go.jp
2
Alpine Research Institute of Avalanche, Hakuba 399-9301, Japan
3
Lodge Taishikan Mt. Fuji, Fujiyoshida 403-0005, Japan
ABSTRACT. Full snow-pit observations were performed on a monthly basis over ten winter seasons from
1995 to 2004, at 15 study plots spaced at 100 m elevation intervals (1300–2700 m a.s.l.) in the moun-
tainous forest of the Japanese Central Alps. We observed 514 pits with an average depth of 1.12 m.
Density measurements were taken in 2610 snow layers in total. Monthly trends indicate that snow
depth has a strong linear correlation with elevation and that the mean density of snow cover has a mod-
erate linear correlation with elevation in midwinter. Snow water equivalent can increase as a quadratic
function of elevation in January and February. For this reason, the influence of overburden load and wind
packing is elevation-dependent from January to February, a period when a facet-prominent snowpack
existed on account of low snow and air temperatures. The density of depth hoar is greater at higher ele-
vations than it is for rounded grains in midwinter due to densification. On forested slopes, with increas-
ing elevation, snowfall frequency and the impact of wind upon snow increases while air temperature
decreases, causing elevational variance in grain shapes.
KEYWORDS: snow metamorphosis, snow physics, wind-blown snow
INTRODUCTION depth at high resolution (e.g. Deems and others, 2013).
Seasonal snow affects humans by shaping global climate and However, few studies have focused on mountain snowpack
water resources. The layer structure of the snowpack reflects upon forested slopes within a single basin have investigated
the characteristics of the region and climate. In particular, differences in elevation based on observations of snowpack
mountain snowpacks are highly variable due to differences structure, grain shape and density throughout a snow
in forest cover and elevation. The study of regional character- season. To obtain reliable results in this regard, it is necessary
istics of mountainous snowpacks has helped to derive ava- to dig many snow pits across several winters.
lanche warning applications (e.g. Pielmeier and In this study, we reveal the relationship between elevation
Schneebeli, 2003), as well as snow avalanche climatology and snowpack properties on forested slopes, focusing on
in North America (e.g. Armstrong and Armstrong, 1987; density and grain shape, based on a decade of observations.
Mock and Birkeland, 2000; Haegeli and McClung, 2003) Some of the contents of this study were included in a prelim-
and the central mountains of Japan (Ikeda and others, inary report by the same authors in 2007 (Wakabayashi
2009). The study of mountain snow cover from a hydro- and others, 2007). This paper extends the former analysis
logical viewpoint began during the 1920s–1930s in by considering metamorphism processes, using density and
Europe, in the 1930s in the western USA, and in the 1950s grain size data.
in Japan (e.g. Yamada, 1983; Laternser and Schneebeli,
2003; Helms and others, 2008). In Japan, snow surveys
were done intensively from March to April and revealed rela- METHODS
tionships between elevation and snow water equivalents
(Matsuyama, 1998). However, observation data collected Study site
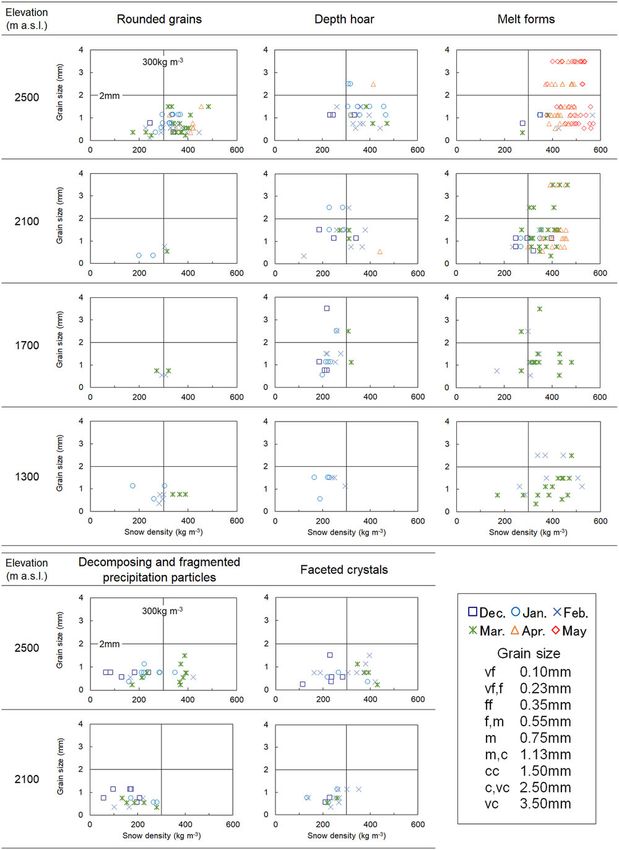
at sites over a limited period in the snow season still leave The study site was Nishikoma Station, which is located on
room for doubt with regard to the selection of the most appro- the northeast slopes of the northern Japanese Central Alps
priate values, such as snow water equivalents in mountain- (N35°48–49′, E137°49–51′; Fig. 1a). An observation route
ous regions. Given the varied mountainous snowpack was created from 1300 to 2700 m a.s.l., and 15 fixed plots
conditions and catchment water balance in different for full snow pit (from the snow surface to the ground) obser-
seasons, it is therefore important to conduct snow surveys vation were placed at 100 m elevation intervals along this
throughout a snow season at different elevations. route (Fig. 1b). Sites were selected upon ridges and forested
In recent decades, mountain snow depth and snow water slopes within a single basin. The observation team avoided
equivalent have been estimated using climate models, satel- avalanche and slip risks, and the snowpack was studied at
lites and physical snow models (e.g. Mote and others, 2005; elevations with minimal influence of blowing snow and ava-
Dressler and others, 2006; Schmucki and others, 2014). Lidar lanches. None of the study plots were shaded by evergreens
is a remote-sensing technology that can measure areal snow in the winter season (Fig. 2, Table 1). This area has been
Downloaded from https://www.cambridge.org/core. 29 Oct 2021 at 03:00:06, subject to the Cambridge Core terms of use.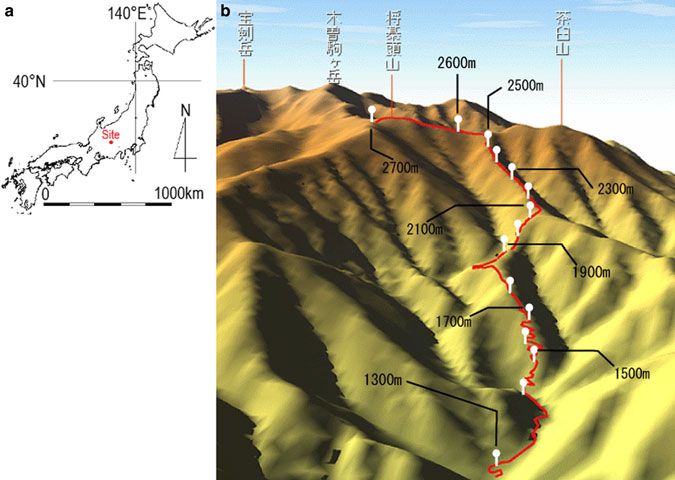
78                                                          Harada and others: Elevation-dependent behavior of hoar-prominent snowpack on forest slopes

              Fig. 1. Location of the study site: (a) map, and (b) aerial view looking northeast from 2700 m a.s.l. using a digital map provided by the
              Geographical Survey Institute of Japan.

              classified as a depth hoar region in midwinter (Ishizaka,                                each of the 15 study plots on a monthly basis. Following
              2008). The plot at 1900 m a.s.l. has been classified as                                  each full snow-pit observation, the pit was refilled, and the
              having a ‘rainy continental snow climate’ (Ikeda and                                     next observation was taken from a pit dug 0.5 m in front of
              others, 2009). Since air temperature was not continuously                                the previous one.
              measured at the study sites, we extrapolated data from the                                   Vertical profiles of snowpack height, grain shape, grain
              Ina weather station (N35°48.5′, E137°58.7′, 674 m a.s.l.) of                             size, hand hardness and snow temperature (at 10 cm inter-
              the Automated Meteorological Data Acquisition System                                     vals) were constructed from full snow-pit observations, fol-
              (AMeDAS), which is located ∼10 km to the east of the                                     lowing guidelines of the Canadian Avalanche Association
              study sites. Table 2 shows the average monthly temperatures                              (CAA, 1995). Snow height was measured from the snow
              at 1300, 1700, 2100 and 2500 m a.s.l. using AMeDAS data                                  surface to the ground using a probe with a precision of 1
              from Ina and a lapse rate of 6°C km–1 (Ikeda and others,                                 cm. In this study, snowpack height was treated as snow
              2009).                                                                                   depth at the study plots because we were able to confirm
                                                                                                       ground conditions during full snow-pit observations. In add-
                                                                                                       ition, snow densities at the center of each grain shape layer
              Full snow-pit observations                                                               were measured using rectangular and cylindrical samplers
                                                                                                       of 100 cm3 capacity. Results are represented as the snow
              During the ten winter seasons from 1995 to 2004, full snow-
                                                                                                       density of each layer. When full snow-pit observations
              pit observations or snow-depth surveys were performed at
                                                                                                       were not conducted, only snow depth was measured, using
                                                                                                       the probe with 1 cm markings for a total of five or six mea-
                                                                                                       surements to account for the fact that we could not confirm
                                                                                                       ground conditions. Average values were calculated after
                                                                                                       removing the maximum and minimum values.

                                                                                                       Definitions of summarized data
                                                                                                       There were various types of grain shapes in the snowpack
                                                                                                       profiles. The percentage of grain shapes in a snowpack
                                                                                                       profile was defined as the distribution ratio of grain shapes.
                                                                                                       In cases where a snow layer comprised two or more grain
                                                                                                       shapes, two types were selected in descending order and
                                                                                                       divided by half the layer thickness. Overburden load is the
                                                                                                       force exerted by the snowpack on the target layer due to its
                                                                                                       weight, and was calculated using density and thickness mea-
                                                                                                       sured from the snowpack surface to the center of the target
                                                                                                       layer in this study. Grain sizes were split into five classes
                                                                                                       (CAA, 1995). Size classes as percentages of all classes for
              Fig. 2. A sample crown cover diagram based on survey data (2300                          all observations over 10 years were defined as the frequency
              m a.s.l.).                                                                               of grain size classes.

Downloaded from https://www.cambridge.org/core. 29 Oct 2021 at 03:00:06, subject to the Cambridge Core terms of use.
Harada and others: Elevation-dependent behavior of hoar-prominent snowpack on forest slopes                                                                       79

          Table 1. Details of trees surrounding selected study plots

          Elevation           Height of trees           Evergreens           Deciduous trees             Withering trees           Measuring range (m2)          Site condition
          m a.s.l.                 m                     (number)               (number)                   (number)                   or condition

          1300                   –                       –                   –                           –                         *Pebble                       Stream bed
          1700                4–14                       3                   5                           1                            169                        Forest slope
          2100                7–16                       5                   7                           0                            224                        Forest slope
          2500                 4–9                      11                   0                           0                            248                        Forest slope

          *None of the trees were taller than 0.5 m around these study plots.

          Table 2. Average monthly temperatures for study sites in snowy season

          Elevation                                                                    Average monthly temperatures (°C)

          m a.s.l.               November                December                January             February              March             April        May             June

          1300                    2.9                    −2.4                     −5.2                −4.4                 −0.2               6.4         11.6            15.3
          1700                    0.5                    −4.8                     −7.6                −6.8                 −2.6               4.0          9.2            12.9
          2100                   −1.9                    −7.2                    −10.0                −9.2                 −5.0               1.6          6.8            10.5
          2500                   −4.3                    −9.6                    −12.4               −11.6                 −7.4              −0.8          4.4             8.1

          RESULTS                                                                                  available for almost all the study plots. Snow depth generally
          The number of full snow pits for every month and elevation,                              increases with elevation, although a relatively lower value
          for the entire decade of observations, are shown in Figure 3.                            than expected was recorded at the plot at 2700 m a.s.l.
          Data were obtained for an additional 14 full snow pits as well                           However, as this elevation is above the timberline, wind
          as for the fixed plots along the route. A total of 157 snow-                             erosion of the snow surface could have decreased snow
          depth data points were obtained. We observed 514 pits                                    depth. The highest rate of increase in snow depth at all eleva-
          with an average depth of 1.12 m. There were 4849 snow                                    tions occurred in April. Slope and correlation coefficients,
          layers in total, including 2610 layers (73%) for which                                   excluding the 2700 m a.s.l. plot, are shown in Table 3.
          density measurements were taken.                                                         Maximum snow depth was recorded in March at the higher
             Grain shapes were classified into precipitation particles,                            plots, and in February at the lower plots.
          graupel, decomposing and fragmented precipitation particles,
          rounded grains, faceted crystals, depth hoar, melt forms and                             Correlation between snow density and elevation
          ice formations. Layer data for surface hoar were scant due to
                                                                                                   Correlations between snow density and elevation for each
          poor conditions for kinetic growth (the surface hoar thickness
                                                                                                   grain shape in each month are shown in Table 4. When
          was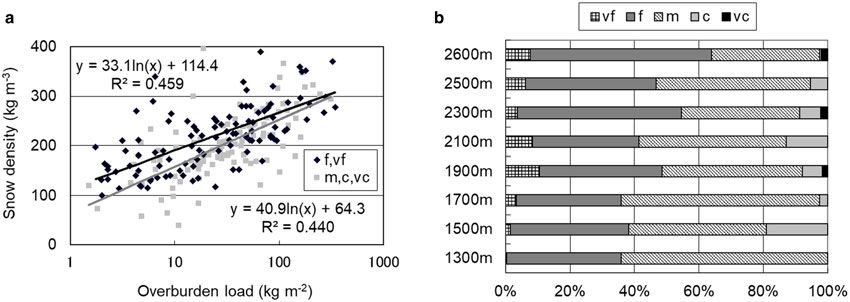
80                                                          Harada and others: Elevation-dependent behavior of hoar-prominent snowpack on forest slopes

                                                                                                       This ratio was lowest in all plots from December to February.
                                                                                                       In March, the ratio was much higher in plots at lower eleva-
                                                                                                       tions. This could be because the snow-melting season starts
                                                                                                       earlier at lower elevations while the snowfall season con-
                                                                                                       tinues at higher elevations due to lower temperatures.
                                                                                                           The relationship between overburden load and density,
                                                                                                       for different grain size classes of decomposing and fragmen-
                                                                                                       ted precipitation particles in December to February, is shown
                                                                                                       in Figure 7a. The frequency of grain size class at each eleva-
                                                                                                       tion is shown in Figure 7b. Snow densities of smaller size
                                                                                                       classes vf (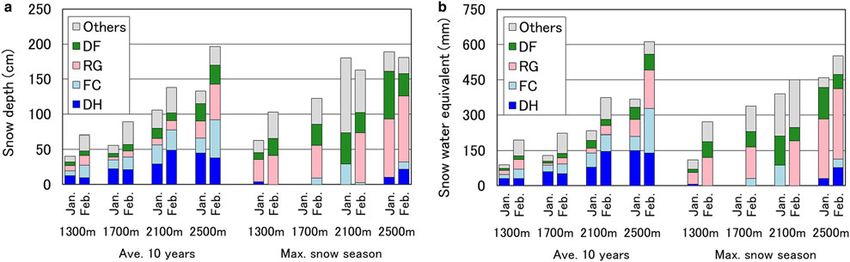
Harada and others: Elevation-dependent behavior of hoar-prominent snowpack on forest slopes                                                           81

          Fig. 5. Distribution ratio of grain shapes in (a) January and (b) March (winter values averaged across 10 years).

                                                                                                   mean density of snow cover showed a moderate linear cor-
                                                                                                   relation with elevation in January and February. The snow
                                                                                                   water equivalent can increase as a quadratic function of ele-
                                                                                                   vation (Eqn (1)).

                                                                                                        Hw ¼ HsD ¼ ðah þ bÞ ðch þ dÞ ¼ ph2 þ qh þ r;           ð1Þ

                                                                                                   where Hs is the snow depth, D is the snowpack density, h is
                                                                                                   the elevation, and a, b, c, d, p, q and r are the coefficients.
                                                                                                      For January and February, the quadratic expressions and
                                                                                                   their coefficients of determination are shown in Figure 9
                                                                                                   and Table 6. The monthly coefficients for h2 rose over time
                                                                                                   during the snow season. The difference between snow
                                                                                                   water equivalent and elevation was greater in the snow-
          Fig. 6. Relationship between snow layer thickness at 0°C as a                            melting season than it was at the start of the winter season.
          proportion of the whole layer and elevation.                                             However, in December, at the start of winter, lower correl-
                                                                                                   ation coefficients indicated a weak relationship between
          relationship between snow density and elevation for both                                 snow density and elevation (see Table 5). In March and
          precipitation particles and decomposing and fragmented pre-                              April, the snow-melting season starts earlier at lower eleva-
          cipitation particles (see Table 4). In March, melt forms and                             tions than at higher elevations, and it is difficult to estimate
          wet snow were found because the snow-melting season                                      snow water equivalent using this method due to the influence
          had already started at lower elevations (see Fig. 5). In April,                          of various processes related to the liquid water content within
          snow was melting at all locations, resulting in a strong correl-                         a snowpack.
          ation between snowpack density and elevation.
                                                                                                   DISCUSSION
          Relationship between snow water equivalent and                                           Relationship between grain size and snow density
          elevation                                                                                based on differences in grain shape and elevation
          According to our analysis of monthly trends, snow depth                                  Temporal changes in metamorphic processes on forested
          showed a strong linear correlation with elevation, and                                   slopes at the study sites were analyzed using the relationship

          Fig. 7. Grain size of decomposing and fragmented precipitation particles from December to February: (a) relationship with overburden load;
          (b) frequency of grain size classes.

Downloaded from https://www.cambridge.org/core. 29 Oct 2021 at 03:00:06, subject to the Cambridge Core terms of use.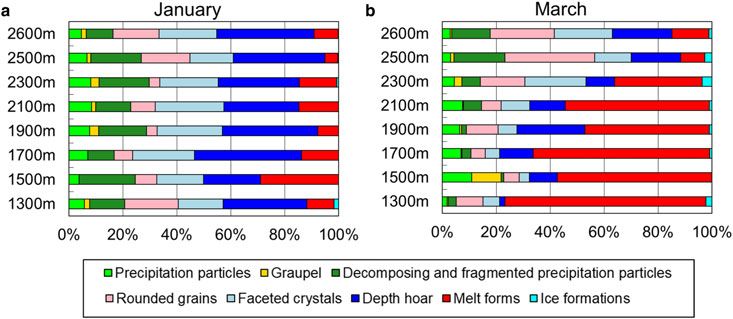
82                                                          Harada and others: Elevation-dependent behavior of hoar-prominent snowpack on forest slopes

              Fig. 8. Relationship between average snowpack density and                                Fig. 9. Relationship between snow water equivalent (averaged over
              elevation (values averaged across 10 years).                                             10 years) and elevation. The regression curves describe data
                                                                                                       obtained in January and February.

              Table 5. Regression analysis of the relationship between snowpack
              density and elevation from 1300 to 2600 m a.s.l.                                         Table 6. Quadratic functions of snow water equivalent and eleva-
                                                                                                       tion relationships

                                         December       January    February      March     April
                                                                                                                                            Hw                      R2
              Slope coefficient          3.1            4.5        3.7           2.6       3.1                                              mm
               (×10−5)
              Correlation                0.39           0.49       0.56          0.39      0.56        December           1.0   × 10−4   h2–2.4 × 10⁻¹ h + 153     0.92
               coefficient                                                                             January            2.2   × 10−4   h2–5.7 × 10⁻¹ h + 468     0.91
                                                                                                       February           3.9   × 10−4   h2–1.05 h + 872           0.96
                                                                                                       March              5.5   × 10−4   h2–1.46 h + 1143          0.90
                                                                                                       April              7.4   × 10−4   h2–2.06 h + 1562          0.93
              between grain size and snow density and according to differ-
              ences in grain shape and elevation.
                 We therefore extracted monthly data with full snow-pit                                metamorphism at the study sites; the snow-melting season
              observations over more than five winters, taken at 2500,                                 starts from February at lower elevations and snow depth
              2100, 1700 and 1300 m a.s.l. Using these data, relationships                             increases until March at higher elevations (see Fig. 4).
              between grain size and snow density for rounded grains,                                     Since the end of the snow-melting season is later at higher
              depth hoar and melt forms were derived and are shown in                                  elevations, many recordings of grain sizes above 3 mm were
              Figure 10. The same relationships for decomposing and frag-                              possible at 2500 m a.s.l. from April to May. In addition, snow
              mented precipitation particles and faceted crystals at 2500                              density from 50 cm snow depth to the snow surface was
              and 2100 m a.s.l. are also shown in Figure 10. In addition,                              greater than that of the bottom layer. Liquid water content
              snow densities in layers from the ground up to 50 cm snow                                near the snow surface and in the bottom layer rises due to
              depth and from 50 cm snow depth to the snow surface are                                  radiation and rainfall, and the snowpack aquifer, respect-
              shown in Table 7 for months and altitudes with average                                   ively. Snow particles were metamorphosed into coarse-
              snow depth above 1 m. The bottom layer is considered to                                  grained melt forms irreversibly under these conditions.
              be from the ground up to 50 cm snow depth (Wakabayashi                                      Relationships between elevation and average snow
              and others, 2007). We then considered monthly changes                                    density for grains of dry snow in midwinter are shown in
              based on differences in elevation, and identified equitem-                               Figure 11. The average snow density of depth hoar was
              perature, temperature gradient and melt–freeze metamorph-                                roughly greater at higher elevations and from January to
              ism (Sturm, 2015).                                                                       February due to densification and kinetic growth forms.
                 In midwinter, fine snow particles are well-packed due to                              This indicates that depth hoar is formed at lower layers of
              collision and fragmentation since the influence of drifting                              the snowpack. On the other hand, the snow density of
              snow is greater at higher elevations (see Fig. 7). Snow depth                            rounded grains was ∼200–300 kg m−3 at all elevations due
              increased with elevation on the forested slopes (see Fig. 4).                            to sintering. Densification had little influence because
              At 2500 m a.s.l., a large number of instances of rounded                                 rounded grains are located in the upper layer of the snow-
              grains with equitemperature metamorphism were recorded.                                  pack on forested slopes. Snowfall frequency and snow
              From 2100 to 1700 m a.s.l., the fragmentation of snow parti-                             blowing increased with increasing elevation. On the other
              cles occurred less frequently due to the lower wind velocity                             hand, the result at 1300 m a.s.l. indicated the condition of
              and snow depth compared with those at 2500 m a.s.l. At                                   the stream bed, namely, higher radiative cooling, as well as
              several plots between 2100 and 1700 m a.s.l., grain sizes                                wind and solar radiation. Therefore, temporal transitions of
              and depth hoar are larger than at other plots because of                                 grain shapes with differences in elevation were seen, such
              dominant temperature gradient metamorphism. On the other                                 as those shown in Figure 12.
              hand, rounded grains were distributed at 1300 m a.s.l. due
              to higher air temperature, despite having approximately the
              same snow depth as that at 1700 m a.s.l. Snow particles were                             Relationship between snow depth and snow water
              shown to metamorphose into coarse-grained depth hoar                                     equivalent on differences in grain shape and elevation
              under long terms of temperature gradient (Akitaya, 1974).                                in January and February
              However, a few data points were recorded for grain sizes                                 Relationships between proportions of snow depth, snow
              above 3 mm because of inhibition of the temperature gradient                             water equivalent and elevation for grain shapes of dry

Downloaded from https://www.cambridge.org/core. 29 Oct 2021 at 03:00:06, subject to the Cambridge Core terms of use.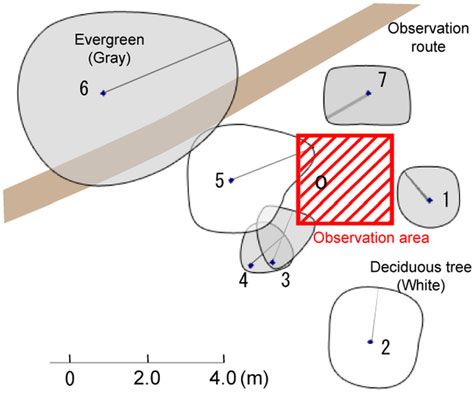
Harada and others: Elevation-dependent behavior of hoar-prominent snowpack on forest slopes                                                     83

          Fig. 10. Relationship between grain sizes and snow density based on differences in elevation and grain shape.

          snow in January and February are shown in Figure 13. The                                 water equivalent in March at 1900 m a.s.l. Average 10-year
          maximum snow season, that is, the winter of 2000–01, was                                 snow depth showed a linear correlation and snow water
          defined as the season with the maximum value of snow                                     equivalent showed a quadratic correlation with elevation.

Downloaded from https://www.cambridge.org/core. 29 Oct 2021 at 03:00:06, subject to the Cambridge Core terms of use.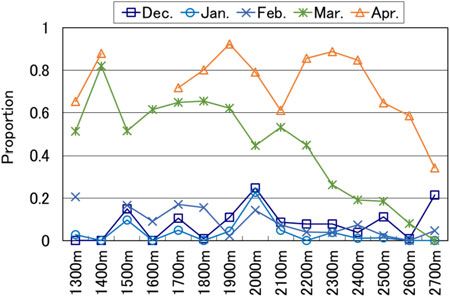
84                                                          Harada and others: Elevation-dependent behavior of hoar-prominent snowpack on forest slopes

              Table 7. Snow densities for months with average snow depth exceeding 1 m

                                                              2500 m a.s.l.                                                            2100 m a.s.l.

              Month              Snow depth                             Snow density                            Snow depth                      Snow density

                                       cm            Ground to 50 cm            50 cm to snow surface                  cm       Ground to 50 cm        50 cm to snow surface
                                                         kg m−3                        kg m−3                                       kg m−3                    kg m−3

              December             –                   –                          –                               –               –                      –
              January            131                 337                        246                               –               –                      –
              February           200                 359                        295                             141             320                    257
              March              218                 405                        346                             154             377                    317
              April              209                 410                        423                             106             430                    341
              May                125                 468                        491                               –               –                      –

              *Snow depths >1.0 m were infrequent at the 1300 and 1700 m a.s.l. study plots.

                                                                                                       Fig. 12. Temporal transitions of grain shapes at different elevations.
              Fig. 11. Relationship between elevation and average snowpack                             Metamorphic processes: green, equitemperature; blue, temperature
              density. ‘Ave.’ indicates snowpack mean density.                                         gradient; red, melt–freeze.

              The proportion of snow depth that was snow hoar was                                      with densification due to the overburden load in the vertical
              greater at high elevations, as was the snow density (see                                 direction can be characterized as giving rise to depth hoar
              Fig. 11). At the same plots in January and February, little dif-                         that is smaller than rounded grains on forested slopes
              ference was observable in snow depth, except for the plot at                             within a single basin.
              2300 m. Snow grains of depth hoar are developed and tightly                                 Table 8 shows the numerical difference in the distribution
              bonded in the vertical direction (Yamada and others, 1974).                              ratio between snow water equivalent and snow depth for
              The snow texture of depth hoar shows vertical anisotropic                                faceted and rounded snow (i.e. decomposing and fragmen-
              growth kinetics (Kojima, 1956). Comparing the same                                       ted precipitation particles, and rounded grains). The value
              density of rounded grains and depth hoar, compactive vis-                                of faceted snow was greater at higher elevations, and the
              cosity of the latter is ∼10 times that of the former (Kojima,                            value of rounded snow was roughly equal at all plots. It is
              1959). Therefore, the influence of reduction in snow depth                               possible that the layer of rounded snow acts by both

              Fig. 13. Relationships between proportions of (a) snow depth and (b) snow water equivalent and elevation for grain shapes of dry snow in
              January and February: left, average of 10 years; right; maximum snow season. There were no data for January at 1700 m a.s.l. in the
              maximum snow season.

Downloaded from https://www.cambridge.org/core. 29 Oct 2021 at 03:00:06, subject to the Cambridge Core terms of use.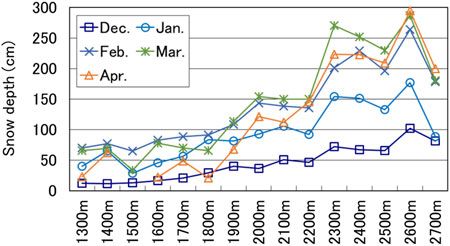
Harada and others: Elevation-dependent behavior of hoar-prominent snowpack on forest slopes                                                             85

          Table 8. Numerical difference in the distribution ratio (%) between snow water equivalent and snow depth (SWE − Hs)

          Month                                                DH + FC                                                                 RG + DF

                                                              Elevation                                                                Elevation
                                                               m a.s.l.                                                                 m a.s.l.

                                   1300                1700                2100                2500                1300         1700               2100         2500
                                    %                   %                   %                   %                   %            %                  %            %

          January                   5                   5                  7                   7                   −4           −3                  1           −3
          February                 −3                  −2                  2                   7                    0           −1                 −1           −2

          increasing snow density and reducing snow depth via equi-                                We thank the AFC authorities. Many students of Shinshu
          temperature metamorphism. In the maximum snow season,                                    University contributed to data collection. We are especially
          which was characterized mainly by rounded snow, snow                                     grateful to Jun Yoshii, Motoyasu Sugiyama, Tohru Maehara
          depth and snow water equivalent showed a linear correlation                              and Naoto Toda for their skilled technical assistance. The
          with elevation (Fig. 13). For this reason, temperature gradient                          Hoku-shin-etsu branch of the Japanese Society of Snow
          was suppressed due to high snowfall frequency.                                           and Ice awarded a prize to the observation team (leader:
             The above discussion points to the differences in various                             Wakabayashi) in 2007 in recognition of the importance of
          metamorphism processes at varied elevations; snow depth                                  long-term observations of snow-pit data. We thank the
          showed a linear correlation and snow water equivalent                                    society for its support and encouragement.
          showed a quadratic correlation with elevation on average
          for 10 years from January to February under a facet-promin-
          ent snowpack upon forested slopes within a single basin.                                 SUPPLEMENTARY MATERIAL
                                                                                                   The supplementary material for this article can be found at
                                                                                                   https://doi.org/10.1017/aog.2018.33
          CONCLUSION
          We examined the relationship between elevation and snow-
          pack on forested slopes, focusing on density and grain shape,                            REFERENCES
          based on a decade of full snow-pit observations in the                                   Akitaya E (1974) Studies on Depth Hoar. Contributions from the
          Japanese Central Alps. The observations were recorded on                                     Institute of Low Temperature Science, A26, 1–67
          a monthly basis at 15 study plots spaced at 100 m elevation                              Armstrong RL and Armstrong BR (1987) Snow and avalanche cli-
          intervals, from 1300 to 2700 m a.s.l. Our study suggests that                                mates of the western United States: a comparison of maritime,
                                                                                                       intermountain and continental conditions. IAHS Publ. 162
          snow depth has a strong linear correlation with elevation,
                                                                                                       (Symposium at Davos 1986 – Avalanche Formation, Movement
          and that mean density of snow cover has a moderate linear                                    and Effects), 281–294
          correlation with elevation in midwinter. Snow water equiva-                              Canadian Avalanche Association (1995) Observation guidelines and
          lent can increase as a quadratic function of elevation. For this                             recording standards for weather, snowpack and avalanches.
          reason, the influence of overburden load and wind packing is                                 Canadian Avalanche Association, Revelstoke, BC, Canada, 98
          elevation-dependent from January to February, a period                                       pp
          when a facet-prominent snowpack existed on account of                                    Deems JS, Painter TH and Finnegan DC (2013) Lidar measurement
          low snow and air temperatures. Snow density of depth hoar                                    of snow depth: a review. J. Glaciol., 59(215), 467–479 (doi:
          is greater at higher elevations than it is for rounded grains                                10.3189/2013JoG12J154)
          in midwinter, due to densification. In addition, various meta-                           Dressler KA, Leavesley GH, Bales RC and Fassnacht SR (2006)
                                                                                                       Evaluation of gridded snow water equivalent and satellite snow
          morphism processes were observed during the snow season
                                                                                                       cover products for mountain basins in a hydrologic model.
          in the forested slopes, with differences based on elevation.
                                                                                                       Hydrol. Process., 20, 673–688 (doi: 10.1002/hyp.6130)
          These results contribute to estimating the snow water equiva-                            Haegeli P and McClung DM (2003) Avalanche characteristics of a
          lent and understanding the metamorphism process asso-                                        transitional snow climate – Columbia Mountains, British
          ciated with elevation of the facet-prominent snowpack                                        Columbia, Canada. Cold Reg. Sci. Technol., 37(3), 255–276
          upon forested slopes from the viewpoint of snow hydrology                                    (doi: 10.1016/S0165-232X(03)00069-7)
          and mountainous snow research. However, the observation                                  Helms D, Phillips SE and Reich PF (2008) The History of Snow
          data still leave room for analysis. In the future, we plan to                                Survey and Water Supply Forecasting: Interviews with US
          investigate the characteristic differences between upper                                     Department of Agriculture Pioneers, Natural Resources
          and bottom snowpack layers throughout a snow season in                                       Conservation Service, US Department of Agriculture, 306pp
          this area. Furthermore, we would like to examine the rela-                               Ikeda S, Wakabayashi R, Izumi K and Kawashima K (2009) Study of
                                                                                                       snow climate in the Japanese Alps: comparison to snow climate
          tionship between the hoar-prominent snowpack and the sur-
                                                                                                       in North America. Cold Reg. Sci. Technol., 59, 119–125 (doi:
          vival of animals during severe winter conditions by                                          10.1016/j.coldregions.2009.09.004)
          collaborating with ecologists.                                                           Ishizaka M (2008) Reassessment of climatic conditions in ‘depth-
                                                                                                       hoar region’ and new map for climatic division of snow-
                                                                                                       covered areas in Japan based on the new conditions. J. Jpn.
          ACKNOWLEDGEMENTS                                                                             Soc. Snow Ice, 70(1), 3–13 [In Japanese with English abstract]
          Observations were mainly performed at the Nishikoma                                      Kojima K (1956) Viscous compression of natural snow-layer, II. Low
          station of the Alps Field Center (AFC) of Shinshu University.                                Temp. Sci., A15, 117–136 [In Japanese with English resume]

Downloaded from https://www.cambridge.org/core. 29 Oct 2021 at 03:00:06, subject to the Cambridge Core terms of use.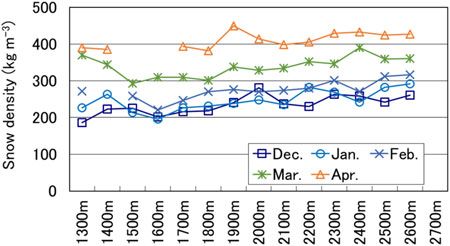
86                                                          Harada and others: Elevation-dependent behavior of hoar-prominent snowpack on forest slopes

              Kojima K (1959) The influence of temperature gradient upon the                              contrasting sites in Switzerland using SNOWPACK simula-
                 grain texture, setting rate and brittleness of snow. Low Temp.                           tions driven by different meteorological data input. Cold Reg.
                 Sci., A18, 29–45 [In Japanese with English resume]                                       Sci. Technol., 99, 27–37 (doi: 10.1016/j.coldregions.2013.12.
              Laternser M and Schneebeli M (2003) Long-term snow climate                                  004)
                 trends of the Swiss Alps (1931–99). J. Climatol., 23, 733–750                         Sturm M (2015) Cryosphere: Snow (Surface). Encyclopedia of
                 (doi: 10.1002/joc.912)                                                                   Atmospheric Sciences (Second Edition), 2, 227–236 (doi:
              Matsuyama M (1998) A review on the snow surveys conducted in                                10.1016/B978-0-12-382225-3.00367-4)
                 mountainous regions in Japan to determine distribution factors.                       Takeuchi M (1996) Mechanism of blowing-snow (1). J. Jpn Soc.
                 J. Jpn. Soc. Hydrol. Water Resour., 11(2), 164–174 (doi:                                 Snow Ice, 58(2), 161–168 (doi: 10.5331/seppyo.58.161) [in
                 10.3178/jjshwr.11.164) [In Japanese with English abstract]                               Japanese]
              Mock CJ and Birkeland KW (2000) Snow avalanche climatology of                            Wakabayashi R, Ito Y and Harada Y and 9 others (2007) The
                 the western United States mountain ranges. Bull. Am. Meteorol.                           elevation-dependent behavior of mountain snowpack. Bull.
                 Soc. 81, 2367–2392. (doi: 10.1175/1520-0477(2000)                                        Shinshu Univ. AFC, 5, 107–131 [In Japanese with English
                 0812.3.CO;2)                                                                abstract]
              Mote PW, Hamlet AF, Clark MP and Lettenmaier DP (2005)                                   Yamada T (1983) Studies on accumulation-ablation processes and
                 Declining mountain snowpack in western North America. Am.                                distribution of snow in mountain regions, Hokkaido.
                 Meteorol. Soc., 82, 399–415 (doi: 10.1175/BAMS-86-1-39)                                  Contributions from the Institute of Low Temperature Science,
              Pielmeier C and Schneebeli M (2003) Developments in the stratig-                            A31, 1–33
                 raphy of snow. Surv. Geophys., 24, 389–416 (doi: 10.1023/B:                           Yamada T, Hasemi T, Izumi K and Sato A (1974) On the dependen-
                 GEOP.0000006073.25155.b0)                                                                cies of the velocities of P and S waves and thermal conductivity
              Schmucki E, Marty C, Fierz C and Lehning M (2014) Evaluation of                             of snow upon the texture of snow. Low Temp. Sci., A32, 71–80
                 modelled snow depth and snow water equivalent at three                                   [In Japanese with English summary]

Downloaded from https://www.cambridge.org/core. 29 Oct 2021 at 03:00:06, subject to the Cambridge Core terms of use.
You can also read