EFFECTS OF OPERATIONAL TAXONOMIC UNIT INFERENCE METHODS ON SOIL MICROEUKARYOTE COMMUNITY ANALYSIS USING LONG- READ METABARCODING - DIVA
←
→
Page content transcription
If your browser does not render page correctly, please read the page content below
Received: 15 January 2022 | Revised: 27 January 2022 | Accepted: 30 January 2022
DOI: 10.1002/ece3.8676
RESEARCH ARTICLE
Effects of operational taxonomic unit inference methods
on soil microeukaryote community analysis using long-read
metabarcoding
Shadi Eshghi Sahraei1 | Brendan Furneaux1 | Kerri Kluting1 | Mustafa Zakieh1,2 |
Håkan Rydin1 | Håkan Hytteborn1 | Anna Rosling1
1
Department of Ecology and Genetics,
Uppsala University, Uppsala, Sweden Abstract
2
Department of Plant Breeding, Swedish Long amplicon metabarcoding has opened the door for phylogenetic analysis of the
University of Agricultural Sciences,
Alnarp, Sweden
largely unknown communities of microeukaryotes in soil. Here, we amplified and se-
quenced the ITS and LSU regions of the rDNA operon (around 1500 bp) from grass-
Correspondence
Anna Rosling, Department of Ecology and
land soils using PacBio SMRT sequencing. We tested how three different methods for
Genetics, Uppsala University, Kåbovägen generation of operational taxonomic units (OTUs) effected estimated richness and
4, 752 36 Uppsala, Sweden.
Email: anna.rosling@ebc.uu.se
identified taxa, and how well large-scale ecological patterns associated with shifting
environmental conditions were recovered in data from the three methods. The field
Funding information
Knut och Alice Wallenbergs Stiftelse;
site at Kungsängen Nature Reserve has drawn frequent visitors since Linnaeus's time,
ERC, Grant/Award Number: 678792; and its species rich vegetation includes the largest population of Fritillaria meleagris
Vetenskapsrådet, Grant/Award Number:
2018-05973
in Sweden. To test the effect of different OTU generation methods, we sampled soils
across an abrupt moisture transition that divides the meadow community into a Carex
acuta dominated plant community with low species richness in the wetter part, which
is visually distinct from the mesic-dry part that has a species rich grass-dominated
plant community including a high frequency of F. meleagris. We used the moisture
and plant community transition as a framework to investigate how detected below-
ground microeukaryotic community composition was influenced by OTU generation
methods. Soil communities in both moisture regimes were dominated by protists, a
large fraction of which were taxonomically assigned to Ciliophora (Alveolata) while
30%–40% of all reads were assigned to kingdom Fungi. Ecological patterns were con-
sistently recovered irrespective of OTU generation method used. However, different
methods strongly affect richness estimates and the taxonomic and phylogenetic reso-
lution of the characterized community with implications for how well members of the
microeukaryotic communities can be recognized in the data.
KEYWORDS
clustering, ITS, rDNA, species hypothesis
TA X O N O M Y C L A S S I F I C AT I O N
Biodiversity ecology
This is an open access article under the terms of the Creative Commons Attribution License, which permits use, distribution and reproduction in any medium,
provided the original work is properly cited.
© 2022 The Authors. Ecology and Evolution published by John Wiley & Sons Ltd.
Ecology and Evolution. 2022;12:e8676. www.ecolevol.org | 1 of 14
https://doi.org/10.1002/ece3.8676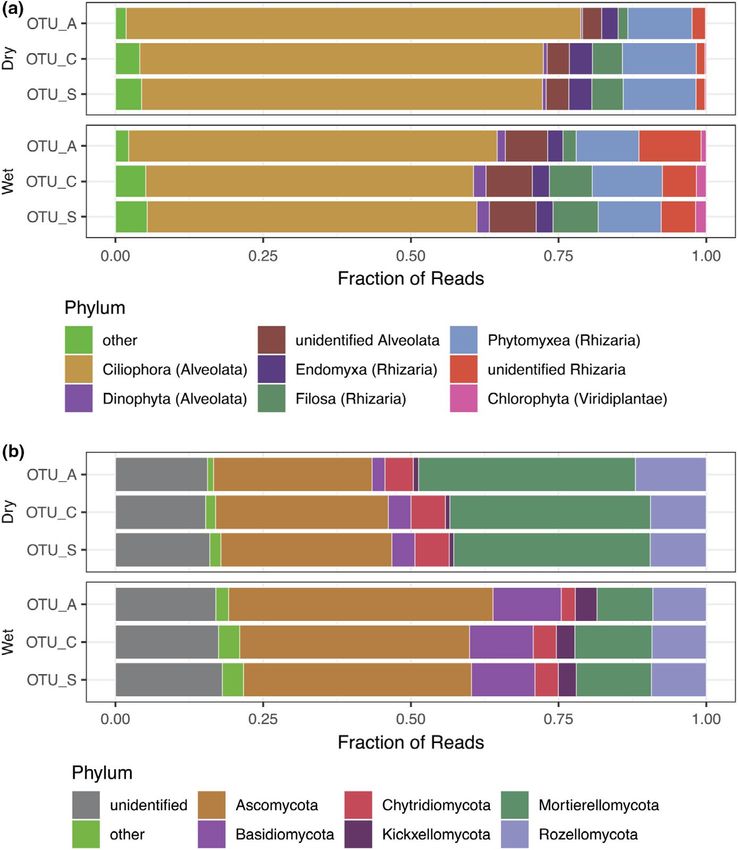
2 of 14 | ESHGHI SAHRAEI et al.
1 | I NTRO D U C TI O N separate into different OTUs, that is, splitting of species, while a less
stringent threshold may artificially lump multiple species together
Microbial community composition in soil can be assessed in me- into a single OTU (Ryberg, 2015). In single-linkage clustering on the
tabarcoding studies of environmental DNA (eDNA) extracts by other hand, a read is joined to a cluster if it is within the set similarity
amplification and sequencing of barcoding regions, often targeting threshold to any other read in the cluster, that is. not just compared
the ribosomal operon. Richness estimates based on eDNA metabar- with a centroid sequence. This approach has been used with simi-
coding studies indicate that global fungal species richness is at least larity thresholds much smaller than the expected sequencing error
ten times higher than the number of formally described species (e.g., 1 bp) to delimit more “natural” OTUs, as applied in swarm clus-
(Spatafora et al., 2017), including several class level lineages of cur- tering (Mahé et al., 2014). Very small similarity thresholds are only
rently undescribed fungi (Tedersoo et al., 2017). Non-fungal micro- appropriate in a densely populated error space, and the presence
eukaryotes, collectively referred to as protists throughout the text, of intermediate sequences can cause single-linkage clustering to
are far less studied in soil compared with fungi but are increasingly group fairly distant sequences into an OTU (Mahé et al., 2014, 2017).
recognized for their diverse ecosystem functions (Geisen, 2016). Clustering based on similarity thresholds, whether centroid-based
Recent molecular studies using eDNA have dramatically increased or single-linkage, does not differentiate sequencing errors from bi-
our knowledge of protist diversity in different environments, even ological variation. Denoising algorithms, such as DADA2, have been
indicating that diversity may be higher in soil than in water (Burki developed to identify ASVs present in a sample, by removing se-
et al., 2021; Geisen et al., 2018; Mahé et al., 2017). quencing errors using a model which incorporates the base quality
Challenges in characterizing soil microeukaryotic communi- scores and read abundances (Callahan et al., 2016). This approach
ties from metabarcoding data include biases associated with primer captures both within and between species variation, even as little
choice, tradeoffs between number of samples and sequencing depth, as one base pair difference, and so ASVs may be further clustered to
method for estimating species richness as well as accuracy of taxo- serve as proxies for species (Frøslev et al., 2017). However, DADA2
nomic identification of community members. Some of these aspects does rely on the presence of at least two identical sequences as
are discussed below and further explored in this paper. The two inter- seeds for generating ASVs, so the method can perform poorly when
nal transcribed spacer (ITS1 and ITS2) are noncoding, hypervariable the majority of reads are singletons (Furneaux et al., 2021).
regions of the rDNA operon, widely accepted as marker regions for Assigning taxonomy to OTUs may allow for functional analysis of
characterization of fungal communities (Schoch et al., 2012). However, community composition, but is highly dependent on curated refer-
due to intraspecific variation and sequencing errors, community com- ence datasets such as the PR2 for protists (Del Campo et al., 2018;
position of known and novel species cannot be directly identified from Guillou et al., 2012) and UNITE for fungi (Kõljalg et al., 2013). In the
the massive numbers of unique reads generated by high-throughput well-established fungal sequence database UNITE, OTUs are derived
eDNA sequencing (Ryberg, 2015). Instead, sequence reads are clus- using a range of thresholds from 97% to 99.5% similarity across the
tered into operational taxonomic units (OTUs) and/or denoised into ITS2 region and referred to as species hypotheses (SH) with unique
amplicon sequence variants (ASVs) that may serve as proxies for spe- numbers and known species names when available (Kõljalg et al.,
cies. In a comparison of OTU clustering and denoising into ASVs of 2013). The development of PacBio sequencing technology (Pacific
short-read amplicon, Glassman and Martiny (2018) demonstrated that Biosciences, Menlo Park, CA, SA) has allowed longer eDNA ampli-
the two methods capture different representations of the soil micro- cons, including both variable spacers and more conserved functional
eukaryotic community but that large-scale ecological patterns were rDNA regions, to be sequenced from complex samples. In the ab-
consistently represented in both datasets. Similarly, spatio-temporal sence of matching reference sequences, taxonomic assignment of
turnover patterns were consistently captured across datasets using novel lineages is possible based on phylogenetic inference using the
both different sequencing technologies and different amplicon more conserved rDNA small subunit (SSU; Jamy et al., 2020) and/or
lengths (Furneaux et al., 2021). While strong community patters are large subunit (LSU) sequences (Furneaux et al., 2021; Tedersoo et al.,
highly reproducible, effects of bioinformatic tools on the generated 2017). The benefit of phylogenetically supported taxonomic assign-
species proxies and the sequences selected to represent them remains ment of OTUs is particularly relevant in communities consisting
important for researchers that which to take metabarcoding commu- mostly of poorly characterized lineages (Kalsoom Khan et al., 2020).
nity analysis beyond large-scale ecological patterns. For this study, we revisited two permanent transects at the
The most common approach for OTU generation has been Kungsängen Nature Reserve (Sernander, 1948; Zhang, 1983).
abundance-based greedy clustering of reads using fixed similar- Kungsängen is a seminatural grassland located in Uppsala, Sweden,
ity thresholds relative to a centroid sequence, as implemented home to a large population of the plant Fritillaria meleagris (Liliaceae)
in USEARCH (Edgar, 2013) and VSEARCH (Rognes et al., 2016). in Sweden, where it was naturalized in the 18th century after being
Clustering thresholds are often chosen based on estimates of the used as a popular garden flower since the 17th century (Linnaeus, 1921
level of variation present within species (Tedersoo et al., 2014). [1753]; Zhang, 1983). At the site we collected plant community data
However, no universal threshold accurately separates all species across the abrupt change in meadow plant community from the wetter
(Nilsson et al., 2008; Vu et al., 2019), and a more stringent thresh- part towards the river, visually distinct from the mesic-dry part fur-
old may cause two sequences which belong to the same species to ther inland. Soil samples were collected on both sides of this transition
ESHGHI SAHRAEI et al. | 3 of 14 zone, with and without F. meleagris, for the first belowground commu- the western part is managed less frequently because of high soil mois- nity observations from this study site. More importantly, we tested ture due to its low elevation and proximity to the Fyris River (Zhang, if belowground community compositional shift across the transition 1983; Zhang & Hytteborn, 1985). To investigate vegetation in the field, from wet to mesic-dry parts of the meadow was consistently captured 28 permanent plots (2 × 2 m) were laid out across an east–west tran- with different OTU generation methods. Further, the effect of OTU sect in the meadow in the 1940s (Sernander, 1948). Along this transect generation method on the characterized community of soil microeu- 1, plots are located from 1.07 and 2.57 m above sea level. In the 1980s, karyotes was explored for richness estimates, taxonomic and phylo- three additional parallel transects (2–4) were laid out (Zhang, 1983). genetic resolution and detection limits of rare taxa. While long-read In 2016–2017, two of the four permanent transects (1: plots metabarcoding is becoming an increasingly popular methodology in 1–28 in June 2016 and 4: plots 61–76 in June 2017) were revis- eDNA community analysis (Burki et al., 2021; Furneaux et al., 2021; ited, and the plant community was inventoried using the 5-degree Jamy et al., 2020; Leho Tedersoo et al., 2017) available bioinformatic Hult-Sernander-Du Rietz logarithmic scale (5, 50%–100% cover; 4, tools for sequence clustering are primarily developed and tested for 25%–50%; 3, 12.5%–25%; 2, 6.25%–12.5%; 1,
4 of 14 | ESHGHI SAHRAEI et al.
environmental differences, that is, wet versus mesic dry soil condi- the primers capture a wide range of non-fungal microeukaryotes.
tions, and small-scale habitat differences, that is, presence or ab- Barcodes added to forward and reverse primers were combined in
sence of a F. meleagris plant. A visual vegetation shift marks the soil sample-specific barcode pairs for multiplexed sequencing (Table S3).
moisture transition from the wet area to the mesic-dry area further Each 40 µl PCR reaction contained 20.4 µl nuclease free water, 0.4 µl
inland. The soil type at the site ranges from light clay with fine sand Phusion High-Fidelity DNA Polymerase (Thermo Fisher Scientific,
to heavy clay, with a higher clay content in the wet compared with Hudson, NH, US), 8 µl 5× buffer, 0.01 µM of each primer, 200 µM
the mesic dry part of the meadow (Zhang, 1983). This transition bor- dNTP mix, 2 µl DMSO, and 4 µl DNA template. The thermal cycle
der falls close to plot 16 on transect 1 and plot 68 on transect 4 (red protocol used was a 10 min initial denaturation at 95°C, 25 cycles
line in Figure 1). Soil samples were collected on June 7th, 2016, from of denaturation (45 s, 95°C), annealing (45 s, 59°C) and elongation
five locations 30 m apart on each side of the soil moisture transition (90 s, 72°C), and a final elongation (72°C, 10 min). PCR products
border separated by 30 m across the transition border. Soil sampling were visualized by gel electrophoresis. The resulting amplicons (ap-
locations intersected transect 1 and 4 between plots 14 and 67 in proximately 1500 bp long) were purified with the ZR-96 DNA clean
the mesic-dry and plots 17 and 69 in wet area (Figure 1). At each up kit (Zymo Research). The amount of PCR products used for the
location, two soil samples were taken using a soil corer when pos- pooled library was estimated to approximate equimolar amounts
sible (5 cm diameter × 10 cm depth) or with a hand shovel when soils based on observed electrophoresis band intensity. The pooled li-
were too wet for using a soil corer (as was the case for most of the brary was sequenced together with root samples from the site at
samples on the wet side). When using a shovel, sampling depth and SciLifeLab/NGI (Uppsala, Sweden) with six SMRT cells on the PacBio
soil volume were estimated to correspond to that of the soil cores. RSII sequencing platform. Raw demultiplexed reads for the current
The first sample at each location was collected around a F. meleagris study are available in ENA (accession number: PRJEB47280).
plant and the second at 0.5 m distance from the sampled F. meleagris
plant. For the second sample (referred to as non-Fritillaria soil), we
also ensured that no other F. meleagris plant was within 0.5 m of 2.4 | Bioinformatic analysis
the sample. The corer/shovel was wiped with 70% ethanol-soaked
tissue paper between each sampling. In total, 20 soil samples were RSII subread files in BAX format were converted to the newer
collected: five Fritillaria/non-Fritillaria soil sample pairs from the wet BAM format using “bax2bam” from PacBio SMRT tools 5.0.1, and
side and five pairs from the mesic-dry side. The most common plant reads were demultiplexed using “lima” from PacBio SMRT tools
species were recorded at each sampling location for cross reference 7.0.1 using the options “--different” and “--peek-guess”. Sequences
to the more complete plant community data recorded for plots along which were not assigned to one of the barcode pairs used in this
the transects (Table S1). experiment were discarded. Circular consensus sequences (CCS)
All samples were individually placed in plastic bags and kept on were generated from the demultiplexed BAM files using “ccs” from
ice during sampling before storage at 4°C overnight. The following PacBio SMRT tools 5.0.1 (the last version which supports RSII data),
day, soils were homogenized in the plastic bags and subsamples of resulting in 49,709 reads. Sequences were oriented in the forward
soil were transferred to 15 ml conical centrifuge tubes and frozen at direction by matching the forward and reverse primer sequences
−20°C, followed by freeze drying. Another subsample was weighed using Cutadapt v.3.0 (Martin, 2011) retaining only reads with both
before drying at +80°C for 48 h to estimate gravimetric soil mois- a forward and a reverse primer sequence in the correct orienta-
ture (Holliday, 1990; Table S2). tion (ITS1 and reverse-complemented LR5). Further, concatamers
(Griffith et al., 2018) were identified by searching for the primer
sequence pairs ITS1/reverse-complemented ITS1, LR5/reverse-
2.3 | Library preparation and sequencing complemented LR5, ITS1/ITS1, and LR5/LR5 within the forward and
reverse strands of each of the reads, and if detected, the read was
Around 300 mg of freeze-dried soil was used for total DNA ex- discarded. Remaining reads were length and quality filtered, allow-
®
traction using a NucleoSpin Soil kit (Macherey-Nagel). DNA ing for read lengths of 50–2999 bp and a maximum of 12 expected
concentration and purity of extracts were measured using a errors per read (to account for the probability of errors accumulat-
NanoDrop 2000 (Thermo Fisher Science), and concentrations ing over a long fragment), the AmpliSeq pipeline or VSEARCH (ver-
ranged from 90 to 320 ng/µl. The entire ITS and partial LSU re- sion 2.15.1; Rognes et al., 2016) depending on the OTU generation
gions of the rDNA operon were amplified using the forward method used as described below.
primer ITS1 (5′–TCCGTAGGTGAACCTGC–3´) modified by remov-
ing the two GG nucleotides from the 3´end compared with the
original ITS1 primer (White et al., 1990), and reverse primer LR5 2.4.1 | OTU generation
(5′–TCCTGAGGGAAACTTCG–3’) (Vilgalys & Hester, 1990). These
primers were selected because they amplify most known fungi Soil eukaryote community composition was estimated by generat-
(Tedersoo et al., 2015) and had no known mismatches to most avail- ing OTUs from the filtered reads using three different algorithms.
able sequences in Glomeromycota (Krüger et al., 2012). In addition, In this study, we use the term OTU_C to refer to the output of such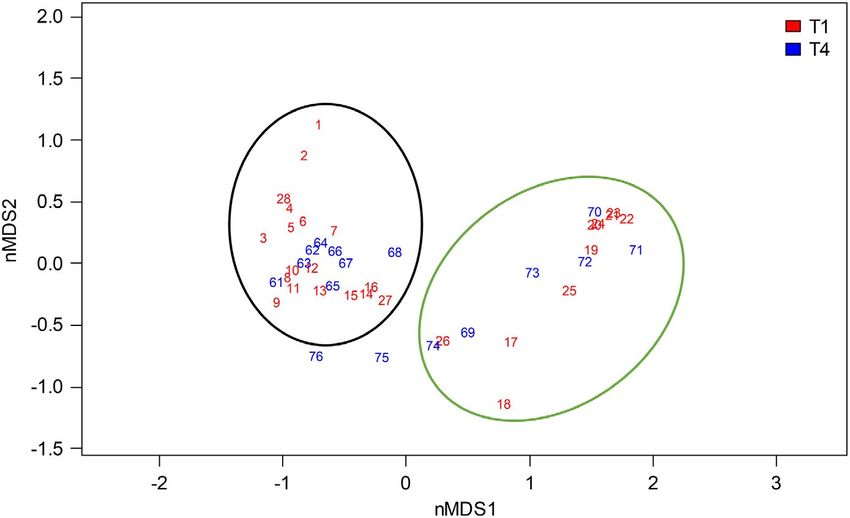
ESHGHI SAHRAEI et al. | 5 of 14
centroid based method, OTU_S for the output of such single-linkage Unique 5.8S and LSU sequences from the combined (OTU_A,
based clustering method and for consistency, instead of ASV we use OTU_C, OTU_S) dataset were independently aligned with DECIPHER
OTU_A to refer to the output of this denoising method. The selected (version 2.18.0; Wright, 2015). The LSU alignment was truncated at
algorithms have different principles for OTU generation and are a position corresponding to 879 in the S288C reference sequence
all commonly used in metabarcoding studies. The OTU_A dataset due to the presence of introns after this position. The 5.8S and LSU
consisted of ASVs inferred using DADA2 in the AmpliSeq pipeline alignments were then concatenated, and each sequence in the con-
(Straub et al., 2020). This method is designed to identify true se- catenated alignment was assigned a unique identifier based on its
quence variants in the amplicon library by collapsing variations de- component 5.8S and LSU sequences. A preliminary ML phylogenetic
rived from sequencing errors across all samples using the pooled tree was generated from the concatenated alignment using fasttree
function. The OTU_C dataset was generated by abundance-based (version 2.1.10; Price et al., 2010) with the GTR+C model with 20
greedy clustering in VSEARCH (Rognes et al., 2016) with a similarity rate categories. For sequences assigned at the kingdom level without
threshold of 99%. Finally, the OTU_S dataset was generated using conflicts between reference databases, the ML tree search was con-
single-linkage “swarm” clustering with a distance threshold of 30 bp strained by requiring that each kingdom form a monophyletic clade.
(approximately 2%) in GeFaST (Müller & Nebel, 2018). This thresh- Monophyly of the eukaryotic supergroups found in the samples was
old was selected to ensure that two copies of the same biological also constrained (Figure S1) according to the current consensus of
sequence, each containing a maximum of 15 different errors (i.e., 1% phylogenomic studies (Adl et al., 2019; Strassert et al., 2019). The
error in 1500 bp), would still be clustered together even if the error- position of sequences which were not identified to kingdom, or
free seed sequence was absent. For OTU_C (VSEARCH) and OTU_S which received conflicting kingdom assignments from the different
(GeFaST), the CCS reads corresponding to each OTU were extracted reference datasets, was not constrained. The tree was rooted with
using a custom BASH script (Data S1), and a consensus sequence sequences representing the protist phyla Discoba (Data S2).
for each OTU was calculated using PacBio's c3s (consensus of CCS; The clades corresponding to animals (kingdom Metazoa, 90
https://github.com/PacificBiosciences/c3s), which calculates a con- OTUs) and vascular plants (phylum Streptophyta, 42 OTUs) were
sensus sequence using SPOA (Vaser et al., 2017) with base quality identified from the tree, and OTUs corresponding to those se-
scores used as weights. This way the sequences representing all quences were removed from further analyses. In addition, the clade
three types of OTUs were inferred with a quality-aware method. corresponding to kingdom Fungi was extracted and analyzed sepa-
Chimeric sequences were removed from all datasets using the re- rately from protists. For kingdom Fungi only, a refined alignment and
moveBimeraDenovo function of DADA2. Global singletons (which phylogenetic tree were generated by realignment of the 5.8S and
are not generated by DADA2) were also removed from the OTU_C LSU regions using MAFFT-ginsi (Katoh & Standley, 2016), including
and OTU_S datasets before further analysis. truncation of the LSU alignment as above, followed by ML phylogeny
construction using IQ-TREE (Nguyen et al., 2015; Stamatakis, 2014)
using the built-in ModelFinder Plus (Kalyaanamoorthy et al., 2017),
2.5 | Placing OTU sequences in a phylogenetic and which selected the TIM3+F-R10 model, and 1000 ultrafast boot-
taxonomic context strap replicates (Hoang et al., 2018). The most abundant Holozoan
OTU (across OTU_A, OTU_C, and OTU_S) from the dataset (an
2.5.1 | Taxonomy assignment and maximum Ichthyosporian) was retained to root the fungal tree (Data S3).
likelihood (ML) tree based on the 5.8S and LSU region
The LSU, 5.8S, ITS2, and full ITS (ITS1–5.8S–ITS2) regions were ex- 2.5.2 | Comparing different types of OTUs
tracted using LSUx (version 0.99.6; https://github.com/brendanf/ clustering methods
LSUx; Furneaux et al., 2021) from the OTU consensus sequences
generated by all three OTU generation methods. Three datasets To analyze detection limits and taxonomic resolution of the three
were used for assigning taxonomy: the SILVA LSU NR 99 dataset methods used to infer OTUs, we plotted the Fungi-only tree along
(version 138.1, eukaryotes only; Quast et al., 2012), RDP fungal LSU with a heatmap of the average relative read abundance across all
training set (version 11; Liu et al., 2012) for the extracted LSU se- samples in separate columns for OTU_A, OTU_C and OTU_S (Data
quences, and the UNITE all-eukaryotes dataset (version 8.2, includ- S3). To explore the phylogenetic resolution of the three methods,
ing singletons; (Nilsson et al., 2019) for the extracted ITS sequences. the ITS2 regions extracted from each sequence by LSUx (as de-
The taxonomic annotations for all three reference datasets were scribed above) were clustered using the same methodology outlined
mapped to the UNITE classification system so that assignments from in Kõljalg et al. (2013) to generate UNITE SH at 97 and 99% sequence
different datasets could be compared (reUnite version 0.2.0; https:// similarity: sequences were first pre-clustered at 80% sequence simi-
github.com/brendanf/reUnite; Furneaux et al., 2021). Taxonomy was larity by VSEARCH, and then the sequences within each precluster
assigned using the SINTAX algorithm (Edgar, 2016) as implemented were clustered at 97% and 99% similarity by BLASTCLUST (version
in VSEARCH (version 2.15.1; Rognes et al., 2016) with a bootstrap 2.2.26; Altschul et al., 1990; Dondoshansky & Wolf, 2000). In ad-
threshold of 0.8. dition to these, respectively, lax and more stringent species-level6 of 14 | ESHGHI SAHRAEI et al.
thresholds, we also generated approximately genus-level clusters 2.6.2 | Using OTU_S to explore community
using a 90% (GH_90) similarity threshold (Tedersoo et al., 2014). We composition in different conditions
then mapped the three ITS2 clustering levels onto the phylogenetic
tree to determine how many clusters were monophyletic and how Distribution and abundance of OTU_Ss were visualized across the
well the three different OTU generation methods captured diversity contrasting soil conditions wet versus mesic-dry soil conditions and
at different threshold levels. Further, we estimated the abundance presence/absence of F. meleagris using a Venn-diagram (Heberle
necessary for a taxon to be detected as an OTU_A. For this, we used et al., 2015). The relative abundance of unique and shared fungal
the average read abundance of OTU_S and OTU_C sequences as- and protist OTU_Ss were calculated across samples for the two
signed to GH_90, SH_97 and SH_99 ITS2 clusters to identify the de- contrasting conditions. To identify differentially abundant taxa in
tection limit of DADA2. contrasting soil moisture regimes (wet vs. mesic-dry) and presence/
absence of F. meleagris, the “phyloseq-to-deseq” function in the phy-
loseq package (v 1.34.0; McMurdie & Holmes, 2013) was applied to
2.5.3 | OTU accumulation curves OTU_S occurrence tables separately. The generated phyloseq object
was analyzed using the DESeq2 tool (DESeq package version 1.30.1;
OTU accumulation curves and asymptotic species richness estimates Love et al., 2014). Identified taxa and their differential abundance
were calculated using the iNEXT package (Hsieh et al., 2016) in R were illustrated using the ggplot2 R package (Wickham, 2016).
(version 4.0.4; R Core Team, 2019). For this analysis, accumulation
curves for OTUs, SH_99, SH_97 or GH_90 were calculated sepa-
rately for the three clustering methods, the two different soil mois- 3 | R E S U LT S
ture regimes (wet and mesic-dry) based on the number of raw reads
obtained in each soil moisture regime and the number of samples. 3.1 | Plant community shift across sharp soil
moisture transition at the Kungsängen meadow
2.6 | Statistical analysis The plant community was assessed in plots along two permanent
transects stretching from the wetter part close to the Fyris River to a
2.6.1 | Plant and soil microeukaryotes mesic-dry part of the meadow (Figure 1). A total of 85 plant species
community analysis were recorded along transects 1 and 4 (73 and 61 species, respec-
tively; Data S4), with the highest numbers, 24–29 plant species, re-
Statistical analysis were performed in R using RStudio (RStudio corded in plots 13–16 in transect 1 (Figure S2), just on the mesic-dry
Team, 2015). The community composition of plant species recorded side of the moisture transition. In accordance with earlier inventories
in all plots along transects 1 and 4 was visualized by nonmetric (Sernander, 1948; Zhang, 1983), the number of recorded plant spe-
Multidimensional Scaling (nMDS) using Bray-Curtis dissimilarities. cies dropped rapidly in the wet part of the meadow with on average
Both plant and belowground analyses were made with the vegan only six species per plot across plots 17–25. There is a slight levee
software package (version 2.5-7; Oksanen et al., 2019). The two- along the river where the number of recorded species increases again
sample I-test was used to test for significant difference in mean (Figure S2). nMDS ordination of the plant community along tran-
gravimetric soil moisture between the two soil moisture regimes sects 1 and 4 demonstrates the distinct separation between plots
(wet vs. mesic-dry). The three OTU occurrence tables were trans- in the mesic-dry part east of the soil sampling compared with the
formed to relative abundances for each sample and used for com- wet part west of the soil sampling (Figure 2), and with a transition
munity analysis. nMDS ordination plots were generated using the from Carex disticha to Carex acuta dominance at the border (Zhang,
“metaMDS”function in vegan. To down weight the importance of 1983). Alopecurus pratensis and Stellaria graminea were detected in
common taxa, the analysis was repeated using square root transfor- all plots in the mesic-dry area and Poa trivialis, Phleum pratense, and
mation of relative abundance data prior to calculation of the Bray- Trifolium repens were other highly abundant species in the mesic-dry
Curtis dissimilarity. Marginal and individual PERMANOVAs were area (Data S4). Fritillaria meleagris was frequent in plots in the mesic-
conducted on all three datasets and two standardizations described dry part to the east of the soil sampling (and also in elevated plots
above, using the “adonis” function in the vegan to test for the mar- closest to the river) but did not occur in the wetter parts of the tran-
ginal and overall effect of soil moisture regime (wet vs. mesic-dry) sects (Figure S2). The distinct C. acuta dominated community in the
and presence/absence of F. meleagris on shaping belowground mi- wet side of the meadow has been previously reported (Zhang, 1983).
croeukaryotic communities at the study site. Other frequently observed species in the wet area include Equisetum
After taxonomic assignment as described above, the three OTU fluviatile, C. disticha, and Galium palustre. Soil sampling in early June
occurrence tables were divided into two separate datasets for fun- confirmed that mean gravimetric soil moisture was significantly dif-
gal and protist communities separately (i.e., nonfungal microeukary- ferent (p < .001; t = −5.1812, nwet = 10; ndry = 10) on either side of the
otes). The ordination and PERMANOVA tests described above were plant community transition border, with 76% and 34% soil moisture in
repeated for these taxonomically distinct communities. the wet compared with the mesic-dry side of the meadow (Figure S3).ESHGHI SAHRAEI et al. | 7 of 14
F I G U R E 2 Non-metric
multidimensional scaling (nMDS)
ordination of the plant community in plots
along transect T1 (plots 1–28, red) and
T4 (plots 61–76 blue). Ellipses outline the
distribution of plots from the wet part
(green) and mesic-dry part (black). Plots
75 and 76 are on the levee close to the
river with somewhat deviating vegetation.
The closest plots to the locations for soil
microbiome sampling (enclosed by dashed
ellipses) on the mesic-dry side were plots
14–16 (T1) and 67–68 (T4) and on the wet
side plots 17–18 (T1) and 69 (T4)
TA B L E 1 Number of inferred OTUs and the number of reads represented, for total microeukaryotic community and (fungi), for the three
different clustering methods
Inferred OTUs Total OTUs (Reads) Out of total reads (%) Fungal OUT (Reads) Protists OTU (Reads)
OTU_A 1336 (14,056) 28.4 554 (4784) 662 (7238)
OTU_C 2488 (41,380) 81.3 933 (16,541) 1,168 (20,195)
OTU_S 2046 (42,353) 83.4 769 (17,130) 925 (20,653)
3.2 | Characterizing the belowground OTUs were taxonomically assigned to kingdom Fungi. Based on
microeukaryotic community composition read abundance, the estimated proportion of fungi ranged from
34% for OTU_As compared with just over 40% for the two other
3.2.1 | Delimitation and identification of methods (Table 1). Protists thus dominated the sequenced micro-
microeukaryotic OTUs eukaryotic soil community at this site.
The three different OTU generation methods infer somewhat dif-
ferent community compositions from sequenced long-read rDNA 3.2.2 | OTU generation methods captured
environmental DNA amplicons. For instance, the methods resulted consistent community patterns across soil conditions
in very different estimates of total non-singleton OTU richness,
ranging from 1,336 OTU_A detected based on inference of ASVs, All three OTU generation methods consistently demonstrate that
compared with 2,046 OTU_S and 2,488 OTU_C for sequence total soil microeukaryotic community composition clearly differenti-
similarity-based clustering using single-linkage or centroid-based ated based on soil condition (wet or mesic-dry), but no pattern was
clusters, respectively (Table 1). The OTU_A dataset represents detected in relation to the presence of F. meleagris, as observable in
only 28% of the raw reads while the two other methods were nMDS ordinations (Figure 3). The observed separations were statis-
comparable, capturing 81–8 3% of the reads into OTUs (Table 1). tically significant (p = .001) as indicated by a marginal PERMANOVA
After pooling all reads, OTU accumulation curves for the three test (Table S4) and remained when the importance of rare OTUs
methods indicate that sequencing depth was sufficient to reach was down-weighted by square root transformation of relative abun-
comparable asymptotic OTU richness estimates in both mesic-dry dances (Figure S6, Table S5). Similar to observations for the plant
and wet soil conditions (Figure S4a). For individual samples, how- community (Figure 2), microeukaryotic community composition
ever, increased sequencing depth would be expected to increase was more variable among samples in wet soil conditions compared
OTU detection for OTU_S and OTU_C but not for OTU_A (Figure with mesic-dry soil conditions (Figure 3). Mesic-dry samples clus-
S5). Further, the estimated asymptotic OTU richness increased for tered closer together indicating that communities were more similar
all methods when analyzing the pooled reads based on number across samples (Figure 3). When analyzing fungal and protist com-
of samples (Figure S4b), indicating that taking additional samples munity composition separately, we observed the same significant
would be expected to increase the number of detected taxa for separation (p < .001) based on soil conditions (wet or mesic-dry),
all methods. Across the three methods, 38–42% of the detected but not in relation to the presence of F. meleagris (Figure S7, Table8 of 14 | ESHGHI SAHRAEI et al.
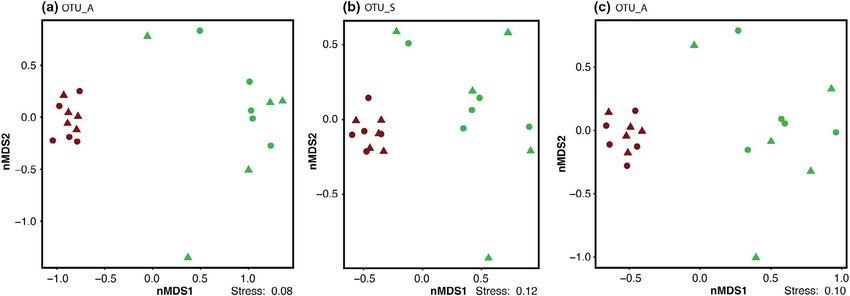
F I G U R E 3 Non-metric multidimensional scaling (nMDS) ordination of microeukaryotic communities recovered from wet (green) and
mesic-dry (brown) soil moisture regimes at the Kungsängen Nature Reserve using Bray-Curtis dissimilarities calculated from relative
abundance based on three different OTU inference methods (a) OTU_A, (b) OTU_S, and (c) OTU_C. Circles are samples with a F. meleagris
plant and triangles are samples without F. meleagris plant
S6). While still significant, the separation is visually less distinct for 3.3 | Different OTU generation methods strongly
the protist community based on OTU_S and OTU_C (Figure S7d,f) influence species richness estimates
compared with OTU_A (Figure S7b). The tight clustering of samples
from mesic-dry conditions is recovered in both fungal and protist Overall community composition is captured well across the three
communities (Figure S7). OTU generation methods when analyzing ecological patterns
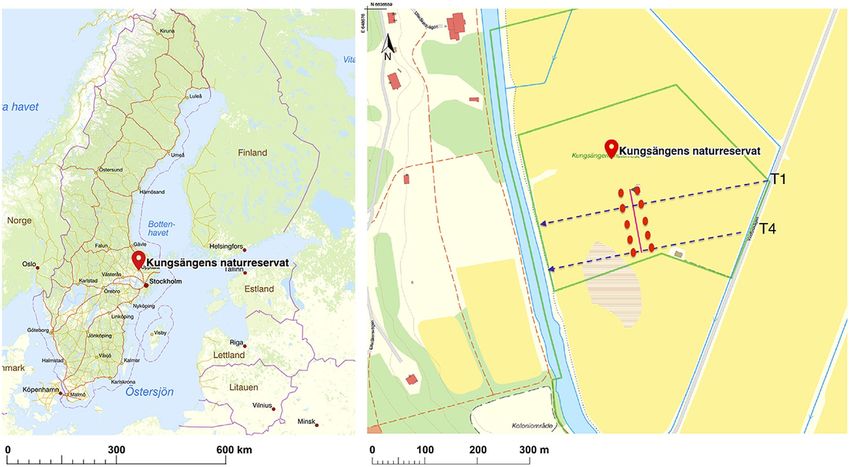
Overall, phylum-level taxonomic composition was also compa- (Figure 3) and relative abundance at the phylum level (Figure 4).
rable across the three OTU generation methods used (Figure 4). However, the OTU generation methods differentially capture and
Based on read abundance, protist communities were dominated by represent the taxa in these communities, so that from the same raw
the Ciliophora (Alveolata) in both wet and mesic-dry soil conditions reads, different sequences are selected to represent the clustered
(Figure 4a). The relative abundance of Alveolata was slightly lower raw reads in the three datasets. The dependence on abundant seed
when communities were characterized using OTU_C and OTU_S sequences for denoising resulted in fewer OTU_As compared with
compared with the OTU_A dataset (Figure S8). The Rhizarian phyla the two other methods and entire lineages of rare taxa remained
Endomyxa, Phytomyxea, and Filosa were also observed in both undetected with this method, while a large number of OTU_As are
conditions and were more abundant when reads were clustered recovered from abundant taxa such as Mortierellomycota (Figure 4b
into OTU_C and OTU_S compared with OTU_As (Figure 4a). In wet and Figure S9). The detection limits of different OTU generation
conditions, a larger proportion of reads within both Alveolata and methods were compared by generating approximately genus-level
Rhizaria could not be identified at the phylum level highlighting clusters using sequence similarity thresholds at 90% and species-
the potential for future studies of poorly known lineages at this level clusters at either 99 or 97% across the ITS2 region extracted
site. The proportion of Ciliophora was smaller in wet vs. mesic- from all OTU representative sequences. Only 36% of all genus-level
dry conditions. In both soil conditions, Ascomycota was the most clusters (GH_90) in the dataset were represented by an OTU_A se-
common fungal phylum, and together with Basidiomycota, made quence, compared with 94 and 96% for OTU_C and OTU_S, respec-
up over half of the sequenced fungal community in wet soil con- tively (Table 2). The level of detection for SHs represented by up
ditions (Figure 4b). In mesic-dry soil conditions on the other hand, to 50 reads was lower for OTU_A than the other methods. In some
Mortierellomycota made up a larger fraction of the reads, around cases, even close to 300 reads was not enough to detect a SH_99
30%. Sequences assigned to Glomeromycota, which encompass all with OTU_A (Figure S10). Even the more inclusive methods did not
arbuscular mycorrhizal fungi, were rare at this site, despite known capture exactly the same genus-level diversity, with just over 7% of
high abundance based on spore counts (personal observations of all GH_90 represented by a sequence recovered by a single method
S.E.S.). Chytridiomycota were also more abundant in mesic-dry (Table 2). However, no GH_90 was represented only by an OTU_A
compared with wet soil conditions, while Rozellomycota made up sequence.
around 10% of the reads in both conditions. Close to 20% of fungal Species richness estimates are heavily influenced by the OTU
OTUs remained unidentified at phylum level across all three meth- generation method used with the lowest numbers estimated with
ods (Figure 4b). Many of these unidentified lineages cluster with OTU_A for all three ITS2 sequence similarity levels GH_90, SH_97
Zoopagomycota, Kickxellomycota, and Rozellomycota in the fungal and SH_90 (Figure 5). While OTU_A richness was estimated to satu-
tree (Data S3). rate close to 1000 in both wet and mesic-dry soil conditions (FigureESHGHI SAHRAEI et al. | 9 of 14 F I G U R E 4 Phylum-level taxonomic assignments of microeukaryotic communities in wet and mesic-dry soil moisture regimes separated into (a) protists and (b) Fungi. Illustrated as mean fractional read abundance for the three occurrence tables OTU_A, OTU_C, and OTU_S. Phyla which represent
10 of 14 | ESHGHI SAHRAEI et al.
branch lengths separating terminal nodes (Figure S12a). In these lin-
eages, the existing variation within conserved regions, which may be
in part due to sequencing errors, provides low phylogenetic reso-
lution, resulting in collapse to random order in the tree. The same
pattern applies to cases of polyphyletic SH_97 and SH_99 clusters
since different sequence regions were used for phylogenetic infer-
ence and similarity clustering (Data S3).
As expected, different OTU generation methods detect different
levels of genetic variation within and between taxa in the sequenced
fungal community. For rare taxa, OTU_A completely fails to even
detect phylum level diversity, as in the case of Glomeromycota, that
was recovered in six OTUs across OTU_C and OTU_S, all of which
represent rare taxa in the dataset (Figure S12b). In abundant taxa
on the other hand, intra-species variation is captured with several
OTU_A sequences per SH_99 or SH_97 (Figure S10), while the other
methods identify one or two variants as exemplified by a single
Morteriella SH_99, containing 12 OTU_As (Figure S12c).
3.4 | Differentially abundant taxa in
microeukaryote community
Based on the consistency between number of OTU_S and SH_99, we
conclude that the OTU_S dataset provides a better estimate of total F I G U R E 5 Species richness curve estimated from the bottom
up as SH_99, SH_97, and GH_90, based on all reads combined for
species richness. We thus used this dataset for further analysis of dif-
ten samples each from mesic-dry and wet soil moisture regimes.
ferences in communities associated with contrasting soil conditions.
OTUs were inferred using three different clustering methods:
Across the total microbial eukaryotic community, 282 fungal and OTU_A (green), OTU_C (orange), and OTU_S (purple) and the ITS2
383 protist OTU_Ss were present in both wet and mesic-dry condi- region of their representative sequences were then clustered into
tions. A total of 195 fungal and 243 protists OTU_Ss were presented species and genus hypotheses (SH and GH), using three different
only in wet conditions, while 292 fungal and 299 protists OTU_Ss ITS2 sequence similarity thresholds 99% for SH_99, 97% for SH_97,
and 90% for GH_90
were detected only in mesic-dry condition (Figure S13). Based on the
DESeq analysis, only 15 were significantly differentially abundant
across all OTU_S (Figure S14). Four out of fifteen were protists, one abundant based on the DESeq analysis. This is likely a result of sam-
of them belongs to genus Polymyxa and is only found in mesic-dry pling large soil volumes with multiple microhabitats, where only
condition while the other three are found predominantly in wet soil some are affected by the target plant species. Our attempt to also
condition (Data S5). Taxa in at least two of the Polymyxa genus have sequence root associated communities, which would be expected
been reported as plant root endoparasites (Decroës et al., 2019; to better capture specifically host plant associated microorganisms,
Neuhauser et al., 2014). Of the eleven OTU_S belonging to the fun- failed due to low success rate of microeukaryote amplification from
gal kingdom, only one was significantly more abundant in the mesic- F. meleagris root samples (data not shown).
dry condition. Five OTU_Ss belong to Ascomycota were identified
until genus level (three Cistella, Psedeurotium, and Stagonospora), and
two OTU_Ss belong to Basidiomycota, recognized to the order level. 4 | DISCUSSION
All these taxa were significantly more abundant in the wet condition
(Data S5). Detection of significant association with the contrasting In this study, we used a distinct transition zone in vegetation and soil
soil conditions is limited by the current sampling design with only moisture, as the framework to analyze how different OTU genera-
ten samples from wet and mesic-dry, respectively. Additional sam- tion methods affect the detection of a shift in the composition of mi-
ples would have captured more of the local community. In relation croeukaryotic soil communities. Interestingly, the sharp transition in
to the presence/absence of F. meleagris, 160 fungal and 231 protists plant community, with lower richness in wet compared with mesic-
OTU_Ss were detected only in F. meleagris samples, while 144 fungal dry soils, was not associated with a difference in observed richness
and 159 protist OTU_Ss were observed in samples without F. melea- for the corresponding microeukaryotic soil communities. However,
gris. In total, 465 fungal and 544 protist OTU_Ss were observed in both plant and soil microeukaryote community compositions were
both with and without F. meleagris samples (Figure S15). Taking into significantly different in wet and mesic-dry soil moisture regimes.
account the low number of samples no OTU_Ss were differentially We demonstrate that different OTU generation methods applied toESHGHI SAHRAEI et al. | 11 of 14 the same long amplicon eDNA dataset affect the documented com- low read abundance for this group, despite known high abundance position of soil microeukaryotic communities. Similarly, earlier stud- of Glomeromycota spores at the site. This apparent contradiction ies have reported that large-scale ecological patterns are recovered may be explained by the low copy number of around ten rDNA oper- irrespective of the OTU or ASV generation method or clustering ones in this phylum (Maeda et al., 2018) compared with other fungi threshold (for short-read data) (Glassman & Martiny, 2018), sequenc- that may harbor hundreds to thousands of copies (Lofgren et al., ing technology (Furneaux et al., 2021) or sampling effort (Castle 2019). In addition to copy number variation, length difference in the et al., 2019). We conclude that large-scale ecological patterns are ro- rDNA, especially ITS, can introduce bias both during PCR and se- bustly recovered irrespective of the OTU or ASV generation method quencing (Leho Tedersoo et al., 2015), rendering this type of data far applied. However, for studies focused on the particular members from quantitative, especially when applied to broad phylogenetically of these contrasting communities, the OTU generation method se- groups such as microeukaryotes. lected significantly affects the phylogenetic resolution and detection Our study also provides a first insight into the belowground di- of taxa. For instance, our results show that inference of ASVs with versity of microeukaryotes in a meadow known for its rich plant com- DADA2 (here OTU_A) captures less than 30% of all reads, provid- munity (Sernander, 1948; Zhang, 1983; Zhang & Hytteborn, 1985). ing information on intra-species genetic variation only for abundant Studies that aim to simultaneously characterize communities of taxa while rare taxa, including entire phylum-level lineages, remain both protists and fungi have often found that fungi dominate the se- undetected. The overall estimated OTU richness was also lower for quenced microeukaryotic communities, for example, in tropical forest OTU_A compared with the cluster-based methods. When comparing soil (Tedersoo et al., 2018) and soils from different habitats in temper- OTU generation methods, others have found contrasting patterns, ate regions (Tedersoo & Anslan, 2019). In previous studies using the with higher richness captured with ASVs, the equivalent to OTU_A exact same primers, sequenced soil communities from ectomycorrhi- in this study, compared with clustering (Glassman & Martiny, 2018). zal dominated forests in Sweden and West Africa have been almost Differences between our results and those of Glassman and Martiny completely dominated by reads taxonomically assigned to kingdom (2018) can be attributed to the earlier study's shorter amplicon (only Fungi (Furneaux et al., 2021; Kalsoom Khan et al., 2020; Meidl et al., ITS2 for fungi) and higher sequencing depth generated by Illumina, 2021). The dominance of protists in the sequenced microeukaryotic compared with our long amplicon sequencing with lower depth using community indicates that these soil systems are particularly suitable PacBio. In studies using short-read amplicons, denoising increased for diverse communities of protists. High soil moisture may be one overall richness by capturing intraspecies genetic variation (Callahan explanation, but other factors like plant community, pH and total ni- et al., 2016). However, when applied to long-read amplicons from di- trogen have also been associated with high abundance of protists in verse communities, intra-species variation can only be captured for soil (Oliverio et al., 2020). We anticipate that future studies may hold the most abundant taxa. While OTU accumulation curves saturated many interesting discoveries of hitherto unknown diversity at this site. for all methods, we found that increasing the number of samples would have increased the number of detected taxa at the site. Due AC K N OW L E D G M E N T S to soil heterogeneity and spatial community turnover, increasing the We would like to acknowledge bioinformatic help from Dr. number of samples rather than the sequencing depth increases the D. Scofield, Dr. T. Ammunet, and help with sampling from S. estimated alpha diversity even in well-mixed, managed agricultural Johannesson and M. Vass. Dr J. Tångrot assisted us in raw data soils (Castle et al., 2019). The same pattern was previously observed and OTU sequence submission as part of the Biodiversity Atlas in forest soils from West Africa (Meidl et al., 2021), highlighting the Sweden which is made possible by its partners and by grants importance of optimizing sampling effort versus sequencing depth from the Swedish Research Council. In addition to funding from to obtain a good representation of the alpha diversity. ERC (678792) we acknowledge support for sequencing at the Single-linkage clustering with a distance threshold of 2%, on the National Genomics Infrastructure (NGI) / Uppsala Genome Center other hand, captures most reads in OTU_Ss that correspond closely and SciLife Laboratory, Uppsala, supported by the VR and the to broadly accepted fungal species-level sequence similarity across KAW. Bioinformatic analysis was possible thanks to the National the ITS region, suggesting that this method provides an acceptable Bioinformatics Infrastructure Sweden (NBIS) and enabled by re- proxy for species richness. We anticipate that phylogenetic res- sources provided by the Swedish National Infrastructure for olution of species- and genus-level relationships could have been Computing (SNIC), partially funded by the Swedish Research improved by the generation of a hybrid tree that included ITS2 align- Council through grant agreement no. 2018-05973. ments to resolve relationships within each GH_90 lineage, in a man- ner similar to ghost-tree (Fouquier et al., 2016). Such tree could have C O N FL I C T O F I N T E R E S T been used to generate phylogenetic SH (ref) to analyze community The authors state no conflict of interest. composition and generate species richness estimates for these com- munities. Apart from sequence clustering approaches, extraction AU T H O R C O N T R I B U T I O N and amplification biases remains as a major filtering step for analysis Shadi Eshghi Sahraei: Data curation (equal); Formal analysis (equal); of total microeukaryotic soil communities. Although the primers we Validation (equal); Visualization (equal); Writing – original draft used have no known biases against Glomeromycota, we obtained (equal). Brendan Furneaux: Conceptualization (equal); Data curation
12 of 14 | ESHGHI SAHRAEI et al.
Edgar, R. C. (2013). UPARSE: highly accurate OTU sequences from mi-
(equal); Formal analysis (lead); Methodology (lead); Validation (sup- crobial amplicon reads. Nature Methods, 10(10), 996–998. https://
porting); Visualization (equal); Writing – original draft (supporting). doi.org/10.1038/nmeth.2604
Kerri Kluting: Data curation (equal); Formal analysis (supporting); Edgar, R. C. (2016). SINTAX: a simple non-bayesian taxonomy classifier
for 16S and ITS sequences. bioRxiv, 074161.
Writing – original draft (supporting). Mustafa Zakieh: Investigation
Fouquier, J., Rideout, J. R., Bolyen, E., Chase, J., Shiffer, A., McDonald, D.,
(supporting); Methodology (supporting); Writing – original draft
Knight, R., Caporaso, J. G., & Kelley, S. T. (2016). Ghost-tree: creating
(supporting). Håkan Rydin: Investigation (supporting); Methodology hybrid-gene phylogenetic trees for diversity analyses. Microbiome,
(supporting); Writing – original draft (supporting). Håkan Hytteborn: 4(1), 1–10. https://doi.org/10.1186/s40168-016-0153-6
Investigation (supporting); Methodology (supporting); Writing – Frøslev, T. G., Kjøller, R., Bruun, H. H., Ejrnæs, R., Brunbjerg, A. K.,
Pietroni, C., & Hansen, A. J. (2017). Algorithm for post-clustering
original draft (supporting). Anna Rosling: Conceptualization (equal);
curation of DNA amplicon data yields reliable biodiversity esti-
Funding acquisition (lead); Investigation (equal); Methodology mates. Nature Communications, 8(1), 1–11. https://doi.org/10.1038/
(equal); Project administration (lead); Resources (lead); Supervision s41467-017-01312-x
(lead); Validation (equal); Writing – original draft (equal). Furneaux, B., Bahram, M., Rosling, A., Yorou, N. S., & Ryberg, M. (2021).
Long-and short-read metabarcoding technologies reveal similar
spatiotemporal structures in fungal communities. Molecular Ecology
DATA AVA I L A B I L I T Y S TAT E M E N T Resources. https://doi.org/10.1111/1755-0998.13387
Raw reads, accompanying meta-data and representative OTU_S se- Geisen, S. (2016). Thorough high-throughput sequencing anal-
quences are available in ENA under the accession no. PRJEB47280. yses unravels huge diversities of soil parasitic protists.
Environmental Microbiology, 18(6), 1669–1672. https://doi.
org/10.1111/1462-2920.13309
ORCID Geisen, S., Mitchell, E. A. D., Adl, S., Bonkowski, M., Dunthorn, M.,
Shadi Eshghi Sahraei https://orcid.org/0000-0003-4741-5871 Ekelund, F., Fernández, L. D., Jousset, A., Krashevska, V., Singer, D.,
Brendan Furneaux https://orcid.org/0000-0003-3522-7363 Spiegel, F. W., Walochnik, J., & Lara, E. (2018). Soil protists: a fertile
frontier in soil biology research. FEMS Microbiology Reviews, 42(3),
Kerri Kluting https://orcid.org/0000-0002-2328-8081
293–323. https://doi.org/10.1093/femsre/fuy006
Håkan Rydin https://orcid.org/0000-0002-7582-3998 Glassman, S. I., & Martiny, J. B. (2018). Broadscale ecological patterns are
Anna Rosling https://orcid.org/0000-0002-7003-5941 robust to use of exact sequence variants versus operational tax-
onomic units. Msphere, 3(4), e00148-18. https://doi.org/10.1128/
mSphere.00148-18
REFERENCES Griffith, P., Raley, C., Sun, D., Zhao, Y., Sun, Z., Mehta, M., & Wu, X.
Adl, S. M., Bass, D., Lane, C. E., Lukeš, J., Schoch, C. L., Smirnov, A., (2018). PacBio library preparation using blunt-end adapter ligation
Agatha, S., Berney, C., Brown, M. W., Burki, F., Cárdenas, P., produces significant artefactual fusion DNA sequences. bioRxiv,
Čepička, I., Chistyakova, L., Campo, J., Dunthorn, M., Edvardsen, B., 245241.
Eglit, Y., Guillou, L., Hampl, V., … Zhang, Q. (2019). Revisions to the Guillou, L., Bachar, D., Audic, S., Bass, D., Berney, C., Bittner, L., Boutte,
classification, nomenclature, and diversity of eukaryotes. Journal C., Burgaud, G., de Vargas, C., Decelle, J., del Campo, J., Dolan, J.
of Eukaryotic Microbiology, 66(1), 4–119. https://doi.org/10.1111/ R., Dunthorn, M., Edvardsen, B., Holzmann, M., Kooistra, W. H. C.
jeu.12691 F., Lara, E., Le Bescot, N., Logares, R., … Christen, R. (2012). The
Altschul, S. F., Gish, W., Miller, W., Myers, E. W., & Lipman, D. J. (1990). Protist Ribosomal Reference database (PR2): a catalog of unicel-
Basic local alignment search tool. Journal of Molecular Biology, 215(3), lular eukaryote small sub-unit rRNA sequences with curated tax-
403–410. https://doi.org/10.1016/S0022-2836(05)80360-2 onomy. Nucleic Acids Research, 41(D1), D597–D604. https://doi.
Burki, F., Sandin, M. M., & Jamy, M. (2021). Diversity and ecology org/10.1093/nar/gks1160
of protists revealed by metabarcoding. Current Biology, 31(19), Heberle, H., Meirelles, G. V., da Silva, F. R., Telles, G. P., & Minghim, R.
R1267–R1280. https://doi.org/10.1016/j.cub.2021.07.066 (2015). InteractiVenn: a web-based tool for the analysis of sets
Callahan, B. J., McMurdie, P. J., Rosen, M. J., Han, A. W., Johnson, A. J. A., through Venn diagrams. BMC Bioinformatics, 16(1), 1–7. https://doi.
& Holmes, S. P. (2016). DADA2: high-resolution sample inference org/10.1186/s12859-015-0611-3
from Illumina amplicon data. Nature Methods, 13(7), 581. https:// Hoang, D. T., Chernomor, O., Von Haeseler, A., Minh, B. Q., & Vinh, L.
doi.org/10.1038/nmeth.3869 S. (2018). UFBoot2: improving the ultrafast bootstrap approxima-
Castle, S. C., Samac, D. A., Sadowsky, M. J., Rosen, C. J., Gutknecht, J. L., tion. Molecular Biology and Evolution, 35(2), 518–522. https://doi.
& Kinkel, L. L. (2019). Impacts of sampling design on estimates of org/10.1093/molbev/msx281
microbial community diversity and composition in agricultural soils. Holliday, V. T. (1990). Methods of soil analysis, part 1, physical and min-
Microbial Ecology, 78(3), 753–763. https://doi.org/10.1007/s0024 eralogical methods. In A. Klute (Ed.), American Society of Agronomy,
8-019-01318-6 Agronomy Monographs 9 (1), Madison, Wisconsin (pp. 87–89). Wiley
Decroës, A., Calusinska, M., Delfosse, P., Bragard, C., & Legrève, A. Online Library.
(2019). First draft genome sequence of a polymyxa genus mem- Hsieh, T., Ma, K., & Chao, A. (2016). iNEXT: an R package for rarefaction
ber, Polymyxa betae, the Protist Vector of Rhizomania. Microbiology and extrapolation of species diversity (H ill numbers). Methods in
Resource Announcements, 8(2), e01509–e 01518. Ecology and Evolution, 7(12), 1451–1456.
del Campo, J., Kolisko, M., Boscaro, V., Santoferrara, L. F., Nenarokov, Jamy, M., Foster, R., Barbera, P., Czech, L., Kozlov, A., Stamatakis,
S., Massana, R., Guillou, L., Simpson, A., Berney, C., de Vargas, C., A., Bending, G., Hilton, S., Bass, D., & Burki, F. (2020). Long-
Brown, M. W., Keeling, P. J., & Wegener Parfrey, L. (2018). EukRef: read metabarcoding of the eukaryotic rDNA operon to phy-
phylogenetic curation of ribosomal RNA to enhance understand- logenetically and taxonomically resolve environmental diver-
ing of eukaryotic diversity and distribution. PLoS Biology, 16(9), sity. Molecular Ecology Resources, 20(2), 429–4 43. https://doi.
e2005849. https://doi.org/10.1371/journal.pbio.2005849 org/10.1111/1755-0998.13117
Dondoshansky, I., & Wolf, Y. (2000). BLASTCLUST-BLAST score-based Kalsoom Khan, F., Kluting, K., Tångrot, J., Urbina, H., Ammunet, T.,
singlelinkage clustering. http://www.ncbi.nlm.nih.gov/BLAST/ Eshghi Sahraei, S., & Rosling, A. (2020). Naming the untouchableYou can also read