Effective coefficient of diffusion and permeability of firn at Dome C and Lock In, Antarctica, and of various snow types - estimates over the ...
←
→
Page content transcription
If your browser does not render page correctly, please read the page content below
The Cryosphere, 16, 967–980, 2022
https://doi.org/10.5194/tc-16-967-2022
© Author(s) 2022. This work is distributed under
the Creative Commons Attribution 4.0 License.

Effective coefficient of diffusion and permeability of firn at Dome C
and Lock In, Antarctica, and of various snow types – estimates over
the 100–850 kg m−3 density range
Neige Calonne1 , Alexis Burr2,3 , Armelle Philip2 , Frédéric Flin1 , and Christian Geindreau4
1 Univ. Grenoble Alpes, Université de Toulouse, Météo-France, CNRS, CNRM,
Centre d’Études de la Neige, Grenoble, France
2 Univ. Grenoble Alpes, CNRS, IRD, Grenoble INP, IGE, Grenoble, France
3 Univ. Grenoble Alpes, CNRS, Grenoble INP, SIMaP, Grenoble, France
4 Univ. Grenoble Alpes, CNRS, Grenoble INP, 3SR, Grenoble, France

Correspondence: Neige Calonne (neige.calonne@meteo.fr)

Received: 30 June 2021 – Discussion started: 22 July 2021
Revised: 15 November 2021 – Accepted: 8 February 2022 – Published: 14 March 2022

Abstract. Modeling air transport through the entire firn             tions. For firn, good agreements are found for permeability
column of polar ice sheets is needed to interpret climate            and the diffusion coefficient with two existing regressions
archives. To this end, different regressions have been pro-          of the literature based on open porosity despite the rather
posed in the past to estimate the effective coefficient of dif-      different site conditions (Greenland). Over the entire 100–
fusion and permeability of firn. These regressions are often         850 kg m−3 density range, permeability is accurately repro-
valid for specific depth or porosity ranges only. Also, they         duced by the Carman–Kozeny and self-consistent (spherical
constitute a source of uncertainty as evaluations have been          bi-composite) models when expressed in terms of a rescaled
limited by the lack of reliable data of firn transport properties.   porosity, φres = (φ −φoff )/(1−φoff ), to account for pore clo-
To contribute with a new dataset, this study presents the ef-        sure, where φoff is the close-off porosity. For the normalized
fective coefficient of diffusion and the permeability at Dome        diffusion coefficient, none of the evaluated formulas were
C and Lock In, Antarctica, from the near-surface to the close-       satisfactory, so we propose a new regression based on the
off (23 to 133 m depth). Also, microstructure is character-          rescaled porosity that reads D/D air = (φres )1.61 .
ized based on density, specific surface area, closed porosity
ratio, connectivity index, and structural anisotropy through
the correlation lengths. All properties were estimated based
on pore-scale computations from 3D tomographic images                1   Introduction
of firn samples. The normalized diffusion coefficient ranges
from 1.9 × 10⁻¹ to 8.3 × 10⁻⁵ , and permeability ranges from         Atmospheric air circulates through the interconnected pores
1.2 × 10⁻⁹ to 1.1 × 10⁻¹² m2 , for densities between 565 and         of snow and firn down to the firn–ice transition where pores
888 kg m−3 . No or little anisotropy is reported. Next, we in-       close. Air entrapped in the closed pores of ice preserves past
vestigate the relationship of the transport properties with den-     atmospheric air, thousands to millions of years old, provid-
sity over the firn density range (550–850 kg m−3 ), as well as       ing invaluable data on past Earth environments (e.g., Petit
over the entire density range encountered in the ice sheets          et al., 1999; Lüthi et al., 2008; Loulergue et al., 2008; Yan
(100–850 kg m−3 ), by extending the datasets with transport          et al., 2019). As gas transport from the surface is slow, air
properties of alpine and artificial snow from previous studies.      in the open pores of firn can be as old as several decades up
Classical analytical models and regressions from literature          to hundreds of years (Schwander et al., 1988; Battle et al.,
are evaluated against the estimates from pore-scale simula-          1996; Kaspers et al., 2004). Among other challenges, inter-
                                                                     preting firn and ice data with respect to past Earth conditions

Published by Copernicus Publications on behalf of the European Geosciences Union.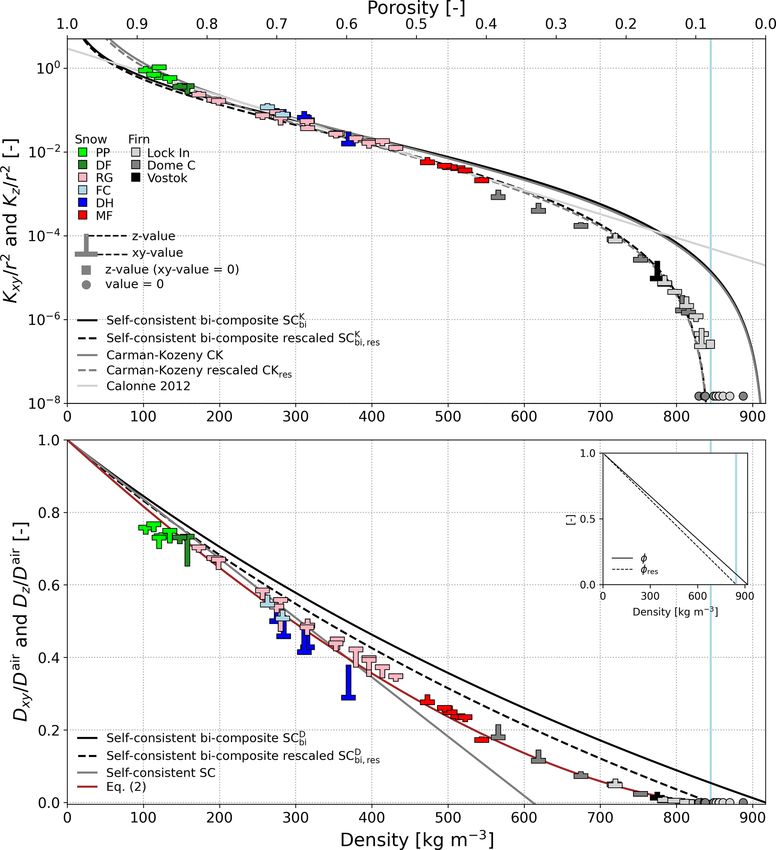
968                                                        N. Calonne et al.: Permeability and diffusion of snow to porous ice

and events requires modeling of the air transport processes         These parameterizations require the knowledge of the rela-
through the entire snow–firn–ice column (e.g., Trudinger            tionships of the closed porosity with depth (and/or density).
et al., 1997; Rommelaere et al., 1997; Goujon et al., 2003;         Such a prediction is still poorly restricted, and only limited
Severinghaus and Battle, 2006; Hörhold, 2006; Courville             parameterizations are available (Schwander, 1989; Goujon
et al., 2007; Witrant et al., 2012; Buizert et al., 2012; Stevens   et al., 2003; Severinghaus and Battle, 2006; Mitchell et al.,
et al., 2020). Two of the important properties for gas trans-       2015; Schaller et al., 2017), which adds uncertainties to the
port in snow and firn are the effective coefficient of diffusion    estimation of properties, as shown by a comparison of pa-
and the intrinsic permeability.                                     rameterizations of closed porosity at Lock In and Vostok,
   The effective diffusion coefficient tensor D (m2 s−1 ) de-       Antarctica, by Fourteau et al. (2019). Finally, some conclu-
scribes the molecular diffusion of a given gas through a layer      sions from the above-mentioned studies are that parameter-
of snow or firn, which is a dominant transport process tak-         izations of transport properties are strongly site-dependent,
ing place throughout the snow–firn column until the close-off       which might indicate that regression based on open poros-
(Schwander and Stauffer, 1984; Sowers et al., 1992). Defined        ity or porosity alone is not sufficient and that there is a more
in a tensorial way, the diffusion coefficient links the gas den-    complex relationship with microstructure or other environ-
sity gradient ∇ρg (kg m−3 m−1 ) and the diffusion flux per          mental parameters (Courville et al., 2007; Adolph and Al-
unit area J (kg m−2 s−1 ) through Fick’s law: J = −D∇ρg .           bert, 2014; Keegan et al., 2019).
The intrinsic permeability tensor K (m2 ) controls air advec-          In the present study, we provide new datasets of the effec-
tion through snow or firn forced by air pressure differences,       tive coefficient of diffusion and permeability from the near-
typically caused by wind at the surface (windpumping) (Col-         surface to the close-off for two sites in Antarctica: Dome C
beck, 1989; Waddington et al., 1996; Kawamura et al., 2006).        and Lock In. Properties of a firn sample from 80 m depth at
Permeability links the air pressure gradient ∇p (Pa m−1 ) and       Vostok, Antarctica, are also presented for additional compar-
the discharge per unit area q (m s−1 ) through Darcy’s law:         isons. Estimates are based on computations from 3D high-
q = −(1/µ)K∇p, where µ is the dynamic viscosity of the              resolution tomographic images of microstructure, as used in
fluid (kg m−1 s−1 ). In contrast to molecular diffusion, air ad-    many snow studies (e.g., Zermatten et al., 2011; Calonne
vection is not always present in snow and firn and, if so,          et al., 2012, 2014b) and in a few firn studies (Freitag et al.,
affects mostly their uppermost meters (Albert, 1996; Albert         2002; Courville et al., 2010; Fourteau et al., 2019). The
and Shultz, 2002; Albert et al., 2004). The effective diffu-        3D tensor of the properties is obtained and allows us to
sion coefficient and permeability depend on density and open        assess the anisotropy of properties and compare lateral to
porosity at first order but also on other microstructural pa-       vertical gas transport. In addition to transport properties,
rameters of snow and firn such as pore morphology.                  a variety of parameters to characterize the firn microstruc-
   The effective coefficient of diffusion and the permeabil-        ture are computed from the images (density, specific surface
ity of snow and firn were investigated at numerous sites of         area, closed porosity ratio, connectivity index, and structural
ice sheets and glaciers (e.g., Schwander, 1989; Fabre et al.,       anisotropy through the correlation lengths). Further, we in-
2000; Albert et al., 2000; Albert and Shultz, 2002; Freitag         vestigate the relationship of the effective coefficient of diffu-
et al., 2002; Goujon et al., 2003; Rick and Albert, 2004;           sion and permeability with density in the firn density range
Hörhold et al., 2009; Courville et al., 2010; Adolph and Al-        (550–850 kg m−3 ), as well as in the entire density range en-
bert, 2014; Sommers et al., 2017). Some come along with a           countered in the ice sheet (100–850 kg m−3 ), by including
characterization of the microstructure based on 3D images           data of transport properties of alpine and artificial snow from
from serial sections (e.g., Rick and Albert, 2004; Freitag          previous studies. Classical analytical models based on sim-
et al., 2002) or micro-tomography (e.g., Hörhold et al., 2009;      plified microstructures, as well as regressions from previous
Courville et al., 2010; Adolph and Albert, 2014). Differ-           firn studies, are evaluated against our results. A new regres-
ent parameterizations of the properties were suggested (e.g.,       sion is proposed to estimate the diffusion coefficient in the
Schwander et al., 1988; Fabre et al., 2000; Witrant et al.,         whole density range.
2012; Adolph and Albert, 2014), including the ones shown
in Table 1. Adolph and Albert (2014) compared different pa-
rameterizations of the diffusion coefficient and permeability       2     Methods
against their measurements at Summit, Greenland. Stevens
(2018) compared profiles of effective coefficient of diffu-         2.1    3D images
sion and δ 15 N predicted by six different parameterizations
at NEEM, Greenland, and the South Pole, Antarctica. Few             This study is based on a set of 62 3D images of snow, firn,
parameterizations are based on measurements or modeling             and bubbly ice that were previously analyzed in Calonne
over the entire firn column (Adolph and Albert, 2014), lim-         et al. (2019). A total of 27 images are samples of firn or
iting their range of validity (Table 1). It is especially cru-      bubbly ice from three locations in Antarctica: Dome C,
cial to describe air transport properties well in the lock-in       near Concordia Station (75◦ 60 S, 123◦ 210 E), Lock In, lo-
zone from the beginning of the pore closure to the close-off.       cated at 136 km away from Concordia Station (74◦ 8.3100 S,

The Cryosphere, 16, 967–980, 2022                                                        https://doi.org/10.5194/tc-16-967-2022
N. Calonne et al.: Permeability and diffusion of snow to porous ice                                                            969

126◦ 9.5100 E), and Vostok. These samples were extracted           this gas in snow or firn (for example, the diffusion coefficient
from ice cores collected during previous expeditions (Coléou       of vapor in free air, that is 2.036 × 10⁻⁵ m2 s−1 at −10 ◦ C
and Barnola, 2001; Gautier et al., 2016; Burr et al., 2018)        (Massman, 1998), could be used to get the effective diffu-
at depths ranging from 23 to 133 m and show different lev-         sion coefficient of vapor). As the non-diagonal terms of the
els of densification until the close-off. Mean annual tem-         tensor D and K are negligible, we consider only the diag-
perature and mean annual accumulation rate are of −55 ◦ C          onal terms, i.e., seen as the eigenvalues of the tensors (the
and 2.5 cm yr−1 at Dome C, of −53.15 ◦ C and 4.5 cm yr−1           image axes x, y, and z are the principal directions of the mi-
at Lock In, and of −57 ◦ C and 2.2 cm yr−1 at Vostok (from         crostructure, z being along the direction of gravity). Besides,
Burr et al., 2018, and references within). A total of 35 im-       the tensors are transversely isotropic as the components in
ages are samples of snow, covering the main snow types, ei-        x are very similar to the ones in y. In the following, D and
ther collected in the field or obtained from experiments un-       K refer to the averages of the diagonal terms of D and K,
der controlled conditions in a cold laboratory (Coléou et al.,     respectively. Dz and Kz refer to the vertical components,
2001; Flin et al., 2004, 2011; Calonne et al., 2014a). The         and Dxy and Kxy refer to the mean horizontal components,
3D images are binary images (air or ice) with resolutions be-      where Dxy = (Dx +Dy )/2 and Kxy = (Kx +Ky )/2. Finally,
tween 5 and 15 µm and with dimensions between 2.53 mm3             the anisotropy of the properties is characterized based on
and 6.72 × 25 mm3 . Computations of properties were per-           the anisotropy ratio A(D) = Dz /Dxy and A(K) = Kz /Kxy
formed with cubic images between 2.53 and 103 mm3 in size          (e.g., Calonne et al., 2014a).
for snow and 6.73 mm3 in size for firn. These images cor-
respond to volumes equal to or greater than the representa-
                                                                   2.3   Microstructural parameters
tive elementary volumes estimated for permeability, which
is the property that requires the largest volume among the
other properties computed in this paper (Kanit et al., 2003;       The density ρ (kg m−3 ) was computed from 3D images
Calonne et al., 2012, 2014a). Estimations of the representa-       by a standard voxel counting algorithm using an ice den-
tive elementary volumes for permeability were performed on         sity of ρi = 917 kg m−3 (ice density variations with temper-
selected images following Calonne et al. (2011) by comput-         ature were neglected in this study). Porosity corresponds to
ing the property over subvolumes of increasing sizes. More         φ = 1 − ρ/ρi and is the sum of the open porosity φop and of
information on the samples and 3D images can be found in           the closed porosity. In the following, density and porosity at
Calonne et al. (2019).                                             the close-off depth are referred to as ρoff and φoff , respec-
                                                                   tively. The close-off depth is the depth at which pores are
2.2   Effective coefficient of diffusion and intrinsic             fully isolated from the surface.
      permeability                                                     The connectivity of the pore space is characterized through
                                                                   the classical closed-to-total porosity ratio (CP), as well as the
The 3D tensor of the effective coefficient of diffusion D          connectivity index (CI), recently introduced by Burr et al.
(m2 s−1 ) and of the intrinsic permeability K (m2 ) were com-      (2018) as an alternative parameter to predict the close-off
puted from the set of 3D images of firn. Computed prop-            depth and density. The closed-to-total porosity ratio is ob-
erties from the images of snow are from the previous stud-         tained by dividing the total volume of closed pores by the
ies of Calonne et al. (2012) and Calonne et al. (2014b). A         total volume of pores, both determined by counting voxels in
comprehensive description of the computation method can            the 3D images. Its estimation is challenged by the cut-pore
be found in Calonne et al. (2012) for the permeability and in      effect, which is the uncertainty related to the closed or open
Calonne et al. (2014a) for the diffusion coefficient. Briefly,     status of cut pores at the volume boundaries. Cut pores were
a specific boundary value problem, describing vapor diffu-         not considered here when counting closed pores. The closed-
sion or air flow through the porous medium and arising from        to-total porosity ratio is sensitive to the sample size such that
a homogenization technique (Auriault et al., 2009; Calonne         it is underestimated when evaluated on samples that are too
et al., 2015), is solved on representative elementary volumes      small (Burr et al., 2018). The connectivity index is defined
of the images using the software GeoDict (GeoDict from             as the ratio between the volume of the largest pore and the
Math2Market GmbH, Germany, https://www.geodict.com,                total volume of pores. The connectivity index is 100 % when
10 March 2022) based on the finite difference method, ap-          the porosity is fully open and decreases as pores shrink and
plying periodic boundary conditions on the external bound-         close. For bubbly ice in which all pores are closed and of ap-
aries. The effective diffusion coefficient was computed with       proximately equal volume, this index would tend to 1 over
an artificial diffusion coefficient of gas in free air set to      the bubble number. Unlike the closed-to-total porosity ratio,
D air = 1 m2 s−1 . In this study, we present the normalized val-   the connectivity index estimation does not rely on the as-
ues of the effective diffusion D/D air (dimensionless). These      sumption of the pore status (open or closed) and is practically
normalized values can be multiplied by the diffusion coef-         independent of sample size (Burr et al., 2018). A comprehen-
ficient of the gas of interest in free air to get the physical,    sive analysis and comparison of both CI and CP parameters
non-normalized values of effective diffusion coefficient of        at Lock In and Dome C can be found in Burr et al. (2018).

https://doi.org/10.5194/tc-16-967-2022                                                      The Cryosphere, 16, 967–980, 2022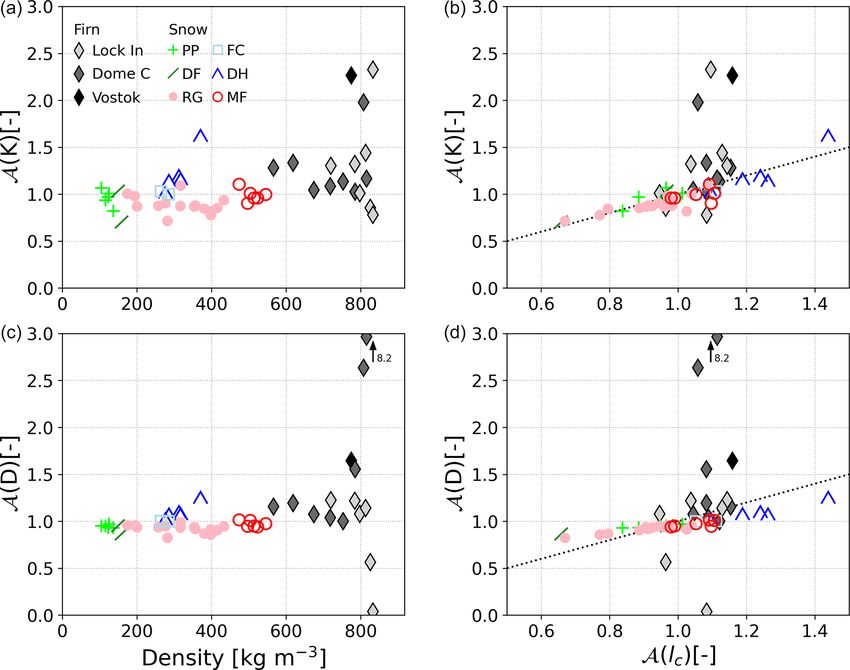
970                                                        N. Calonne et al.: Permeability and diffusion of snow to porous ice

   The correlation lengths lcx , lcy , and lcz (mm) were used as    at 91 m depth and are equal to zero at 95 m depth and below
a characteristic length of the microstructure in the x, y, and      (five samples; circle symbols). At Lock In, values range from
z direction, respectively. The two-point correlation (a.k.a.        5.1×10⁻² at 66 m depth to 8.3×10⁻⁵ at 106 m depth and are
covariance) functions for the air phase S2 (r β ) were com-         equal to zero at 108 m and below (five samples; circle sym-
puted from the 3D images, with r β a vector oriented along          bols). A coefficient of 1.6 × 10⁻² is found at Vostok at 80 m
the coordinate axes β = (x, y, z) of length |r β | = rβ that        depth. Regarding permeability, averaged values at Dome C
ranges from 0 to the image size in the β direction with             range from 1.2 × 10⁻⁹ m2 at 23 m depth to 1.4 × 10⁻¹¹ m2 at
increments of 1 pixel size (Torquato, 2002). The correla-           91 m depth and are equal to zero below. At Lock In, values
tion lengths were then determined by fitting the two-point          range from 2.4×10⁻¹⁰ m2 at 66 m depth to 1.1×10⁻¹² m2 at
correlations with an exponential equation of form S2 (rβ ) =        106 m depth and are equal to zero below. The Vostok sample
(φ − φ 2 ) exp(−rβ /lcβ ) + φ 2 , where φ is the porosity (Löwe     shows a value of 6.6 × 10⁻¹¹ m2 at 80 m depth. The small
et al., 2013; Calonne et al., 2014a). The anisotropy ratio          systematic shift in values between Lock In and Dome is
A(lc ) = lcz /lcxy , where lcxy = (lcx + lcy )/2, was used to de-   also found in the transport properties: Lock In shows over-
scribe the geometrical anisotropy of the microstructure.            all higher values of the diffusion coefficient and permeabil-
   The specific surface area of snow (SSA) describes the total      ity than Dome C for the given depths. Finally, relating the
surface area of the air–ice interface per unit mass (m2 kg−1 )      transport properties to the parameters of pore closure in the
and was computed from 3D images using a stereological               lock-in zone, we can see that the transport properties reach
method (Flin et al., 2011). Providing a characteristic length       zero at or just before the close-off depths (dashed lines in
of the ice grains, the equivalent sphere radius r (mm) is re-       Fig. 1). The zone of zero transport is characterized by con-
lated to SSA by r = 3/(SSA×ρi ) (e.g., Grenfell and Warren,         nectivity indexes between 11 % and 1 %, reflecting little to no
1999; Painter et al., 2006).                                        connected pore space. In contrast, the closed-to-total poros-
                                                                    ity ratio still increases largely from 15 % to 73 % and does
                                                                    not reach 100 %, indicating erroneously the presence of open
3     Results and discussion                                        pores after the close-off and even down to 133 m depth. This
                                                                    underestimation of the closed-to-total porosity ratio certainly
3.1    Properties at Dome C and Lock In                             comes from the cut-pore effect which is related to the surface
                                                                    to volume ratio and also to the sample size whose effect was
We present the transport properties and microstructure of           reported by Burr et al. (2018). It might indicate that the vol-
firn at Dome C and Lock In (Fig. 1). Firn microstruc-               umes used for computations are too small to allow a correct
ture gradually gets denser and coarser with depth: density          estimate of the closed-to-total porosity ratio and would re-
and SSA evolve from 565 to 888 kg m−3 and from 2.89                 quire a correction (e.g., Schaller et al., 2017).
to 0.43 m2 kg−1 , respectively, between 23 and 133 m depth.
Whereas the evolution rate is similar at both sites, Lock In        3.2   Relationship with density
shows systematically lower values of density and higher val-
ues of SSA compared to Dome C at a given depth. For com-            Next, we study the relationships of the two transport prop-
parison, the microstructure of the sample from Vostok at            erties with density. Figure 2 includes the simulations on
80 m depth is also shown and has a density of 774 kg m−3            snow samples to study the relationship over the entire snow–
and an SSA of 1.5 m2 kg−1 , matching the property profile of        firn density range (102–888 kg m−3 ). Figure 3 focuses on
Lock In. Air pores start to close from a depth of around 80 m,      firn samples only (565–888 kg m−3 ). Both figures show di-
where the closed porosity ratio (CP) and the connectivity in-       mensionless permeability values, i.e., permeability value
dex (CI) start deviating from the values of 0 % and 100 %,          K divided by the squared equivalent sphere radius: r 2 =
respectively. Again, differences in the pore closure are found      (3/(SSA × ρi ))2 . This allows us to account for the depen-
between both sites, Dome C showing an earlier onset of pore         dency of permeability with a characteristic length of the
closure than Lock In. The close-off is thus reached at a depth      microstructure (e.g., Boutin and Geindreau, 2010). The T-
of 99.3 m at Dome C and, deeper, at 108.3 m at Lock In (Burr        shaped symbols in both figures are our computed property
et al., 2018). The connectivity index reaches values close to       values, and the tips and horizontal bars indicate the vertical
0 % at these close-off depths and below. The closed-to-total        and horizontal components of the property, respectively.
porosity ratio keeps on decreasing below the close-off depth,          Values of the transport properties evolve within several
reaching 74 % at 133 m at Dome C and 60 % at 120 m at Lock          orders of magnitude over the entire density range (Fig. 2).
In. A more detailed description of the firn microstructure and      Averaged values of dimensionless permeability range from
pore closure at those sites is provided in Burr et al. (2018).      0.9 for the lightest snow sample (PP) to 2 × 10⁻³ for the
   As the pore space shrinks, transport properties decrease         densest one (MF), cover the range 10−4 to 10−7 for the
with depth, reaching zero values near the close-off depth. At       firn samples, and equal zero for the densest firn samples be-
Dome C, the averaged values of normalized diffusion coef-           low the close-off. Zero values are shown for samples with
ficient range from 1.9 × 10⁻¹ at 23 m depth to 6.2 × 10⁻⁴           densities above 830 kg m−3 at Dome C and densities above

The Cryosphere, 16, 967–980, 2022                                                       https://doi.org/10.5194/tc-16-967-2022
N. Calonne et al.: Permeability and diffusion of snow to porous ice 971
Figure 1. Evolution of firn properties with depth: density, specific surface area, closed-to-total porosity ratio, connectivity index, averaged
permeability, and averaged effective coefficient of diffusion (from left to right). Dashed lines show the close-off depth at Dome C (dark grey)
and Lock In (light grey) from Burr et al. (2018). Circle symbols indicate values of permeability and effective diffusion equal to zero. Square
symbols show a Lock In sample (106 m depth) with horizontal components of the transport properties equal to zero and correspond thus to
the values of the vertical component only.
850 kg m−3 at Lock In. For the diffusion coefficients, aver- nents of the property tensors (e.g., for Lock In at 103 m
aged values range from 0.75 to 0.17 for snow, from 10−2 depth, Dxy = 1.11 × 10⁻⁴ and Dz = 9.18 × 10⁻⁴ , leading
to 10−5 for firn above the close-off, and zero values below. to A(D) = 8.23). As these anisotropy ratios concern very
Overall, the figures highlight the strong dependency of diffu- small values of properties, they do not lead to a significant
sion and permeability to density (and to SSA for permeabil- impact in terms of gas transport. Most interestingly, in the
ity) with rather well-aligned, little scattered relationships. In range 550–750 kg m−3 , anisotropy ratios A(D) and A(K) of
contrast to the linear trend observed for snow (Calonne et al., firn are between 1 and 1.33 (six samples). These values are
2012), the effective diffusion coefficient of firn shows rather consistent with data of Freitag et al. (2002), who observed a
an exponential relationship with density. Both properties see slight anisotropy of both properties at Summit, Greenland,
their values drop when getting near to the close-off den- between 16 and 57 m depth. Finally, concerning Dome C
sity. For example, between 813 and 844 kg m−3 , the averaged especially, it seems that anisotropy ratio tends to decrease
values of the diffusion coefficient drop from 2.2 × 10⁻³ to with depth, in the range 550–750 kg m−3 , although more data
8.3 × 10⁻⁵ and the normalized permeability from 2.4 × 10⁻⁶ would be needed for this observation to be significant.
to 8.6 × 10⁻⁸ . No significant differences are found between Regarding the geometric anisotropy of the firn samples,
sites: they show similar property–density relationships, in the ratios A(lc ) are rather moderate and do not exceed 0.91
contrast to the shift observed in the property–depth relation- and 1.19, in agreement with anisotropies reported by Burr
ship as described above (Fig. 1). et al. (2018), and do not show a significant trend with depth
or density. Considering all firn samples, no clear relationship
3.3 Anisotropy is found for firn between the physical anisotropy A(D) and
A(K) and the structural anisotropy A(lc ). Looking at the six
The anisotropy ratios of both transport properties, A(D) and firn samples with a density below 750 kg m−3 , a positive cor-
A(K), and their link with the microstructure are presented relation can however be found following roughly the trend
in Fig. 4. Overall, anisotropy ratios in firn range between 0.8 observed in snow but being less significant given the small
and 2.3 for the permeability and between 0.04 and 8.2 for number of samples. Additional firn samples in the range 550–
the diffusion coefficient, which correspond to wide ranges 750 kg m−3 would be needed to fully investigate the change
compared to the range 0.8–1.6 observed for snow. However, in anisotropy ratios with depth and their relationships.
looking at the relationships of the anisotropy ratio with den-
sity (Fig. 4a and c), we see that the extreme values are found 3.4 Comparison to models
in the narrow density range 800–840 kg m−3 , i.e., near the
close-off. Those extreme values are reached by dividing very Here we evaluate two common models based on simpli-
small values of vertical components by horizontal compo- fied microstructures against our data: the self-consistent
https://doi.org/10.5194/tc-16-967-2022 The Cryosphere, 16, 967–980, 2022972 N. Calonne et al.: Permeability and diffusion of snow to porous ice
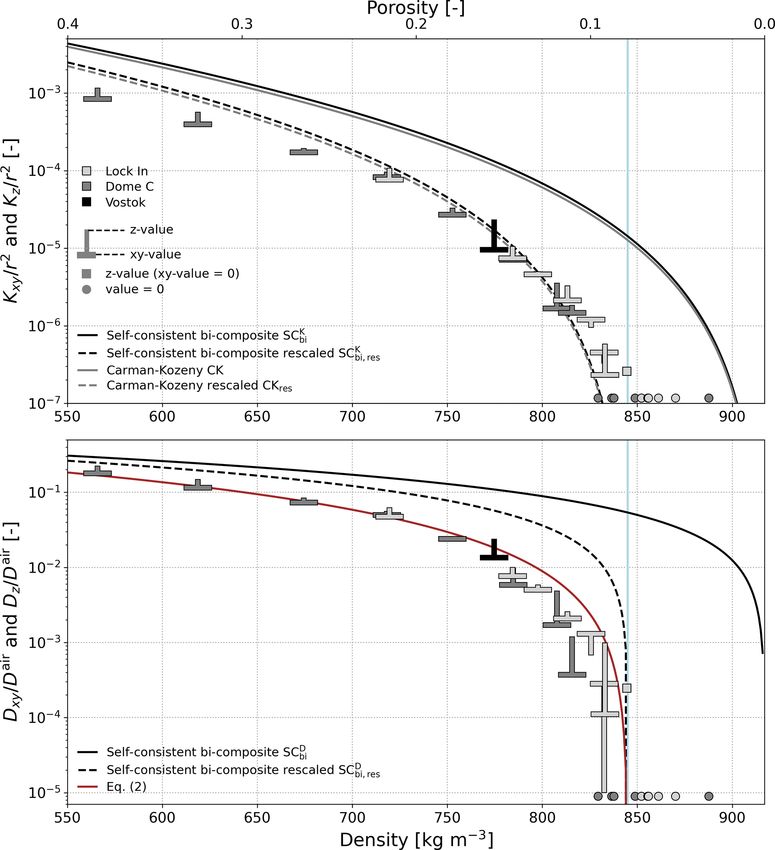
Figure 2. Dimensionless permeability and normalized diffusion coefficient of snow and firn versus density: computations from the 3D images
(“T” symbols) and analytical models (lines). The proposed regression Eq. (2) is also shown. Snow types correspond to the ICSSG (Fierz et al.,
2009): precipitation particles (PPs), decomposed and fragmented particles (DFs), rounded grains (RGs), faceted crystals (FCs), depth hoar
(DH), and melt forms (MFs). The vertical blue lines at 845 kg m−3 indicate the close-off density. The sub-caption shows the relationships of
the rescaled porosity φres (Eq. 1) compared to the total porosity φ with density.
model for bi-composite spherical inclusions (SCbi ) and the Kozeny model provides permeability estimates by describ-
Carman–Kozeny model (CK), as described in Table 1. In ing the medium as a bundle of capillarity tubes of equal
the SCbi scheme, the medium consists of a bi-composite length (Bear, 1972). Also, for comparison, we show the for-
spherical pattern made of an internal spherical grain and an mulas that provided the best agreements with the snow data
external fluid shell that ensures fluid connectivity whatever (Calonne et al., 2012, 2014b): the self-consistent model of
the porosity value (Boutin, 2000). The SCbi scheme can be the diffusion coefficient (SC), which is based on an assem-
used to provide estimates of effective diffusion coefficient blage of spherical particles of air embedded in a homoge-
(SCD K
bi ) and estimates of permeability (SCbi ). The Carman– neous equivalent medium whose effective diffusion is the
The Cryosphere, 16, 967–980, 2022 https://doi.org/10.5194/tc-16-967-2022N. Calonne et al.: Permeability and diffusion of snow to porous ice 973 Figure 3. Dimensionless permeability and normalized diffusion coefficient of firn versus density: computations from the 3D images (“T” symbols) and analytical models (lines). The proposed regression Eq. (2) is also shown. The vertical blue lines at 845 kg m−3 indicate the close-off density. unknown to be calculated (Auriault et al., 2009), and the pa- density range as they perform badly for firn. This is due to the rameterization of snow permeability (Calonne 2012). These fact that the models assume that the entire pore space corre- two formulas are however not suited for firn. All the above- sponds to open porosity. Zero values of both properties are mentioned models require the knowledge of density and, for consequently reached when the porosity is null. To account permeability, of a characteristic length of the microstructure, for pore closure and the fact that a portion of pores is actu- taken here as the equivalent sphere radius r of ice grains. ally not accessible to gas transport, we introduce a parame- Model estimates as a function of density are shown in ter φres that corresponds to a rescaled porosity, defined such Figs. 2 and 3. Taking the models in their original forms that φres = 0 at the close-off porosity φ = φoff and φres = 1 at (solid lines), none of them succeed in reproducing perme- φ = 1, and reads ability and the effective diffusion coefficient throughout the https://doi.org/10.5194/tc-16-967-2022 The Cryosphere, 16, 967–980, 2022
974                                                          N. Calonne et al.: Permeability and diffusion of snow to porous ice

Figure 4. Relationships of the anisotropy ratio of the permeability tensor A(K) (a, b) and of the diffusion coefficient tensor A(D) (c, d)
with density and structural anisotropy A(lc ). The arrows indicate a value of A(D) of 8.2 at a density of 832 kg m−3 for a firn sample from
Lock In. Dotted lines indicate 1 : 1 lines.

                                                                        by the CKres and SCK  bi,res model throughout the density range
                                                                        (over 9 decades), with MAE and RMSE between 2 and
φres = (φ − φoff )/(1 − φoff ).                                (1)
                                                                        8 × 10⁻¹⁰ m2 . Looking more closely, the CKres model per-
A close-off density value of ρoff = 845 kg m−3 (close-off               forms slightly better, being slightly closer to our data espe-
porosity φoff of 0.078) was taken for all sites, based on our           cially for light snow below 200 kg m−3 (R 2 of 0.9 for the
connectivity parameters (Fig. 5). Relationships of φres with            CKres estimates against 0.78 for the SCK  bi,res estimates). For
density are shown in the sub-panel of Fig. 2. φres equals 0.89          the diffusion coefficient, even with the proposed adjustment,
at a porosity of 0.9 (90 kg m−3 ), 0.24 at a porosity of 0.3            the SCD bi,res model overestimates values throughout the den-
(640 kg m−3 ), and 0.02 at a porosity of 0.1 (825 kg m−3 ). Ac-         sity range and especially for the higher densities (R 2 = 0.96
counting for pore closure through φres instead of the open              for all samples and 0.38 for firn samples).
porosity, as classically done for firn property predictive for-            To provide satisfactory estimates of the diffusion coeffi-
mulas, it is not necessary to introduce an additional relation-         cient, we applied a regression with the form ((φ − φoff )/(1 −
ship to estimate the open porosity from the total porosity, like        φoff ))a = φres
                                                                                      a to our entire dataset of snow and firn. Here
the one by Schwander (1989) (Eq. 3) for example. Classical              again, we used the proposed rescaled porosity to account for
models developed for porous media, which do not include                 pore closure and not the open porosity like many previous
open porosity, can then be used for firn by simply replacing            regressions (see Sect. 3.5). We obtained the following regres-
the total porosity by the proposed rescaled one.                        sion:
   The CK and SCbi models were modified such that the
rescaled porosity φres replaces the porosity term φ in the for-         D/D air = ((φ − φoff )/(1 − φoff ))1.61 = (φres )1.61 .        (2)
mulas. These models are referred to as CKres and SCbi,res in
the following. Results are shown by dashed lines in Figs. 2             This regression, shown in red lines in Figs. 2 and 3, provides
and 3. This modification significantly improves the model-              estimates with a MAE of 0.014 for the entire density and of
ing of the effective diffusion coefficient and permeability,            0.0027 for firn (R 2 = 0.99 for all samples and for firn sam-
especially in the pore closure zone. To quantify the model              ples).
performance, Table 2 presents the coefficient of determina-
tion R 2 , the mean absolute error MAE, and the root mean
squared error RMSE. Permeability is overall well described

The Cryosphere, 16, 967–980, 2022                                                             https://doi.org/10.5194/tc-16-967-2022
N. Calonne et al.: Permeability and diffusion of snow to porous ice 975
Table 1. Description of the analytical models and regressions of permeability and normalized diffusion coefficient for comparison with our
datasets.
Name Formula Validity range; comments
Permeability
CK K = (4r 2 × φ 3 )/(180(1 − φ)2 ) 0 < φ < 1; Carman–Kozeny estimates (Bear, 1972).
SCK
bi K = r 2 /(3β 2 ) × [−1 + (2 + 3β 5 )/(β(3 + 0 < φ < 1; self-consistent estimates for bi-composite spherical
2β 5 ))] with β = (1 − φ)1/3 inclusions (Boutin, 2000).
Freitag 2002 K = 10−7.7 m2 φop
3.4 with m = 1.5 0.04 < φ < 0.5; from pore-scale simulations on samples from 16
to 57 m depth in North Greenland (Freitag et al., 2002).
Adolph 2014 K = 10−7.29 m2 φop
3.71 with m = 1.5 0.07 < φ < 0.62; from measurements on samples from the top
85 m depth at Summit (Greenland) (Adolph and Albert, 2014).
Calonne 2012 K = 3r 2 exp(−0.013ρ) 0.4 < φ < 0.9; from pore-scale simulations on seasonal snow
samples (Calonne et al., 2012).
Normalized diffusion coefficient
SC D/D air = (3φ − 1)/2 1/3 < φ; self-consistent estimates for spherical inclusions (Auri-
ault et al., 2009).
SCD
bi D/D air = 2φ/(3 − φ) 0 < φ < 1; self-consistent estimates for bi-composite spherical
inclusions (Boutin, 2000).
Eq. (2) D/D air = ((φ − φoff )/(1 − φoff ))1.61 0 < φ < 1; from pore-scale simulations of this study.
Schwander 1988 D/D air = 1.7 × φop − 0.2 0.13 < φ < 0.5; from measurements on samples from 2 to 64 m
depth at Siple (Antarctica) (Schwander et al., 1988).
Fabre 2000 D/D air = 1.92 × φop − 0.23 0.15 < φ < 0.4; from measurements on samples from Col du
Dome (French Alps) and Vostok (Antarctica) (Fabre et al., 2000).
Freitag 2002 D/D air = φop
2.1 0.04 < φ < 0.5; from pore-scale simulations on samples at 16,
45, and 57 m depth in North Greenland (Freitag et al., 2002).
Adolph 2014 D/D air = φop
1.5 0.07 < φ < 0.62; from measurements on samples from the top
85 m depth at Summit (Greenland) (Adolph and Albert, 2014).
Fourteau 2019 D/D air = φop
2.9 φ < 0.2; from pore-scale simulations on samples from about 80
to 110 m depth at Lock In (Antarctica) (Fourteau et al., 2019).
3.5 Comparison to regressions from previous firn 1989 (φop /φ × 100) and from the closed-to-total-porosity ra-
studies tio (100 – CP) are compared in Fig. 5, together with the con-
nectivity index CI. In the following comparisons, the perfor-
Figure 5 compares the computed data at Dome C and Lock mance of the evaluated regressions depends also on the qual-
In with regressions from the studies of Fabre et al. (2000), ity of the Schwander regression (Schwander, 1989) as it was
Freitag et al. (2002), Adolph and Albert (2014), and Fourteau used to estimate the required open porosity. Note that, when
et al. (2019), as described in Table 1. These regressions were taking the open porosity values provided by the computed CP
derived from measurements or pore-scale simulations on firn ratio, the regression performances are worse than when tak-
samples from Antarctica and Greenland, as well as on a few ing the regression of Schwander 1989 as the CP ratio seems
Alpine specimens. They are all based on the open porosity, to overestimate the fraction of open pore space (Burr et al.,
which we estimated here with the commonly used regression 2018), which leads to poorer performances.
of Schwander (1989): Overall, permeability predicted by the regressions of Fre-
itag 2002 and Adolph 2014 match our data well. Errors from
φop = φ(1 − exp[75(ρ/ρoff − 1)]), (3) those regressions are comparable to the ones obtained with
the tuned CKres and SCK bi,res models (Table 2). The regression
using ρoff = 845 kg m−3 . The open porosity fractions derived of Freitag 2002 performs the best, with MAE and RSME val-
from the open porosity φop from the regression of Schwander
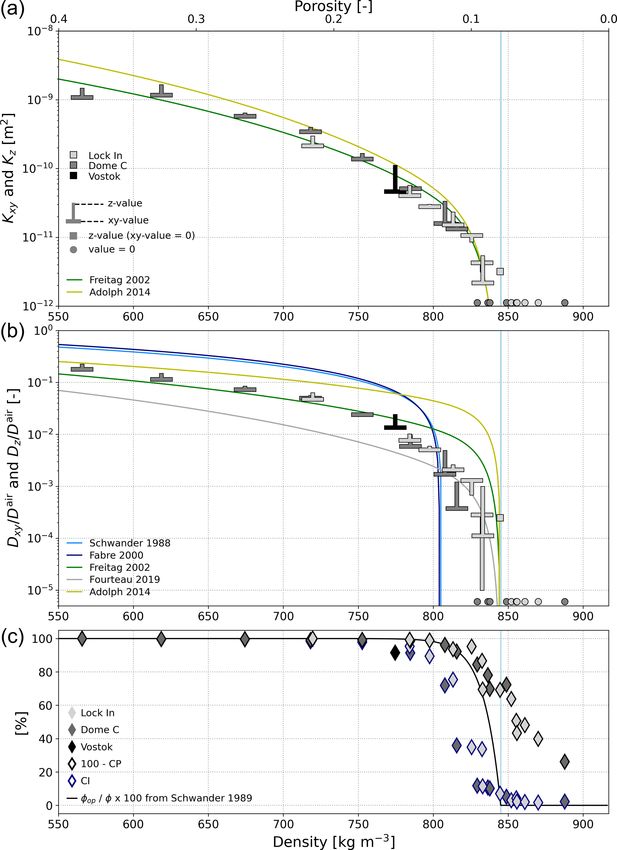
https://doi.org/10.5194/tc-16-967-2022 The Cryosphere, 16, 967–980, 2022976 N. Calonne et al.: Permeability and diffusion of snow to porous ice Figure 5. (a, b) Permeability and normalized diffusion coefficient of firn versus density: computations (“T” symbols) and regressions from the literature (lines). (c) Evolution with density of the open porosity fraction based on the closed-to-total porosity fraction CP and based on the open porosity from Schwander 1989, as well as the connectivity index CI. The vertical blue lines at 845 kg m−3 indicate the close-off density. The Cryosphere, 16, 967–980, 2022 https://doi.org/10.5194/tc-16-967-2022
N. Calonne et al.: Permeability and diffusion of snow to porous ice                                                                    977

Table 2. Correlation of determination R 2 , mean absolute error           sus R 2 = 0.37) in the firn density range. The regression of
MAE, and root mean squared error RMSE values obtained between             Adolph 2014 and Fourteau 2019 reproduce well the general
predicted values from models or regressions and true values, the          trend of the diffusivity–density relationship but overestimate
data being computed from 3D images, for permeability and effec-           and underestimate the data overall, respectively. A very good
tive coefficient of diffusion, obtained when considering all samples      match is however found with the regression of Fourteau 2019
and firn samples only. MAE and RMSE are indicators of the aver-           in the 800–850 kg m−3 density range, in which the prop-
age difference of the modeled values with respect to the true data.       erty drop near the close-off is well reproduced. The good
RMSE has a higher weight for outliers than MAE, which treats all
                                                                          agreement in this density range is consistent with the fact
differences equally. In addition to the average difference between
                                                                          that the regression of Fourteau 2019 was derived from data
modeled and true data, R 2 also indicates how well the model de-
scribes the trend seen in the true data (R 2 values close to 1 indicate   from Lock In, as in this study, for firn with a density above
that average differences between model and truth are small and that       740 kg m−3 .
the true data are equally scattered around the model across the full
range).
                                                                          4   Conclusions
  Name                R 2 [–]     MAE [m2 or –]    RMSE [m2 or –]
                                                                          In this study, we present the effective coefficient of diffusion
  Permeability
                                                                          and permeability at Dome C and Lock In, Antarctica, from
  Over the entire density range                                           near-surface to close-off (23 to 133 m depth). Properties were
  SCK                   0.78       4.60 × 10⁻¹⁰       8.05 × 10⁻¹⁰        computed from high-resolution 3D tomographic images of
    bi,res
  CKres                 0.91       2.74 × 10⁻¹⁰       5.23 ×10⁻¹⁰         firn samples collected in the field. Microstructural parame-
                                                                          ters, including density, specific surface area SSA, correlation
  Over the firn density range
                                                                          length, structural anisotropy, closed-to-total porosity ratio,
  SCKbi,res           −0.34        1.40 × 10⁻¹⁰       3.86 × 10⁻¹⁰        and connectivity index, were also estimated. The normalized
  CKres                0.17        1.08 × 10⁻¹⁰       3.04 × 10⁻¹⁰        diffusion coefficient ranges from 1.9×10⁻¹ to 8.3×10⁻⁵ and
  Freitag 2002         0.87        0.43 × 10⁻¹⁰       1.23 × 10⁻¹⁰        permeability from 1.2 × 10⁻⁹ to 1.1 × 10⁻¹² m2 , decreasing
  Adolph 2014         −0.58        1.22 × 10⁻¹⁰       4.20 × 10⁻¹⁰        with depth. Density varies between 565 and 888 kg m−3 and
  Normalized diffusion coefficient                                        SSA from 2.9 to 0.4 m2 kg−1 , from top to bottom of the firn
                                                                          columns. Between both sites, the relationships of transport
  Over the entire density range
                                                                          properties with depth follows a similar trend but is shifted in
  SCD
    bi,res              0.96         4.3 × 10⁻²         5.1 × 10⁻²        depth. The effective coefficient of diffusion and permeabil-
  Eq. (2)               0.99        1.43 × 10⁻²         2.2 × 10⁻²        ity are systematically slightly higher at Lock In than Dome
  Over the firn density range
                                                                          C for the given depths. They reach zero value below 95 m
                                                                          at Dome C but below 108 m at Lock In. This can be related
  SCDbi,res            0.37          2.7 × 10⁻²         3.5 × 10⁻²        to differences in firn microstructure between both sites (Burr
  Eq. (2)              0.99          0.3 × 10⁻²         0.5 × 10⁻²        et al., 2018): denser and coarser firn is found at Dome C for
  Freitag 2002         0.91          0.7 × 10⁻²         1.3 × 10⁻²        the given depths, the onset of pore closure appears earlier at
  Adolph 2014          0.41          2.6 × 10⁻²         3.4 × 10⁻²        Dome C, and the close-off is reached at 99 m at Dome C and
  Fourteau 2019        0.42          1.4 × 10⁻²         3.3 × 10⁻²
                                                                          108 m at Lock In.
  Schwander 1988      −10.1           12 × 10−2          15 × 10−2
                                                                             The relationship of the transport properties with density
  Fabre 2000          −14.0           14 × 10−2          17 × 10−2
                                                                          was further investigated within the firn density range, as well
                                                                          as in the entire 100–900 kg m−3 range, by including simu-
                                                                          lations on seasonal snow samples. The relationship of per-
ues being about half of the ones shown by the models and                  meability with SSA was also considered by analyzing the
the other regressions for firn. Concerning effective coeffi-              dimensionless permeability, i.e., the permeability divided by
cient of diffusion, regressions of form φop   n reproduce more            the equivalent sphere radius squared. Over the full density
closely the relationships with density compared to regres-                range, transport properties evolve within several orders of
sions of form aφop + b, like the one proposed by Schwan-                  magnitude, covering 10−1 to 10−7 m2 for dimensionless per-
der 1988 and Fabre 2000. These latter regressions overesti-               meability and 10−1 to 10−5 for the normalized diffusion co-
mate largely the data within 550 and 750 kg m−3 (MAE and                  efficient. Little scatter, without variability linked to sites, is
RSME between 12 and 17 × 10−2 ); above, they fail to repro-               reported over the entire density range, highlighting the strong
duce the diffusion coefficient drop at the correct density. Here          dependency of transport properties on density (and SSA for
again, the formula of Freitag 2002 performs best with MAE                 permeability).
and RMSE of 0.7 × 10⁻² and 1.3 × 10⁻² , respectively, per-                   For firn (550–850 kg m−3 ), we report very good agreement
forming closely to our proposed regression (R 2 = 0.91 ver-               with the regression of Freitag et al. (2002) and, in a lesser
sus R 2 = 0.99) and better than the SCD            2
                                          bi,res (R = 0.91 ver-           way, with Adolph and Albert (2014) for both diffusion coeffi-

https://doi.org/10.5194/tc-16-967-2022                                                             The Cryosphere, 16, 967–980, 2022
978 N. Calonne et al.: Permeability and diffusion of snow to porous ice
cient and permeability, although their datasets originate from Acknowledgements. The 3SR lab is part of the Labex Tec 21 (In-
different environments (Greenland versus Antarctica here). vestissements d’Avenir, grant agreement ANR-11-LABX-0030).
In the narrow range of 800 to 850 kg m−3 , near the close- CNRM/CEN and IGE are part of Labex OSUG@2020 (Investisse-
off, the drop of diffusivity with density observed in our data ments d’Avenir, grant ANR-10-LABX-0056). Authors acknowl-
is closely reproduced by the regression from Fourteau 2019 edge the Labex CEMAM (Center of Excellence of Multifunctional
Architectured Materials, “Investments for the Future” program,
that is based on data from Lock In.
grant ANR-10-LABX-44-01) for its contribution to the funding of
Looking at the entire range of density (100–917 kg m−3 ), the X-ray tomography equipment. We also thank the ID19 beamline
permeability is overall well predicted by the Carman– of the ESRF for the acquisition of several tomographic images used
Kozeny and the self-consistent (spherical bi-composite) in this study.
models when modified to account for the pore closure. To
do so, the total porosity φ was simply replaced by a rescaled
porosity φres defined as φres = (φ −φoff )/(1−φoff ), with φoff Review statement. This paper was edited by Jürg Schweizer and re-
the close-off porosity. We specifically choose to account for viewed by Johannes Freitag and Zoe Courville.
pore closure through such a rescaled porosity instead of the
commonly used open porosity. The advantages are that (1)
there is no need of an additional predictive formula, as re-
quired to estimate the open porosity, which limits uncer- References
tainties, and (2) any models developed for porous media
which do not include open porosity can be used by doing Adolph, A. C. and Albert, M. R.: Gas diffusivity and permeability
this simple replacement. For the diffusion coefficient, none through the firn column at Summit, Greenland: measurements
of the evaluated models or regressions provide satisfactory and comparison to microstructural properties, The Cryosphere,
estimates over the entire density range. We thus propose 8, 319–328, https://doi.org/10.5194/tc-8-319-2014, 2014.
a new regression based on the rescaled porosity that reads Albert, M., Shuman, C., Courville, Z., Bauer, R., Fahnestock, M.,
D/D air = (φres )1.61 . and Scambos, T.: Extreme firn metamorphism: impact of decades
Finally, as polar snow in the range 100–550 kg m−3 can of vapor transport on near-surface firn at a low-accumulation
differ significantly from seasonal snow in the same density glazed site on the East Antarctic plateau, Ann. Glaciol., 39, 73–
78, https://doi.org/10.3189/172756404781814041, 2004.
range, it would be interesting to analyze polar snow and firn
Albert, M. R.: Modeling heat, mass, and species transport in polar
between 0 and 25 m depth, thus complementing the present
firn, Ann. Glaciol., 23, 138–143, 1996.
dataset. Further studies should also be undertaken to derive Albert, M. R. and Shultz, E. F.: Snow and firn properties and air-
transport properties at other sites and evaluate the proposed snow transport processes at Summit, Greenland, Atmos. Envi-
regression and models in different environments. ron., 36, 2789–2797, 2002.
Albert, M. R., Shultz, E. F., and Perron, F. E.: Snow and firn per-
meability at Siple Dome, Antarctica, Ann. Glaciol., 31, 353–356,
Data availability. The computed values of effective diffusion co- https://doi.org/10.3189/172756400781820273, 2000.
efficient and permeability are available in the Supplement of the Auriault, J.-L., Boutin, C., and Geindreau, C.: Homogenization of
article, together with the computed microstructural parameters. coupled phenomena in heterogenous media, Wiley-ISTE, Lon-
don, ISBN 978-1-848-21161-2, 2009.
Battle, M., Bender, M. L., Sowers, T., Tans, P. P., Butler, J., Elkins,
Supplement. The supplement related to this article is available on- J., Ellis, J., Conway, T. J., Zhang, N., Lang, P., and Clarke, A.:
line at: https://doi.org/10.5194/tc-16-967-2022-supplement. Atmospheric gas concentrations over the past century measured
in air from firn at the South Pole, Nature, 383, 231–235, 1996.
Bear, J.: Dynamics of Fluids in Porous Media, Dover Publications,
Author contributions. NC wrote the paper with input from AB, CG, Dover, ISBN 0-486-65675-6, 1972.
AP, and FF. Data analysis was performed by NC, AB, CG, and AP. Boutin, C.: Study of permeability by periodic and self consistent
The 3D image simulations were performed by CG. Sample acqui- homogenisation, Eur. J. Mech. A/Solids, 19, 603–632, 2000.
sitions were performed by AP, AB, FF, and NC. CG, AP, and NC Boutin, C. and Geindreau, C.: Periodic homogenization and consis-
directed the project. tent estimates of transport parameters through sphere and poly-
hedron packings in the whole porosity range, Phys. Rev. E, 82,
036313-1–036313-18, 2010.
Buizert, C., Martinerie, P., Petrenko, V. V., Severinghaus, J. P.,
Competing interests. The contact author has declared that neither
Trudinger, C. M., Witrant, E., Rosen, J. L., Orsi, A. J., Ru-
they nor their co-authors have any competing interests.
bino, M., Etheridge, D. M., Steele, L. P., Hogan, C., Laube, J.
C., Sturges, W. T., Levchenko, V. A., Smith, A. M., Levin, I.,
Conway, T. J., Dlugokencky, E. J., Lang, P. M., Kawamura, K.,
Disclaimer. Publisher’s note: Copernicus Publications remains Jenk, T. M., White, J. W. C., Sowers, T., Schwander, J., and
neutral with regard to jurisdictional claims in published maps and Blunier, T.: Gas transport in firn: multiple-tracer characterisation
institutional affiliations. and model intercomparison for NEEM, Northern Greenland, At-
The Cryosphere, 16, 967–980, 2022 https://doi.org/10.5194/tc-16-967-2022N. Calonne et al.: Permeability and diffusion of snow to porous ice 979 mos. Chem. Phys., 12, 4259–4277, https://doi.org/10.5194/acp- ground, IHP-VII Technical Documents in Hydrology n 83, IACS 12-4259-2012, 2012. Contribution n 1, 2009. Burr, A., Ballot, C., Lhuissier, P., Martinerie, P., Martin, C. L., Flin, F., Brzoska, J. B., Lesaffre, B., Coleou, C., and Pieritz, R. A.: and Philip, A.: Pore morphology of polar firn around closure re- Three-dimensional geometric measurements of snow microstruc- vealed by X-ray tomography, The Cryosphere, 12, 2481–2500, tural evolution under isothermal conditions, Ann. Glaciol., 38, https://doi.org/10.5194/tc-12-2481-2018, 2018. 39–44, 2004. Calonne, N., Flin, F., Morin, S., Lesaffre, B., du Roscoat, S. R., and Flin, F., Lesaffre, B., Dufour, A., Gillibert, L., Hasan, A., Rol- Geindreau, C.: Numerical and experimental investigations of the land du Roscoat, S., Cabanes, S., and Pugliese, P.: On the com- effective thermal conductivity of snow, Geophys. Res. Lett., 38, putations of specific surface area and specific grain contact area L23501, https://doi.org/10.1029/2011GL049234, 2011. from snow 3-D images, in: P.C.I., edited by: Furukawa, Y., pp. Calonne, N., Geindreau, C., Flin, F., Morin, S., Lesaffre, B., Rol- 321–328, Hokkaido University Press, Sapporo, JP, proceedings land du Roscoat, S., and Charrier, P.: 3-D image-based numeri- of the 12th International Conference on the Physics and Chem- cal computations of snow permeability: links to specific surface istry of Ice held at Sapporo, Japan on 5–10 September 2010, area, density, and microstructural anisotropy, The Cryosphere, 6, 2011. 939–951, https://doi.org/10.5194/tc-6-939-2012, 2012. Fourteau, K., Martinerie, P., Faïn, X., Schaller, C. F., Tuckwell, R. Calonne, N., Flin, F., Geindreau, C., Lesaffre, B., and Rolland du J., Löwe, H., Arnaud, L., Magand, O., Thomas, E. R., Freitag, Roscoat, S.: Study of a temperature gradient metamorphism of J., Mulvaney, R., Schneebeli, M., and Lipenkov, V. Ya.: Multi- snow from 3-D images: time evolution of microstructures, phys- tracer study of gas trapping in an East Antarctic ice core, The ical properties and their associated anisotropy, The Cryosphere, Cryosphere, 13, 3383–3403, https://doi.org/10.5194/tc-13-3383- 8, 2255–2274, https://doi.org/10.5194/tc-8-2255-2014, 2014a. 2019, 2019. Calonne, N., Geindreau, C., and Flin, F.: Macroscopic Mod- Freitag, J., Dobrindt, U., and Kipfstuhl, J.: A new method for eling for Heat and Water Vapor Transfer in Dry Snow predicting transport properties of polar firn with respect to by Homogenization, J. Phys. Chem. B, 118, 13393–13403, gases on the pore-space scale, Ann. Glaciol., 35, 538–544, https://doi.org/10.1021/jp5052535, 2014b. https://doi.org/10.3189/172756402781816582, 2002. Calonne, N., Flin, F., Lesaffre, B., Dufour, A., Roulle, J., Puglièse, Gautier, E., Savarino, J., Erbland, J., Lanciki, A., and Possenti, P.: P., Philip, A., Lahoucine, F., Geindreau, C., Panel, J.-M., and du Variability of sulfate signal in ice core records based on five repli- Roscoat, S.: CellDyM: A room temperature operating cryogenic cate cores, Clim. Past, 12, 103–113, https://doi.org/10.5194/cp- cell for the dynamic monitoring of snow metamorphism by time- 12-103-2016, 2016. lapse X-ray microtomography, Geophys. Res. Lett., 42, 3911– Goujon, C., Barnola, J.-M., and Ritz, C.: Modeling the densifica- 3918, https://doi.org/10.1002/2015gl063541, 2015. tion of polar firn including heat diffusion: Application to close- Calonne, N., Milliancourt, L., Burr, A., Philip, A., Martin, C. L., off characteristics and gas isotopic fractionation for Antarc- Flin, F., and Geindreau, C.: Thermal Conductivity of Snow, Firn, tica and Greenland sites, J. Geophys. Res.-Atmos., 108, 4792, and Porous Ice From 3-D Image-Based Computations, Geophys. https://doi.org/10.1029/2002JD003319, 2003. Res. Lett., 46, 13079–13089, 2019. Grenfell, T. and Warren, S.: Representation of a nonspherical ice Colbeck, S. C.: Air movement in snow due to windpumping, J. particle by a collection of independent spheres for scattering and Glaciol., 35, 209–213, 1989. absorption of radiation, J. Geophys. Res., 104, 31697–31709, Coléou, C. and Barnola, J.-M.: 3-D snow and ice images by X-ray https://doi.org/10.1029/2000JC000414, 1999. microtomography, ESRF Newsletter, 35, 24–26, 2001. Hörhold, M.: Microstructure and air transport properties of polar Coléou, C., Lesaffre, B., Brzoska, J.-B., Ludwig, W., firn, Ph.D. thesis, MS thesis, University of Bremen, 2006. and Boller, E.: Three-dimensional snow images by Hörhold, M. W., Albert, M. R., and Freitag, J.: The impact of X-ray microtomography, Ann. Glaciol., 32, 75–81, accumulation rate on anisotropy and air permeability of po- https://doi.org/10.3189/172756401781819418, 2001. lar firn at a high-accumulation site, J. Glaciol., 55, 625–630, Courville, Z., Albert, M., Fahnestock, M., Cathles, L., and Shuman, https://doi.org/10.3189/002214309789471021, 2009. C.: Impacts of an accumulation hiatus on the physical proper- Kanit, T., Forest, S., Galliet, I., Mounoury, V., and Jeulin, ties of firn at a low-accumulation polar site, J. Geophys. Res.- D.: Determination of the size of the representative ele- Ea. Surf., 112, F02030, https://doi.org/10.1029/2005JF000429, mentary volume element for random composites: statistical 2007. and numerical approach, Int. J. Sol. Struct., 40, 3647–3679, Courville, Z., Hörhold, M., Hopkins, M., and Albert, https://doi.org/10.1016/S0020-7683(03)00143-4, 2003. M.: Lattice-Boltzmann modeling of the air permeabil- Kaspers, K. A., van de Wal, R. S. W., van den Broeke, M. ity of polar firn, J. Geophys. Res.-Ea. Surf., 115, 1–11, R., Schwander, J., van Lipzig, N. P. M., and Brenninkmei- https://doi.org/10.1029/2009JF001549, 2010. jer, C. A. M.: Model calculations of the age of firn air across Fabre, A., Barnola, J. M., Arnaud, L., and Chappellaz, J.: Deter- the Antarctic continent, Atmos. Chem. Phys., 4, 1365–1380, mination of gas diffusivity in polar firn: Comparison between https://doi.org/10.5194/acp-4-1365-2004, 2004. experimental measurements and inverse modeling, Geophys. Kawamura, K., Severinghaus, J. P., Ishidoya, S., Sug- Res. Lett., 27, 557–560, https://doi.org/10.1029/1999GL010780, awara, S., Hashida, G., Motoyama, H., Fujii, Y., Aoki, 2000. S., and Nakazawa, T.: Convective mixing of air in firn Fierz, C., Armstrong, R. L., Durand, Y., Etchevers, P., Greene, E., at four polar sites, Earth Planet. Sc. Lett., 244, 672–682, McClung, D. M., Nishimura, K., Satyawali, P. K., and Sokratov, https://doi.org/10.1016/j.epsl.2006.02.017, 2006. S. A.: The international classification for seasonal snow on the https://doi.org/10.5194/tc-16-967-2022 The Cryosphere, 16, 967–980, 2022
You can also read