Effect of Using Aluminum Sulfate (Alum) as a Surface Amendment in Beef Cattle Feedlots on Ammonia and Sulfide Emissions - MDPI
←
→
Page content transcription
If your browser does not render page correctly, please read the page content below
sustainability

Article
Effect of Using Aluminum Sulfate (Alum) as a Surface
Amendment in Beef Cattle Feedlots on Ammonia and
Sulfide Emissions
Mindy J. Spiehs * and Bryan Woodbury

                                          USDA Meat Animal Research Center, Clay Center, NE 68933, USA; bryan.woodbury@usda.gov
                                          * Correspondence: mindy.spiehs@usda.gov; Tel.: +1-402-762-4271

                                          Abstract: The objective of this study was to measure NH3 from feedlot surface material (FSM)
                                          containing aluminum sulfate (alum). A 33-day lab-scale study was conducted using pans containing
                                          FSM and either 0, 2.5, 5, or 10% alum. The pH of the FSM was significantly lower (p < 0.01) when
                                          treated with 2.5, 5, and 10% alum as opposed to the 0% alum treatment. No NH3 volatilization
                                          occurred below a pH of 6.5. A second study determined that small, weekly doses of 5% alum did
                                          not lower NH3 emissions further than a single dose of 5% alum. Two studies on the feedlot surface
                                          demonstrated a significant decrease (p < 0.01) in pH in the areas of the pens where alum was added
                                          compared to those that did not receive alum. Ammonia concentrations were lower (p < 0.05) for the
                                          areas that received alum compared to those that did not receive alum for 7 days when 5% alum was
                                          applied and 14 days when 10% alum was applied. In all the studies, sulfide emissions increased
                                          when alum was added to the FSM. We concluded 10% alum may reduce NH3 emissions from beef
                                          feedlots temporarily, but higher sulfide emissions offset this benefit.

                                Keywords: alum; aluminum sulfate; ammonia; beef; feedlot surface; hydrogen sulfide; sulfides;
                                   nutrients; manure
Citation: Spiehs, M.J.; Woodbury, B.
Effect of Using Aluminum Sulfate
(Alum) as a Surface Amendment in
Beef Cattle Feedlots on Ammonia           1. Introduction
and Sulfide Emissions. Sustainability
                                               Concentrated animal feeding operations (CAFOs) are intensely managed production
2022, 14, 1984. https://doi.org/
                                          systems to improve efficiency and allow for better care of the animals. This concentration
10.3390/su14041984
                                          can also have a deleterious impact on the environment. Cattle feedlot pen surfaces are
Academic Editor: Antonio Zuorro           especially problematic because the cattle manure is directly exposed to the environmental
                                          elements of rain, snow, sun, and wind. Feedlot surface material (FSM) is unlike any
Received: 30 December 2021
Accepted: 7 February 2022
                                          agricultural soil, consisting of a complex soil and manure mixture. Chemical, physical,
Published: 10 February 2022
                                          and biological reactions that result in the release of a variety of compounds occur on the
                                          feedlot surface. Some reactions occur independently of one another, others are correlated.
Publisher’s Note: MDPI stays neutral      Typical airborne pollutants from CAFOs are comprised of particulate matter, biological
with regard to jurisdictional claims in
                                          materials, and chemicals including carbon dioxide (CO2 ), methane (CH4 ), nitrous oxide
published maps and institutional affil-
                                          (N2 O), ammonia (NH3 ), hydrogen sulfide (H2 S) and other sulfides, alcohols, amides,
iations.
                                          aromatics, and volatile fatty acids [1–6]. Because of the complex reactions that occur on
                                          the feedlot surface, when the conditions change to prohibit the release of one gas, it can
                                          create an opportunistic environment for the production of a second gas, which further
Copyright: © 2022 by the authors.
                                          complicates the ability of producers to manage emissions from the feedlot surface.
Licensee MDPI, Basel, Switzerland.
                                               Sulfide compounds are one emission of concern from feedlot operations. Hydrogen
This article is an open access article    sulfide is a colorless gas that has a characteristic rotten egg smell. It is formed during
distributed under the terms and           bacterial decomposition of human and animal waste and is present in emissions from
conditions of the Creative Commons        sewage treatment facilities and landfills. Hydrogen sulfide can be detected at very low
Attribution (CC BY) license (https://     concentrations (0.5–30 ppbv) and can begin to cause irritation to the lungs and nose at
creativecommons.org/licenses/by/          25 ppmv [7]. Comparatively, other common odorants from livestock facilities such as NH3 ,
4.0/).                                    phenol, and indole have odor detection thresholds of 5–53 ppm [8], 5900 ppb [9], and

Sustainability 2022, 14, 1984. https://doi.org/10.3390/su14041984                                 https://www.mdpi.com/journal/sustainability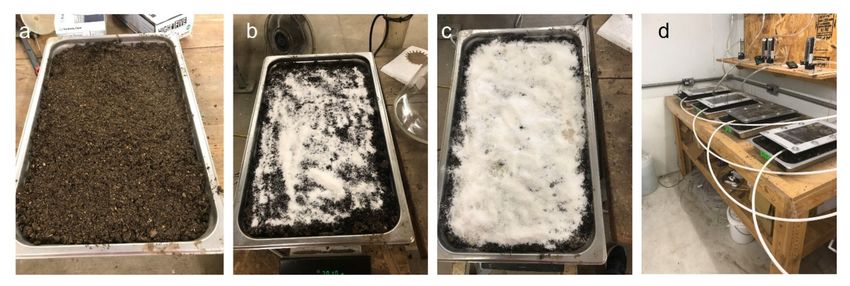
Sustainability 2022, 14, 1984                                                                                          2 of 20

                                140 ppb [10], respectively. Five states in the United States, including Iowa, Minnesota,
                                Nebraska, Rhode Island, and Texas, have ambient air quality standards for H2 S emissions
                                from CAFOs [7]. Additionally, H2 S emissions from CAFOs are reportable to the USEPA
                                when emissions exceed 45 kg (100 lbs) per day according to the Emergency Planning and
                                Community Right-to-Know Act (EPCRA) guidelines. Over 168 compounds that contribute
                                to odor nuisance from livestock facilities have been identified [11]. Of the 10 compounds
                                with the lowest odor detection thresholds, 60% contained sulfur. Dimethyl disulfide
                                (DMDS) and dimethyltrisulfide (DMTS) are products of the metabolism of sulfur-containing
                                amino acids (methionine and cysteine) by Megasphaera anaerobic bacteria [1] and are two
                                common odor-causing sulfide compounds from livestock manure. The odor threshold for
                                DMDS is 0.16–12 ppb [12,13], while DMTS has an odor threshold of 0.005–0.01 ppb [14,15].
                                These air quality standards and potential nuisance issues prompt the need for mitigation of
                                H2 S and other sulfides from livestock facilities.
                                      Ammonia emissions are commonly associated with livestock production. Utilization
                                of nitrogen (N) in cattle feed is inefficient, with only 10–30% of N consumed by cattle
                                being utilized by the animal for growth, reproduction, milk production, and maintenance
                                needs [16]. Consequently, the remaining 70–90% of consumed N is excreted in the urine
                                and feces of the animal. The nutrients in livestock manure can be a valuable fertilizer for
                                agricultural crops. Unfortunately, N losses as NH3 can be quite high from beef cattle feed-
                                lots. Upwards to 97% of urinary N is excreted as urea [17,18], which is rapidly converted to
                                NH3 [19] in a pH- and temperature-dependent reaction, with greater volatilization during
                                the summer months compared to the winter months. Research has demonstrated that
                                51–73% N on the cattle feedlot surface can be lost as NH3 during the summer [20–23],
                                and 35–50% N is lost during winter months [20–23]. A pH of 7 to 10 is ideal for NH3
                                volatilization [24], whereas a pH ≤ 6.5 will result in little NH3 volatilization [25]. There-
                                fore, lowering the pH of the beef feedlot surface may reduce N volatilization and increase
                                the fertilizer value of the manure which would be especially beneficial during the warm
                                summer months.
                                      Several strategies to reduce NH3 , sulfides, and other odorous emissions from beef
                                feedlot facilities, including the use of pen surface amendments, have been investigated. One
                                pen surface amendment is urease inhibitors. Urease is an enzyme that converts urea to NH3 .
                                When this reaction is inhibited, NH3 emissions are reduced. When applied to FSM at a rate
                                of 1–2 kg ha−1 , NH3 emissions were 34.4–35.9% of the emissions of untreated FSM [26].
                                Other studies found that a urease inhibitor, combined with the plant essential oil thymol,
                                retained 5.2 g of an initial 9.2 g of urea compared to only 1 g retained when the urease
                                inhibitor was used alone [27], indicating less NH3 loss when the two products were used
                                in combination. Another study examined the addition of corn oil, alum, urease inhibitors,
                                alum, and potassium zeolite as surface amendments to lab-scale feedlot surfaces [28]. The
                                addition of zeolite and fat decreased NH3 losses by 51 to 86% compared to no treatment.
                                      The poultry industry has been successfully using aluminum sulfate (alum) to lower
                                NH3 emissions for the past decade. Alum is applied at a rate of 5–10% of the weight of the
                                litter and lowers the pH of the litter to bind N in the ammonium (NH4 ) form and prevent
                                volatilization. Ammonia fluxes from alum-treated litter are 70% lower than untreated
                                litter [29,30]. The litter treated with alum has higher N content and a lower soluble
                                phosphorus (P) content, which results in less P leaching when alum-treated litter is land
                                applied [31]. In a seven-year study, P losses in runoff were 340% less when alum-amended
                                litter was land applied to fescue than when untreated poultry litter was land applied [31],
                                with no effect on P uptake by the fescue. When alum-treated poultry litter was land applied
                                to corn fields in Virginia, little to no reduction in corn yields were detected, while 61–71%
                                less dissolved reactive P was recovered from runoff from fields that received alum-treated
                                poultry litter compared to conventional poultry litter [32], indicating that the alum-treated
                                litter was safe to use as a fertilizer. However, one concern with alum addition to livestock
                                manure is the addition of sulfur to the system. Previous research has demonstrated that the
                                addition of 10% alum to lab-scaled cattle bedpacks containing corn stover bedding lowered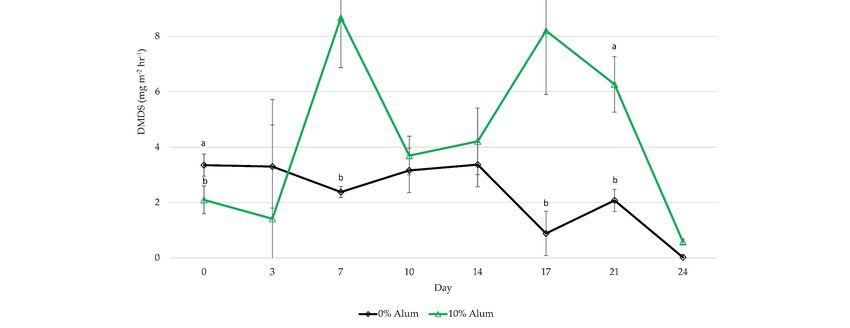
Sustainability 2022, 14, 1984 3 of 20
NH3 emission for up to 7 weeks but increased H2 S emission [33]. We hypothesized that
adding alum to beef FSM would lower the NH3 emission and increase the N content in the
manure but might also increase sulfide emissions from the FSM. Therefore, the objective of
this study was to determine the effect of adding alum to feedlot surface material on NH3
and sulfide emissions.
2. Materials and Methods
Four studies were conducted to evaluate the use of alum as a feedlot surface amend-
ment. The first two were conducted in a laboratory setting. The third and fourth were
conducted on the feedlot surface of a pen that was recently vacated.
2.1. Lab-Scale Studies
The first lab-scale study was a titration study with four alum treatments evaluated:
0, 2.5, 5, and 10% alum (g g−1 ) based on the mass of the FSM. Using methodology from
previous studies in our lab [34,35], FSM was collected from three adjacent beef feedlot pens
at the U.S. Meat Animal Research Center (USMARC) feedlot. Each pen was 30 m × 90 m
and contained a central mound constructed from manure and soil and a 3 m concrete
apron located behind each feed bunk. One week prior to FSM collection, the livestock
had been removed from the pen. Before that, approximately 80 steers were housed in
each pen. The steers entered the pens at approximately 375 kg and were marketed at
approximately 580 kg, after being in the pen for 120 days. The FSM from the pens was
scraped into a pile in each pen using a skid-steer front-end loader to skim across the top
15 cm (6”) of soil. From each pen, a 227 L (50 gallon) drum was filled with FSM and
brought back to an enclosed garage, where plastic tarps were placed on the floor. All three
drums were emptied onto the plastic tarps and thoroughly mixed using a shovel. The FSM
was allowed to air-dry for three weeks before being ground in a portable woodchipper to
ensure uniform mixture of the FSM. The resulting mixture served as the base FSM for the
experiment. Nutrient composition of the initial FSM for the first and second experiments
are found on Tables 1 and 2, respectively. The authors recognize that air-drying and mixing
the manure in the woodchipper may have volatilized some initial NH3 from the FSM.
However, this method allowed for the uniform dry-matter content of all pans, and large
clots of FSM were not included in any pan, allowing all pans to have approximately the
same chemical and physical characteristics at the start of the experiment. Once mixed, the
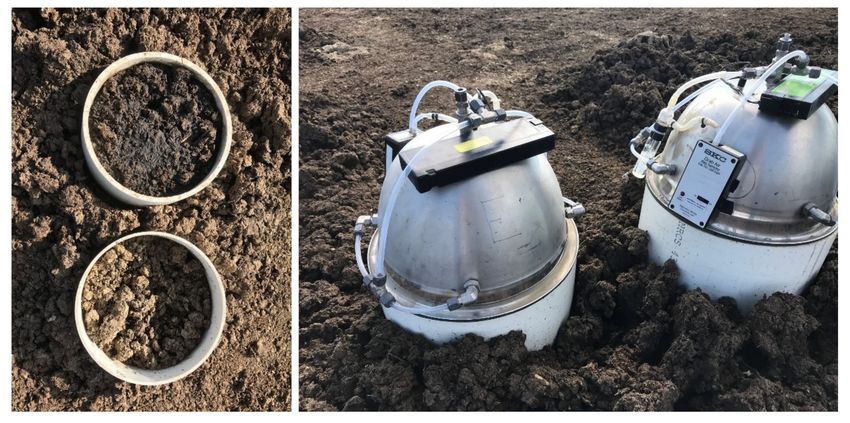
FSM was added to stainless steel cafeteria-style pans (50 cm × 30 cm × 6.5 cm: Figure 1a–c).
There were six pans per treatment for a total of 24 pans. In each pan, 3 kg of FMS and
3 kg of water were added. Alum treatments were added in each pan, with the 2.5% alum
treatment receiving 150 g of alum, the 5% alum receiving 300 g of alum, and the 10% alum
treatment receiving 600 g of alum. The surface of the material was lightly raked using a
garden weasel to simulate hoof traffic on the feedlot surface of a cattle pen. The total mass
of each pan was recorded, and the pans were placed in an environmental chamber that
was maintained at 30 ◦ C and 60–65% humidity. Daily, the mass of the pans was recorded
to determine how much water had evaporated. Water was added back to each pan to
maintain the original pan mass which allowed for a uniform moisture content among all
24 pans of FSM [34,35]. Constant water content was maintained to represent an extended
wet period that often occurs on feedlot pen surfaces [34,35]. On sampling days water was
added to the pan 30 min prior to sampling.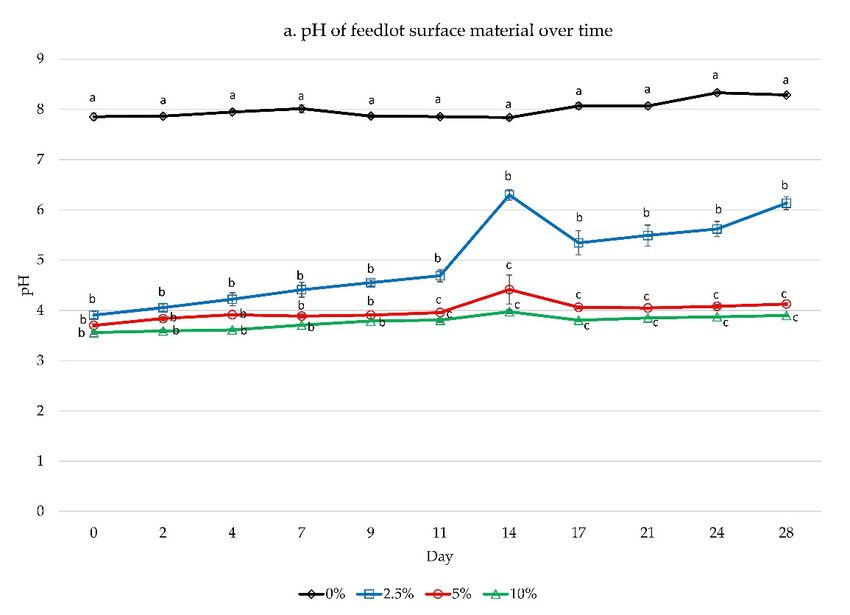
Sustainability 2022, 14, 1984                                                                                                                  4 of 20

                                  Table 1. Comparison of the nutrient composition of feedlot surface material (FSM) treated with
                                  aluminum sulfate (alum) and FSM prior to alum treatment.

                                 Original
           Nutrient                                  0% Alum             2.5% Alum            5% Alum              10% Alum            p-Value
                                  FSM
      Dry matter, %             88.4 ± 0.9 a        41.3 ± 0.4 c        40.8 ± 0.5 c         42.3 ± 1.0 bc        44.0 ± 0.7 b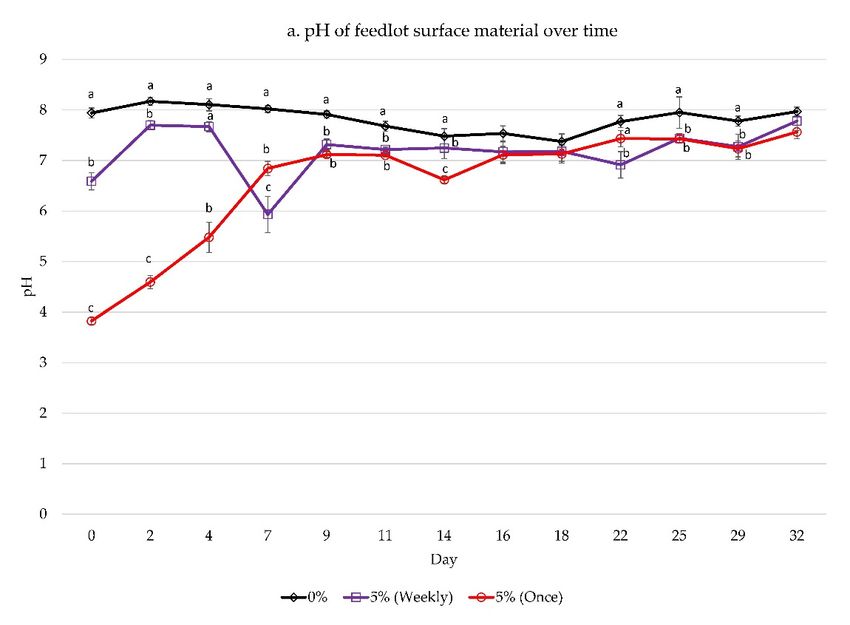
Sustainability 2022, 14, 1984                                                                                          5 of 20

                                the sampling periods. After the background samples were collected, four pans were moved
                                to the table in the environmental chamber, and a wind tunnel was placed on top of each
                                pan (n = 4; Figure 1d). While on the pans, the wind tunnel provided 1 L min−1 of air, and
                                samples were collected from each pan for 18 min. The first 8 min of sampling were used to
                                achieve a steady-state, and the last 10 min were used for the data analysis. Air samples
                                were analyzed directly from the wind tunnels. Inert tubing from the wind tunnel was
                                attached to the gas sampling manifold which fed into the air sampling equipment. The gas
                                sampling system was controlled by a 24-volt TECO Programmable Logic Relay (Model
                                SG2-02OVR-D) which signaled multi-positional 3-way solenoids to open and close one of
                                four air inlet lines on the gas sampling manifold. One line was opened at a time to allow
                                for individual air sampling from each bedded pack. After completion of sampling for the
                                first four pans, four more pans were placed on the table and the wind tunnels were placed
                                on top of the pans. Pan rotation continued until all pans had been measured. Air sampling
                                for H2 S used a Thermo Fisher 450i Hydrogen Sulfide/Sulfur Dioxide/Combined Sulfur
                                Pulsed Fluorence gas analyzer (Thermo Fisher Scientist, Waltham, MA, USA). A Thermo
                                Fisher 17i Ammonia Chemiluminescent gas analyzer was used to measure NH3 (Thermo
                                Fisher Scientist, Waltham, MA, USA).
                                      A small sample of FSM (5–10 g) was collected from the top 2 cm of the FSM from
                                each pan at each sampling date using a stainless steel microspatula with a mark on it to
                                indicate 2 cm. At the conclusion of the study, a sample was also collected from the bottom
                                2 cm of the pan to analyze pH below the surface. The pH was determined by mixing the
                                FSM in a 2:1 ratio with distilled, deionized water and measuring using an IQ150 pH meter
                                (Spectrum Technologies, Inc, Plainfield, IL, USA) calibrated with buffers at pH 4, 7, and 10.
                                At the beginning and end of the study, samples of the FSM were collected and analyzed
                                for total N [37], organic-N [37], nitrate-N [37], ammonium N [37], total P [38], and total
                                sulfur [38]. Samples were sent to a commercial laboratory (Ward Laboratories, Kearney,
                                NE, USA) for analysis.
                                      Based on the results of the first lab-scale study, it was determined that 5% alum may
                                be an ideal application rate for FSM. The second lab-scale study evaluated the frequency of
                                application of the alum. Three treatments were evaluated: 0% alum and 5% alum applied
                                as either a whole treatment on day 0 (5%—once) or 20% of the total alum volume (60 g)
                                applied on days 0, 7, 14, 21, and 28 (5%—weekly). The 5%-once treated pans received 300 g
                                of alum on day 0. As with the previous study, alum application was based on the mass of
                                the FSM in the pans. The pans were constructed and maintained in the same manner as
                                in the other lab-scale study. There were five experimental units per treatment. Sampling
                                occurred on days 0, 2, 4, 7, 9, 11, 14, 16, 18, 22, 25, 29, and 32 and was conducted in the
                                same way as the first lab-scale study.

                                2.2. Field-Scale Studies
                                     The third and fourth studies were conducted on the feedlot surface. Six feedlot pens at
                                the USMARC were utilized for each study. The third study used pens that had 20 animals
                                per pen, and the fourth study used pens that had 30 animals per pen. Both types of pens
                                had a central mound constructed on manure and soil and 3 m concrete apron by the feed
                                bunk. Both set of pens had contained steers fed a corn-silage diet over a six-month period.
                                One day before the study started, the cattle were removed. Three random locations in
                                each pen were analyzed. Each location had a paired treatment with one area receiving
                                alum and the other not receiving any alum application. In the first field-scale study, the
                                treatments consisted of 0% alum (n = 18) and 5% alum (n = 18). In the second field-scale
                                study the treatments were 0% alum (n = 18) and 10% alum (n = 18). The amount of alum
                                added to the area was determined on a mass basis for a depth of 5 cm of FSM using the
                                estimated density of feedlot surface material for Nebraska feedlots (1.5 g cm−3 ) [39], which
                                was within the range of other published data [40]. At each treatment location, a circular
                                anchor made from PVC that was 30.48 cm in diameter was inserted into the ground [41]
                                (Figure 2). This anchor was used for the air sampling equipment, and the pH was collected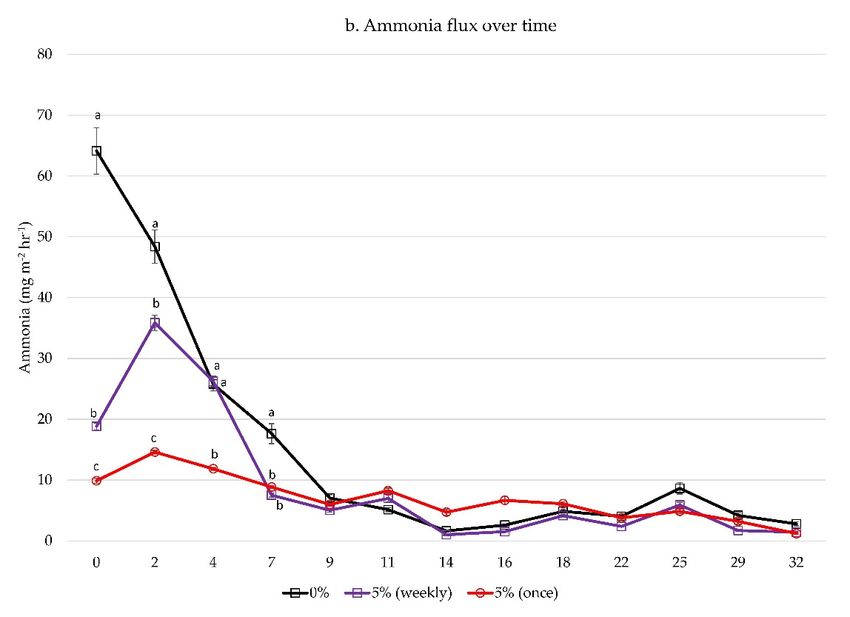
Sustainability 2022, 14, 1984                                                                                                    6 of 20

                                from inside the anchor area. Samples were collected on days 0, 3, 7, 10, 14, 17, 21, and 24.
                                Temperature and moisture content of each sampling location was recorded at the time of
                                data collection.

                                Figure 2. On the left are side-by-side paired test locations on the feedlot surface with PVC anchors. On
                                the right are the stainless steel flux chambers equipped with the acid traps to measure NH3 emission.

                                      Approximately 18–20 h prior to gas sampling, 1 L of water was added to the soil
                                inside the PVC anchors at each treatment location to determine emissions in a prolonged
                                wet period, which often happens to areas of feedlot pens. Ammonia flux was determined
                                by collecting air samples from the pen surface using stainless steel hemispherical flux
                                chambers [42,43] with acid traps containing 0.5N sulfuric acid. The chamber head volumes
                                were recycled through the acid traps for 20 min [43]. The NH3 content in the acid traps
                                was analyzed using a modification of the Sigma urea N kit (Procedure No. 640, Sigma-
                                Aldrich Chemicals, St. Louis, MO, USA). Five microliters of each standard and sample were
                                transferred to a well in a 96-well microtiter plate. This was followed by additions of 50 µL
                                phenol nitroprusside, 50 µL alkaline hypochlorite, and 250 µL distilled water. Color was
                                allowed to develop for 20 min at room temperature. Absorbance at 620 nm was measured
                                using a Bio-Tek Ceres UV900C microplate reader. The concentration of each 96-well plate
                                was determined from a standard curve run with the plate. The coefficient of variation of
                                each duplicate sample in the plate was less than 3%. At each sampling location, 5–10 g of
                                soil was collected in 50 mL plastic conical containers and diluted 2:1 with distilled water
                                to determine the pH of the soil using an IQ150 pH meter (Spectrum Technologies, Inc,
                                Plainfield, IL, USA), calibrated with buffers 4, 7, and 10.
                                      To determine sulfur emissions from the feedlot surface, VOC sample collection was
                                completed using stainless steel sorbent tubes connected to an inlet port on the stainless
                                steel hemispherical flux chamber using flexible plastic tubing. The preconditioned stainless
                                steel sorbent tubes (89 mm × 6.4 mm OD) were filled with Tenax TA sorbent (Markes
                                International, Inc., Wilmington, DE, USA) and brass polytetrafluorethylene (PTFE) ferrules
                                storage caps [44]. Headspace air sample was pulled through the sorbent tubes at a flow
                                rate of 75 mL min−1 for 20 min for a sample volume of 1.5 L using a vacuum pump (Pocket
                                Pump 210 Series, SKC Inc., Eighty Four, PA, USA) [44,45]. Sorbent tubes were analyzed for
                                dimethyl disulfide (DMDS), and dimethyl trisulfide (DMTS) using a thermal desorption-gas
                                chromatography-mass spectrometry system [45,46]. The TD system was a Markes Unity
                                2 (Markes International Inc., Wilmington, DE, USA) with autosampler (Ultra 2, Markes
                                International, Inc., Wilmington, DE, USA) coupled to an Agilent GCMS (7890A/5975C,
                                Agilent Technologies, Inc., Santa Clara, CA, USA) [46]. Samples of the FSM were collected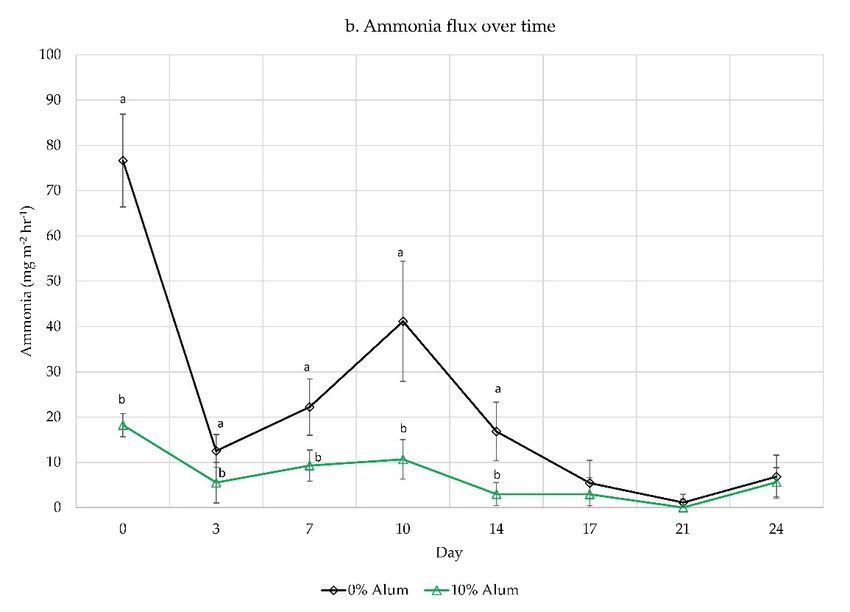
Sustainability 2022, 14, 1984                                                                                             7 of 20

                                before application of the treatments and at the end of each study. Unfortunately, the
                                samples collected from the first field-scale study were compromised during storage prior
                                to analysis. Samples were sent to a commercial laboratory (Ward Laboratories, Kearney,
                                NE, USA) and analyzed for analyzed for total N, organic-N, nitrate-N, ammonium N, and
                                total sulfur [37,38].

                                2.3. Statistical Analysis
                                     Data in the first study were analyzed as a completely randomized design with repeated
                                measures using the MIXED Procedure of SAS [47]. The model included the effects of alum
                                concentration, time, and the interaction. The experimental unit was the pan. The second
                                lab-scale study was analyzed as a completely randomized design with repeated measures
                                using the MIXED Procedure of SAS. The model included the effects of treatment, time,
                                and the interaction. The field-scale studies were analyzed as randomized compete block
                                designs with repeated measures using the MIXED procedure of SAS. The model included
                                the effect of block (pen), alum concentration, time, and the interactions. The area inside the
                                PVC ring was the experimental unit. Covariate structure was modeled to get the lowest
                                Akaike information criteria (AIC) value. Several structures were tested, and the compound
                                symmetry covariate structure provided the lowest AIC value. When significant differences
                                were detected, Fisher’s least significant difference tests were used to determine significant
                                differences among treatments. All differences were considered significant at p < 0.05.

                                3. Results
                                3.1. Titration Study
                                      The pH of the common FSM that was used in all pans was 8.3. Immediately after
                                adding the alum, there was a significant reduction in pH for all FSM with alum compared
                                to the control pans that did not have any alum applied (Figure 3a). The pH of the FSM
                                in the pan with no alum remained higher than all FSM treated with alum throughout the
                                study. Starting on day 9, the FSM that received 2.5% alum had a significantly higher pH
                                than the FSM that was treated with 5 or 10% alum. The pH of the FSM treated with 5 or
                                10% alum did not differ from one another throughout the entire study. Average pH for
                                each treatment for the entire 28-day study was 8.05, 5.28, 4.38, and 4.18 for the 0, 2.5, 5, and
                                10% alum treatments, respectively. Other researchers [26] were also able to successfully
                                lower the pH of cattle FSM in a lab-scale situation for up to 21 days when alum was added
                                at a rate of 4500 kg ha−1 or 9000 kg ha−1 . Average pH for the 21-day study was 5.98 and
                                4.20, respectively for the 4500 and 9000 kg ha−1 treatments. Conversely, when alum was
                                added to lab-scale cattle bedded manure packs, an addition of 5% alum was only able to
                                significantly lower the pH compared to untreated cattle bedded manure packs for seven
                                days, while a 10% addition of alum successfully lowered pH for 14 days [33]. This may
                                be due to differences in organic matter, dry-matter, or buffering capacity of the different
                                substances that were treated with the alum.
                                      Interestingly, when pH measurements were taken from the bottom 2 cm of the stainless
                                steel pans, the pH measurements were significantly higher than on the top 2 cm of the FSM
                                (Table 1). Even with daily water additions and slight raking of the FSM each day, the alum
                                did not penetrate much beyond the surface layer. Cattle walking on the surface of a feedlot
                                may incorporate the alum deeper into the soil profile, creating a different result if animals
                                were present.
                                      Due to the low pH in the FSM that was treated with alum, NH3 flux was significantly
                                lower when 2.5, 5, or 10% alum was added compared to the feedlot surface material that
                                contained no alum (Figure 3b). There was a significantly higher concentration of NH3 at
                                days 0, 2, and 4 for the FSM without alum compared to those treated with alum. However,
                                as no new N sources were being added to the FSM, the available N in the FSM was quickly
                                depleted by the microbes, resulting in essentially no NH3 emissions after day 7 of the study.
                                Similar to this study, previous research has demonstrated virtually no NH3 emissions for
                                up to 21 days when alum was applied to beef FSM [26].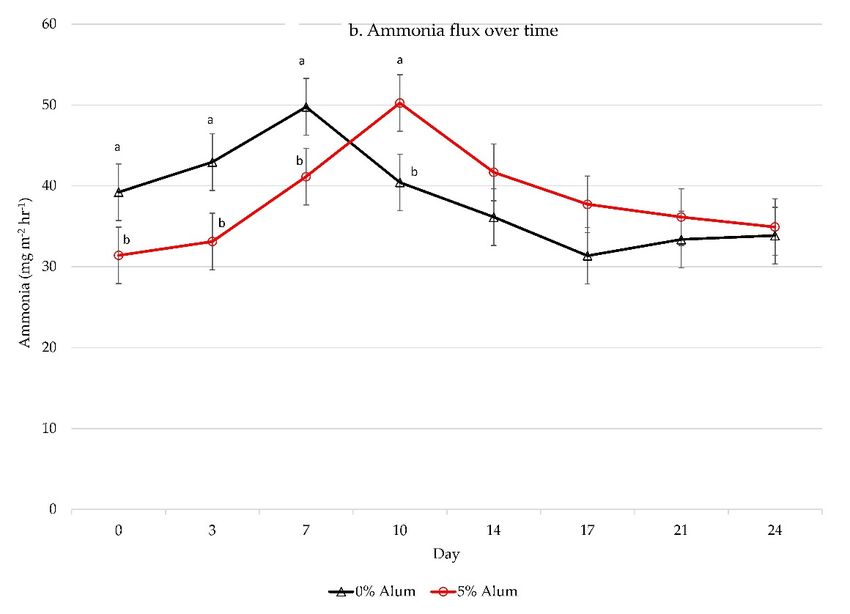
Sustainability 2022, 14, x FOR PEER REVIEW             8 o
Sustainability 2022, 14, 1984                                 8 of 20

                                    Figure 3. Cont.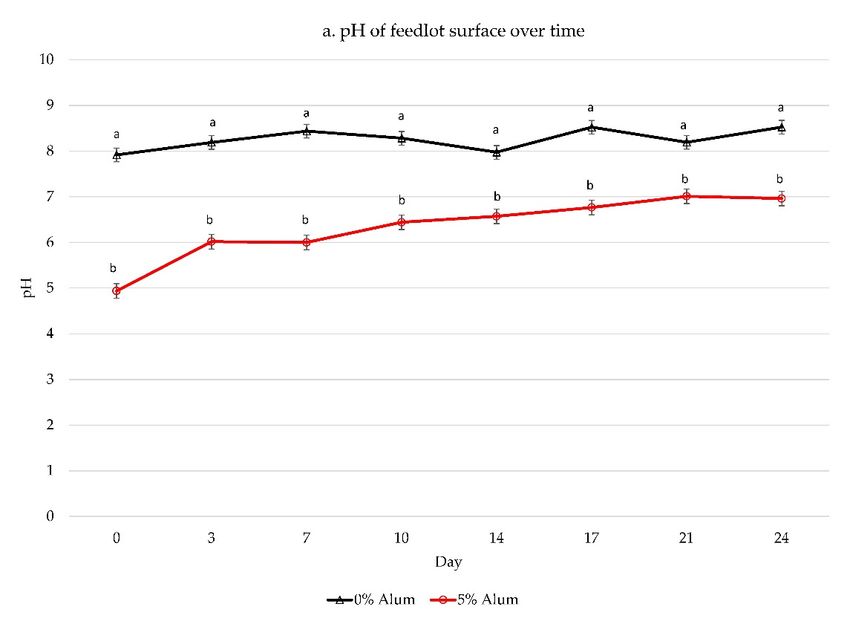
Sustainability 2022, 14, 1984 9 of 20
Figure 3. (a) The pH of feedlot surface material (FSM) in lab-scaled stainless steel pans treated with
0% (g g−1 ) aluminum sulfate (alum) had significantly higher pH than FSM treated with 2.5, 5, or
10% alum (b) Ammonia flux (mg m−2 hr−1 ) of feedlot surface material (FSM) treated 2.5, 5, and 10%
aluminum sulfate (alum) was lower than NH3 flux from untreated FSM. (c) Hydrogen sulfide (H2 S)
flux (mg m−2 hr−1 ) was greater for the untreated feedlot surface material (FSM) and FSM treated
with 10% alum on3.day
Figure (a) 1.
TheOn pHdays 2 and 4,
of feedlot FSM treated
surface materialwith(FSM)10%in alum had significantly
lab-scaled stainless steelgreater
pans treated wi
H2 S flux than
0% (g g ) aluminum sulfate (alum) had significantly higher pH than indicate
FSM −1with any other treatment. For all graphs, different letters significant
FSM treated with 2.5, 5, or 10
differences (p < 0.05)
alum (b) between
Ammonia theflux
treatments
(mg m−2athr the
−1) time point. surface material (FSM) treated 2.5, 5, and 10
of feedlot
aluminum sulfate (alum) was lower than NH3 flux from untreated FSM. (c) Hydrogen sulfide (H2
Overall
fluxaverage
(mg m−2 H hr2−1S) was
fluxgreater
was significantly
for the untreated greater forsurface
feedlot FSM treated
materialwith
(FSM)10%and alum
FSM treated wi
m−2alum
(274.3 mg 10% hr−1on ) compared
day 1. On days to FSM2 andtreated
4, FSMwith 0, 2.5,
treated withor10%5%alum
alum had(179.4, 150.2, greater
significantly and H2S flu
163.0 mg m −2 FSM
than hr−1 ,with
respectively). Hydrogen
any other treatment. For sulfide flux
all graphs, was different
different for thesignificant
letters indicate various differenc
(p < 0.05)
alum treatments atbetween
three pointsthe treatments
during the at the timeAt
study. point.
the beginning of the study, the FSM
with 0% alum and the FSM that contained 10% alum had similar H2 S flux, which were
Due to
significantly higher thanthethe
lowconcentrations
pH in the FSMofthat H2 Swas
fromtreated withwas
FSM that alum, NH3 flux
treated withwas significant
either
lower when
2.5 or 5% alum. On days 2.5,25,and
or 10%
4, thealum
FSMwasthat added compared
contained to thecontinued
10% alum feedlot surface
to havematerial th
contained no of
a higher concentration alumH2 S(Figure
compared3b). There was a feedlot
to all other significantly
surface higher concentration
material. While it of NH3
was uncleardays
why 0, 2,
theandFSM 4 for the0%
with FSM without
alum alum acompared
had such high fluxto ofthose treated with
H2 S initially, it is alum.
likely Howeve
as no
that the FSM new N
treated sources
with were being
10% alum added to thehigher
had significantly FSM, theH2 Savailable
flux at the N beginning
in the FSMof was quick
depleted
the study due to theby the microbes,
sulfur contained resulting in essentially
in the aluminum sulfateno(alum)
NH3 emissions
added to the after day 7 of th
FSM.
Other research
study. [48]Similar
also reported
to this an increase
study, in H2 S research
previous odor when alum
has was added to
demonstrated swine no NH
virtually
manure because
emissionssulfate
forisupcommonly
to 21 daysusedwhen byalum
anaerobic bacteriato
was applied inbeef
liquid
FSM animal
[26]. waste for
decomposition Overall
of organic compounds
average H2S flux [49].
was The drop in H2greater
significantly S flux atfor
day FSM7 is treated
likely due to 10% alu
with
depletion of the sulfur
(274.3 mg msubstrate.
−2 hr−1) compared to FSM treated with 0, 2.5, or 5% alum (179.4, 150.2, an
Nutrient
163.0composition
mg m−2 hr−1of the FSM afterHydrogen
, respectively). 28 days was significantly
sulfide flux wasdifferent
different due
fortothealum
various alu
treatment (Table 1). There was a tendency for pans treated with 10% alum
treatments at three points during the study. At the beginning of the study, the FSM wi to have higher
total N, but
0%this difference
alum and the wasFSMnot significant
that contained (p = 0.09).
10% Feedlot
alum had surface material
similar treated
H2S flux, which we
with 10% alum had significantly
significantly higher thanhigher ammonium-N
the concentrations of Hconcentration
2S from FSM compared to anywith eith
that was treated
treatment. There was a linear decrease in the ammonium-N concentration in the FSM as the
concentration of alum increased. Nitrate was significantly lower in FSM that received no
alum treatment compared to the FSM that received any concentration of alum. Total sulfur
increased linearly with increasing concentration of alum added to the FSM. These results
were consistent with what was expected and are supported by previous research. Other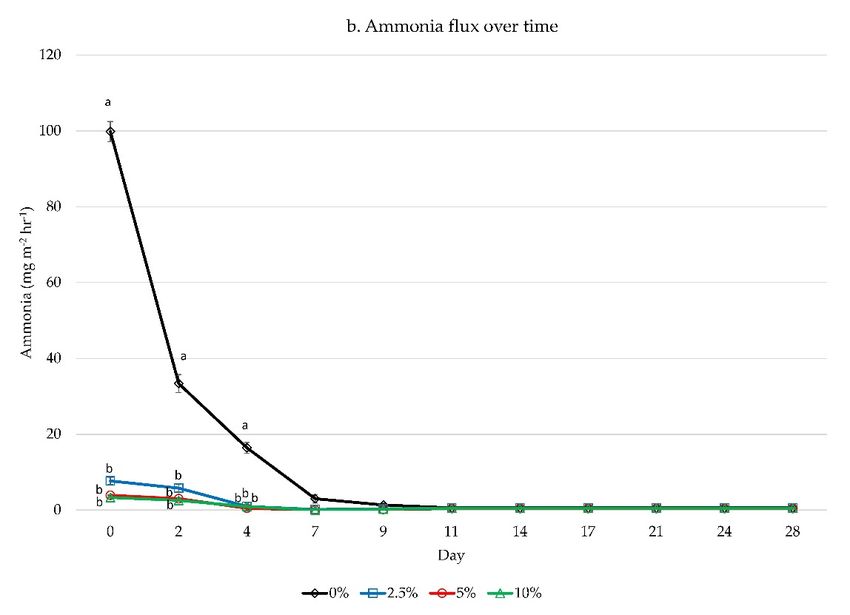
Sustainability 2022, 14, 1984                                                                                           10 of 20

                                researchers also [50] reported significantly higher concentrations of total N as the alum
                                concentration in poultry litter increased from 100 to 300 g of liquid aluminum chloride per
                                kg of poultry litter. Organic N was unaffected by alum treatment and inorganic N (which
                                includes nitrate and ammonium) was significantly higher in poultry litter that received
                                100–300 g of liquid alum per kg of poultry litter compared to poultry litter that was not
                                treated with alum [50]. Likewise, others [26] reported significantly higher nitrogen content
                                in soil treated with alum compared to soil only or to a soil/manure mixture. Sulfur content
                                was also higher when alum was used in that study [26], due to the sulfur contained in
                                alum. However, this may contribute to the production of H2 S and other odorous sulfide
                                compounds generated in livestock waste.
                                     Based on the results of the initial lab-scale study, it was determined that all three
                                concentrations of alum successfully lowered NH3 flux. Ammonium nitrate was significantly
                                higher in the FMS treated with 5 or 10% alum compared to untreated FSM or FSM treated
                                with 2.5% alum, which would increase the fertilizer value of the FSM. However, due to the
                                significant increase in H2 S flux from the FSM treated with 10% alum, it was determined
                                that 5% alum may be the best treatment for FSM.

                                3.2. Dose Frequency Study
                                      The addition of 5% alum to the FSM significantly lowered the pH of the FSM (Figure 4a)
                                for up to 14 days. Initially, FSM that received a single dose of alum had a significantly lower
                                pH than the FSM that received 20% of the total alum dose in weekly increments. At day 7,
                                the pH of the FSM that was treated with the weekly alum dose was lower than the pH of the
                                FSM treated with a single alum dose, but this reduction was not sustained. From day 9 until
                                the end of the 32-day study, FSM treated with both alum treatments had similar pH. This
                                was a substantially different result than was observed in the titration study. We expected the
                                5% treatment applied all in one dose to behave similarly to the 5% treatment in the titration
                                study, significantly lowering the pH of the FSM for the duration of the study. While we are
                                unsure why this occurred, it may have been due to the different FSM that was used in the
                                second study compared to the first study. Many factors affect the ability of soil to buffer
                                a pH change, including clay, organic matter content, cation-exchange capacity, carbonate,
                                bicarbonate, organic acid content, and phosphate content, which were not measured in this
                                study. Additional studies need to examine these properties to determine the ability of alum
                                to effectively lower and sustain a lowered pH in various FSM.
                                      Ammonia flux was significantly lower when 5% alum was added to the FSM on days 0
                                and 2 (Figure 4b). Adding 20% of the total alum treatment in five equal weekly increments
                                initially lowered the NH3 flux compared to untreated FSM but was not able to maintain
                                the same level of reduction in NH3 emission as a one-time dose of 5% alum did until day 7.
                                At that time, the overall NH3 emission was lowered, due to the depletion of N substrate
                                in the pan, making it impossible to know if the addition of alum would have been able to
                                successfully lower NH3 emission past day 7, even though the addition of alum to the FSM
                                was able to maintain a significant reduction in pH throughout most of the 32-day study.
                                      The nutrient composition of FSM from the untreated FSM and the FSM treated with
                                either frequency of alum application was not statistically different for any nutrient ex-
                                cept sulfur. Ammonium accounts for a very small portion of the overall N profile and
                                nitrate-N was not at detectable levels in the FSM at the end of the study. Sulfur was
                                significantly higher in both alum treatments compared to the untreated FSM, but there
                                was no statistical different between the sulfur content of either alum treatment (Table 2).
                                This was consistent with the previous lab-scaled study and other research [26] where
                                sulfur nutrient content increased as alum was added to the FSM. The extra sulfur in the
                                FSM with the alum treatments did not appear to affect H2 S flux; there was no statistical
                                difference (p = 0.79) in H2 S flux among the untreated FSM (76 ± 6.7 mg m−2 hr−1 ), 5%
                                weekly (91.6 ± 6.7 mg m−2 hr−1 ), and 5% once (51 ± 4.7 mg m−2 hr−1 ) treatments. There
                                appeared to be little benefit of adding the 5% alum dose in 20% weekly increments.
Sustainability 2022, 14, x FOR PEER REVIEW 11
Sustainability 2022, 14, 1984 11 of 20
Figure 4. (a) InFigure
general, theInpH
4. (a) of the feedlot
general, the pH surface material
of the feedlot (FSM)material
surface treated (FSM)
with 5% alum with
treated was lower
5% alum was lo
than the FSM than
receiving no alum treatment. Adding 20% of the total alum treatment
the FSM receiving no alum treatment. Adding 20% of the total alum treatment at five weeklyat five we
intervals did not appeardid
intervals to suppress
not appearpHtofor any longer
suppress than
pH for anya single
longerdose
thanof 5% alum.
a single dose(b)ofAmmonia
5% alum. (b) Amm
flux (mg m−2flux hr−1(mg
) of m −2 hr−1) of feedlot surface material (FSM) treated 5% aluminum sulfate (alum)
feedlot surface material (FSM) treated 5% aluminum sulfate (alum) was
generally lower generally lower than
than untreated FSMuntreated
for up toFSM for up
7 days. Fortoboth
7 days. For different
graphs, both graphs, different
letters indicateletters ind
significant
significant differences differences
between between the
the treatments treatments
at the at the time point.
time point.
3.3. Feedlot SurfaceAmmonia
Studies flux was significantly lower when 5% alum was added to the FSM on d
Based on0 and 2 (Figure
the results 4b).lab-scale
of the Addingstudy,
20% of the determined
it was total alum treatment
that there in
wasfive equal we
little
advantage toincrements
adding 10% initially lowered the
alum compared to NH flux compared
5% 3alum to untreated
as both significantly FSM but
reduced NH was
3 not ab
flux compared maintain the treated
to FSM not same level
withof reduction
alum, and H2inS emission
NH3 emission as a with
increased one-time dose of 5% alum
an increasingSustainability 2022, 14, 1984 12 of 20
dose of alum. Therefore, the lowest effective dose was selected for use in the feedlot surface
studies, which was the 5% alum. Additionally, it did not appear that 5% alum applied
in incremental additions on a weekly basis would be effective in lowering NH3 from the
feedlot surface material, so the alum was added in one dose at the initiation of the feedlot
surface study.
Average ambient temperatures from 9:00 AM–4:00 PM and average soil temperature
and moisture content for each treatment on each sampling date is also shown in Table 3.
There was no precipitation on any data collection day. There were no significant differences
in soil temperature or soil moisture content between treatments, or any treatment by day
interactions. There were significant differences in soil temperature and moisture between
days due to differences in ambient temperature and precipitation events.
Table 3. Ambient temperature range between 9 AM and 4 PM, soil temperature and moisture content
on day of data collection for Experiment 3 and 4.
Ambient Temp Average Soil Average Soil
Range, ◦ C Temp, ◦ C Moisture, %
Experiment 3, Day
0 20.6–25.6 23.1 ± 0.2 b 49.9 ± 2.3 xy
3 20.0–25.0 22.8 ± 0.1 c 52.3 ± 2.4 xy
7 21.7–30.6 24.7 ± 0.1 a 52.0 ± 1.5 xy
10 23.3–30.6 22.5 ± 0.2 c 55.0 ± 1.4 x
14 18.9–25.0 22.5 ± 0.1 c 48.1 ± 1.8 y
17 23.3–28.3 21.9 ± 0.1 d 49.4 ± 1.3 y
21 20.0–25.6 21.6 ± 0.1 e 36.2 ± 2.2 z
24 18.9–22.8 21.8 ± 0.1 d 51.0 ± 1.1 y
Experiment 4, Day
0 28.9–32.2 27.7 ± 0.3 xy 65.7 ± 2.4 b
3 21.7–27.8 29.4 ± 0.3 xy 59.3 ± 3.5 b
7 21.1–26.7 29.1 ± 0.3 xy 63.1 ± 3.8 b
10 23.9–28.3 28.5 ± 0.2 xy 68.3 ± 2.3 b
14 23.3–27.8 33.0 ± 6.3 x 66.3 ± 0.1 b
17 20.6–25.0 25.1 ± 0.2 y 80.6 ± 1.3 a
21 20.0–26.7 20.8 ± 0.1 z 80.0 ± 0.1 a
24 25.6–31.7 24.6 ± 0.1 y 66.4 ± 2.7 b
Statistical Analysis
Treatment —– 0.23 0.79
Day —–Sustainability 2022, 14, x FOR PEER REVIEW 13
Sustainability 2022, 14, 1984 13 of 20
Figure 5. Cont.Sustainability 2022, 14, 1984 14 of 20
Figure 5. (a) The pH of the feedlot surface with and without the addition of 5% alum. The addition
of alum significantly lowered pH for the 24 days of the study. (b). Ammonia flux from feedlot
surface treated with 5% alum and untreated feedlot surface. While NH3 flux was lower for feedlot
surface areas treated with 5% alum for up to 7 days, overall NH3 flux did not differ between the
two treatments. The peak NH3 flux was just shifted when 5% alum was added to the feedlot
surface. Different letters indicate significant differences between the treatments at the time point.
Figure 5. (a) The pH of the feedlot surface with and without the addition of 5% alum. The additi
(c). Dimethyl
of disulfide (DMDS) flux
alum significantly frompH
lowered the for
feedlot surface
the 24 days treated with and
of the study. (b).without
Ammonia 5%flux
alumfrom feedl
differed significantly
surface treated with 5% alum and untreated feedlot surface. While NH3 flux was alum
at five of eight time points in the study, with the pens treated with 5% lower for feedl
have significantly
surfacegreater DMDSwith
areas treated flux.5%Different
alum for letters
up toindicate significant
7 days, overall NH3differences
flux did notbetween the
differ between the tw
treatments at the time point.
treatments. For all
The peak NHgraphs, different
3 flux was letters indicate
just shifted when 5% significant
alum was differences
added tobetween
the feedlot surfac
Different
the treatments letters
at the time indicate significant differences between the treatments at the time point. (
point.
Dimethyl disulfide (DMDS) flux from the feedlot surface treated with and without 5% alum differ
Basedsignificantly
on the lab-scale study
at five using
of eight 0–10%
time pointsalum,
in theit appeared
study, withthatthethere
pens was little
treated differ-
with 5% alum ha
ence betweensignificantly greater
the addition of 5 DMDS
and 10% flux.
alumDifferent lettersBoth
to the FSM. indicate
weresignificant differences
able to reduce pH andbetween t
treatments
NH3 flux from at the
the FSM andtime point.
retain For all graphs,
significantly different
more letters indicate
ammonium-N significant
in the differences betwe
FSM compared
the treatments at the time point.
to FSM treated with 0% alum. Concerns over the increase in sulfur concentration in the
FSM as the concentration of alum increased, as well as concern that prolonged exposure to
Based the
low pH would irritate on the
hooveslab-scale study
and feet usingled0–10%
of cattle, to the alum,
use of it
5%appeared
alum on the thatfeedlot
there was litt
difference
surface. However, between
while able tothe additionlower
effectively of 5 and
the pH10%ofalum to the FSM.
the feedlot surface,Boththewere able to redu
addition
of 5% alum to the surface was not able to sustain a reduced NH3 flux for longer thanin the FS
pH and NH 3 flux from the FSM and retain significantly more ammonium-N
1 week, andcompared
overall NH to3 emissions
FSM treated with 0%
were similar alum.the
between Concerns
treated and over the increase
untreated feedlot in sulf
surfaces. Analysis of the VOCs demonstrated a significant overall increase in DMDSas
concentration in the FSM as the concentration of alum increased, as well concern th
flux
exposure to low pH would irritate the hooves and−
(Figure 5c) for feedlot pen areas treated with 5% alum (14.3 ± 0.5 mg m hr ) compared to the u
prolonged 2 −
feet of
1 cattle, led
of did
to areas that 5% not
alum on thea feedlot
receive treatmentsurface. However,
(9.72 ± 1.1 mg mwhile−2 hrable
−1 ). Dimethyltrisulfide
to effectively lowerflux the pH of th
was similarfeedlot surface,
(p = 0.36) the areas
for pen addition of 5%
treated alum
with 5%to the (0.33
alum surface was mg
± 0.06 not m −2 to
able hr−sustain
1 ) and a reduce
NH3 flux
untreated areas (0.27for longer
± 0.05 mgthanm−2 1hrweek,
−1 ). and overall NH3 emissions were similar between th
treated
A second andsurface
feedlot untreatedstudyfeedlot surfaces. Analysis
was conducted using 10%ofalum
the VOCs
treatmentdemonstrated
to determine a significa
if the higher concentration of alum could suppress NH3 emissions for longer than 7 days.alum (14
overall increase in DMDS flux (Figure 5c) for feedlot pen areas treated with 5%
There was concern that too much alum would lower the pH of the feedlot surface below 5.5
and cause irritation to cattle’s hooves or hides, so a preliminary study was conducted using
10% alum in one pen under the supervision of the USMARC herd veterinarian to determine
if any hoof irritation was present. Feedlot surface material samples were collected from
the pen surface, and pH was measured daily. The cattle were also observed daily by theSustainability 2022, 14, 1984 15 of 20
veterinarian for any signs of irritation. Once the pen pH was above 7, the observations
ceased. No irritation was observed on the hide or hooves of any animal in the pen; thus, it
was determined that 10% alum would be safe to administer to the feedlot pens of beef cattle.
Sustainability 2022, 14, x FORConsistent with all the previous studies conducted by our lab, the addition of 10%
PEER REVIEW 17 o
alum to the feedlot surface significantly reduced the pH of the feedlot surface material
compared to untreated areas of the pen (Figure 6a).
Figure 6. Cont.Sustainability 2022, 14, 1984 16 of 20
Figure 6. (a) The addition of 10% alum to the feedlot surface of beef cattle pens effectively lowered
pen surface pH for the 24-day duration of the study compared to pens that did not receive an alum
treatment. (b) Addition of 10% alum to the feedlot surface significantly reduced NH3 flux for up to
14 days following application compared to untreated feedlot surface areas. Different letters indicate
significant differences between the treatments at the time point. (c). Dimethyl disulfide (DMDS) flux
was highly variable during the study but was greater for feedlot surface areas treated with 10% alum
Figure 6. (a) The addition of 10% alum to the feedlot surface of beef cattle pens effectively lowere
at days 0, 7,pen
17, and 21 compared
surface pH for theto24-day
untreated feedlot
duration surface
of the studyareas. For alltographs,
compared different
pens that letters
did not receive an alu
indicate significant differences
treatment. between
(b) Addition thealum
of 10% treatments
to the at the time
feedlot point.
surface significantly reduced NH3 flux for up
14 days following application compared to untreated feedlot surface areas. Different letters indica
The addition
significant ofdifferences
10% alumbetween
to the feedlot surface
the treatments significantly
at the time point. reduced NHdisulfide
(c). Dimethyl 3 flux for (DMDS) flu
up to 14 days following application compared to untreated feedlot surfaces
was highly variable during the study but was greater for feedlot surface areas treated (Figure 6b). with 10
Ammonia alum
flux for both0,treatments
at days 7, 17, and 21 decreased
comparedover time and
to untreated emissions
feedlot surfacewere quite
areas. low
For all for differe
graphs,
both treatments
letters from day
indicate 17 until differences
significant the end of between
the 24-daythe study, indicating
treatments thatpoint.
at the time N substrate
on the feedlot surface was depleted. Therefore, it is unknown if the addition of 10% alum
would continueThe addition NH
to suppress of 10% alum toifthe
3 emissions feedlot
cattle weresurface
presentsignificantly
and continually reduced
adding NH3 flux f
up to 14 days following application compared to untreated feedlot surfaces (Figure 6b
new N substrate.
Ammonia flux
Dimethyltrisulfide forwas
flux both
verytreatments
small anddecreased over time
not significantly and emissions
different were quite low f
(p = 0.10) between
the treatedboth ± 0.01 mgfrom
(0.02treatments m−2dayhr−171 ) and
untiluntreated
the end ofareas (0.01 ±study,
the 24-day 0.01 mg m−2 hr−
indicating 1 ) of
that N substra
on the feedlot surface
the pen. Dimethyldisulfide washighly
flux was depleted. Therefore,
variable it is unknown
throughout the studyif but
the was
addition
greater of 10% alu
at days 0, would
7, 17, and 21 fortopen
continue surface
suppress NHareas treated ifwith
3 emissions cattle10%
werealum compared
present to pen addin
and continually
surface areas
newthat did not receive an alum treatment. This was, again, consistent with
N substrate.
previous studies that demonstrated
Dimethyltrisulfide increased
flux was very sulfide
small fluxandwhennot alum was added
significantly to the (p = 0.1
different
feedlot surface.
between the treated (0.02 ± 0.01 mg m−2 hr−1) and untreated areas (0.01 ± 0.01 mg m−2 hr
Total N −1 ) was higher in the FSM treated with 10% alum compared to FSM that
of (g kgpen.
the Dimethyldisulfide flux was highly variable throughout the study but w
did not receive
greater anatalum
daystreatment
0, 7, 17, and(Table 4).pen
21 for However,
surface individual
areas treated N with
components
10% alum were compared
similar between the FSM from the treated and untreated areas of the feedlot pen.
pen surface areas that did not receive an alum treatment. This was, again, consistent wi Consistent
with previous studies,
previous the sulfur
studies content of the increased
that demonstrated FSM was significantly
sulfide flux whengreater when
alum wasalumadded to th
was applied to thesurface.
feedlot feedlot surface.Sustainability 2022, 14, 1984 17 of 20
Table 4. Comparison of the nutrient composition of cattle feedlot surface areas treated with 10%
aluminum sulfate (alum) and no treatment.
Nutrient Initial FSM 0% Alum 10% Alum p-Value
Dry matter, % 44.9 ± 1.0 51.4 ± 2.0 57.5 ± 1.5 0.01
Total N, g kg−1 19.8 ± 1.3 18.1 ± 0.5 19.7 ± 0.4 0.01
Organic-N, g kg−1 17.4 ± 1.3 17.6 ± 0.4 17.8 ± 0.4 0.68
Ammonium-N, g kg−1 2.4 ± 0.3 0.9 ± 0.3 3.1 ± 1.1 0.08
Nitrate-N, g kg−1 0.01 ± 0.0 0.01 ± 0.0 0.01 ± 0.0 —–
Total Sulfur, g kg−1 6.7 ± 0.9 6.5 ± 0.2 b 16.8 ± 0.6 a >0.01
All nutrient compositions, except dry matter content, were on a dry-matter basis. Different letters within a row
indicate significant difference among treatments at p < 0.05.
Ammonia volatilization from the feedlot surface depends on several variables includ-
ing pH, temperature, and moisture content. When pH is above 8, a large percentage of
inorganic nitrogen (N) is in the NH3 form and can be easily volatilized. When pH is low-
ered, N is converted to the nonvolatile ammonium form which increases N in the manure
thereby improving the fertilizer value. Alum can reduce the pH of feedlot surface material
due to the hydrolysis of aluminum [48]. The results of the four studies were consistent in
that the addition of alum to the FSM or beef feedlot did lower the pH for at least 7 days.
While the addition of alum at concentrations even as low as 2.5% (g g−1 ), can effectively
lower the pH of the feedlot surface material, NH3 flux was only lowered for up to 14 days
when alum was applied. This indicates that the environmental conditions in a feedlot pen
are more complex than in a controlled environment and that other factors beyond pH such
as temperature, moisture, and even bacterial metabolism of N sources may be contributing
to the volatilization of NH3 from the feedlot surface. It should be noted that the design of
the studies did not provide fresh N sources to the FSM as would occur on a feedlot surface
with cattle present. Therefore, after 14 days the N substate that was present in the FSM was
likely volatilized or used by microbes for biological processes. A study in which fresh N
sources could be applied would help determine if the alum becomes ineffective in lowering
NH3 emissions after 14 days, or if the decrease in overall NH3 emissions due to loss of
substrate made it impossible to detect differences in NH3 volatilization from the FSM.
One way to maintain the lower pH would be more frequent additions of alum to the
feedlot surface. It was hypothesized that weekly, smaller doses of alum to the FSM would
maintain a consistently lower pH over a longer period compared to one initial dose. In
turn, this would continue to suppress NH3 emissions beyond the 7 days that was observed
in the lab-scale study. However, the second lab-scale study demonstrated that this was
not the case. Another alternative that was not evaluated would be to apply an initial
dose of 5 or 10% alum and then add smaller increments on a weekly or biweekly basis
to maintain adequate alum concentration to inhibit NH3 emissions. However, this could
become expensive and labor-intensive for feedlot producers.
One concern for beef feedlot producers looking to lower the NH3 emissions from their
operation is the cost of the mitigation. The dry aluminum sulfate used in these studies was
purchased in 22.7 kg bags at a cost of USD 16.50–17.00 per bag. When applied at a rate of
10% to the top 5 cm of the feedlot surface the cost would be USD 8.03/m2 (USD 0.75/ft2 ).
This would not be a cost-effective treatment for most producers who allow 14–23 m2 per
animal [51]. However, research has demonstrated that spatial variation exists in feedlot
pens, which contributes to differences in odor and greenhouse gas emissions [34,35]. By
identifying the locations in the pen that contribute the most to NH3 emissions, perhaps
alum could be applied to the specific areas of the pen, instead of the entire pen, making it a
more cost-effective treatment for producers.
The biggest concern with using alum on the cattle feedlot surface appears to be in the
increase in sulfide emissions in the form of H2 S and other reduced sulfide compounds. The
primary source of this H2 S emission appears to be the additional sulfur substrate added
to the FSM with the addition of alum. Hydrogen sulfide emission contributes to odorsSustainability 2022, 14, 1984 18 of 20
from livestock facilities and exposure to H2 S can be harmful or even fatal to humans and
livestock [51]. Hydrogen sulfide flux is produced as a result of sulfate reduction obligate
anaerobic bacteria [52]. A low pH (Sustainability 2022, 14, 1984 19 of 20
5. Trabue, S.; Kerr, B.; Bearson, B.; Ziemer, C. Swine odor analyzed by odor panels and chemical techniques. J. Environ. Qual. 2011,
40, 1510–1520. [CrossRef]
6. Trabue, S.; Scoggin, K.; McConnell, L.; Maghirang, R.; Razote, E.; Hatfield, J. Identifying and tracking key odorants from cattle
feedlots. Atmos. Environ. 2011, 45, 4243–4251. [CrossRef]
7. Preece, S.L.M.; Casey, K.D.; Auvermann, B.W. Hydrogen Sulfide Emissions from Open/Dry-Lot Cattle-Feeding Operations, Texas
Agri-Life Extension, E-620. 2012. Available online: https://agrilifeextension.tamu.edu/library/ranching/hydrogen-sulfide-
emissions-from-open-dry-lot-cattle-feeding-operations/ (accessed on 20 December 2021).
8. National Research Council (US) Committee on Acute Exposure Guideline Levels. Acute Exposure Guideline Levels for Selected
Airborne Chemicals; National Academies Press: Washington, DC, USA, 2008; Volume 6. Available online: https://www.ncbi.nlm.
nih.gov/books/NBK207883/ (accessed on 19 January 2022).
9. Fazzalari, F.A. (Ed.) Compilation of Odor and Taste Threshold Data; ASTM Data Series DS 48A; ASTM Data: Philadelphia, PA, USA, 1978.
10. Buttery, B.G.; Turnbaugh, J.G.; Ling, L.C. Contribution of volatiles to rice aroma. J. Agric. Food Chem. 1988, 36, 1006–1009.
[CrossRef]
11. O’Neill, D.H.; Phillips, V.R. A review of the control of odour nuisance from livestock buildings: Part 3, properties of the odorous
substances which have been identified in livestock waste or in the air around them. J. Agric. Eng. Res. 1992, 53, 23–50. [CrossRef]
12. Moulders, E.J. The odour of white bread IV. Quantitative determination of constituents in the vapour and their odour values. Z.
Lesensm. Unters. Forsch. 1973, 151, 310–317.
13. Guadagni, G.; Buttery, R.G.; Okano, S. Odour thresholds of some organic compounds associated with food flavours. J. Sci. Food
Agric. 1963, 14, 761–765. [CrossRef]
14. Buttery, R.G.; Teranishi, R.; Flath, R.A.; Ling, L.C. Identification of additional tomato paste volatiles. J. Agric. Food Chem. 1990, 38,
792–795. [CrossRef]
15. Buttery, B.G.; Guadagni, D.; Ling, L.; Seifert, R.; Lipton, W. Additional volatile compounds of cabbage, broccoli, and cauliflower. J.
Agric. Food Chem. 1976, 24, 829–832. [CrossRef]
16. Stowell, R. Ammonia Loss and Emission Reporting: Considerations for Cattle Operations. UNL BeefWatch, 1 February 2018.
Available online: http://newsroom.unl.edu/announce/beef/7498/42942 (accessed on 20 December 2021).
17. Bierman, S.; Klopfenstein, T.J.; Stock, R.; Shain, D. Evaluation of Nitrogen, Phosphorus, and Organic Matter Balance in the Feedlot as
Affected by Nutrition; Beef Cattle Report MP66-A; University of Nebraska-Lincoln: Lincoln, NE, USA, 1996; pp. 74–76.
18. Van Horn, H.H.; Newton, G.L.; Kunkle, W.E. Ruminant nutrition from an environmental perspective: Factors affecting whole-farm
nutrient balance. J. Anim. Sci. 1996, 74, 3082–3102. [CrossRef]
19. Hausinger, R.P. Metabolic versatility of prokaryotes for urea deposition. J. Bacteriol. 2004, 186, 2520–2522. [CrossRef] [PubMed]
20. Bierman, S.; Erickson, G.E.; Klopfenstein, T.J.; Stock, R.A.; Shain, D.H. Evaluation of nitrogen and organic matter balance in the
feedlot as affected by level and source of dietary fiber. J. Anim. Sci. 1999, 77, 1645–1653. [CrossRef]
21. Erickson, G.; Klopfenstein, T. Managing N inputs and the effect on N volatilization following excretion in open-dirt feedlots in
Nebraska. Nitrogen in the environment. Sci. World J. 2001, 52, 830. [CrossRef]
22. Todd, R.; Cole, N.; Clark, R.; Flesch, T.; Harper, L.; Baek, B. Ammonia emissions form beef cattle feedyard on the southern High
Plains. Atmos. Environ. 2008, 42, 6769–6805. [CrossRef]
23. Homolka, M.N.; Erickson, G.E.; Koelsch, R.K. Predicting nitrogen and phosphorus balance in beef open lots. Appl. Ani. Sci. 2021,
37, 641–653. [CrossRef]
24. Hartung, J.; Phillips, V.R. Control of gaseous emissions from livestock buildings and manure stores. J. Agric. Eng. Res. 1994, 57,
173–189. [CrossRef]
25. Rhoades, M.; Parker, D.; Cole, N.; Todd, R.; Caraway, E.; Auvermann, B.; Topliff, D.; Schuster, G. Continuous ammonia emission
measurements from a commercial beef feedyard in Texas. Trans. ASABE 2010, 53, 1823–1831. [CrossRef]
26. Shi, Y.; Parker, D.B.; Cole, N.A.; Auvermann, B.W.; Mehlhorn, J.E. Surface amendments to minimize ammonia emissions from
beef cattle feedlots. Trans. ASABE 2001, 44, 677–682. [CrossRef]
27. Varel, V.H.; Wells, J.E.; Miller, D.N. Combination of urease inhibitor and plant essential oil to control coliform bacteria, odour
production and ammonia loss from cattle waste. J. Appl. Microbiol. 2007, 102, 472–477. [CrossRef] [PubMed]
28. Cole, N.A.; Todd, R.W.; Parker, D.B. Use of fat and zeolite to reduce ammonia emissions from beef cattle feedyards. In Proceedings of
the International Symposium on Air Quality and Waste Management for Agriculture, Broomfield, CO, USA, 16–19 September 2007.
29. Moore, P.A., Jr.; Daniel, T.C.; Edwards, D.R.; Miller, D.N. Effect of chemical amendments on ammonia volatilization from poultry
litter. J. Environ. Qual. 1995, 24, 293–300. [CrossRef]
30. Moore, P.A., Jr.; Daniel, T.C.; Edwards, D.R. Reducing phosphorus runoff and inhibiting ammonia loss from poultry manure with
aluminum sulfate. J. Environ. Qual. 2000, 29, 37–49. [CrossRef]
31. Moore, P.A.; Edwards, D.R. Long-term effects of poultry litter, alum-treated litter, and ammonium nitrate on phosphorus
availability in soils. J. Environ. Qual. 2007, 36, 163–174. [CrossRef]
32. Warren, J.G.; Phillips, S.B.; Mullins, G.L.; Keahey, D.; Penn, C.J. Environmental and production consequences of using alum-
amended poultry litter as a nutrient source for corn. J. Environ. Qual. 2006, 35, 172–183. [CrossRef]
33. Spiehs, M.J.; Woodbury, B.L.; Parker, D.B. Ammonia, hydrogen sulfide, and greenhouse gas emissions from lab-scaled manure
bedpacks with and without aluminum sulfate additions. Environments 2019, 6, 108. [CrossRef]You can also read