Effect of high level fine particulate matter and its interaction with meteorological factors on AECOPD in Shijiazhuang, China
←
→
Page content transcription
If your browser does not render page correctly, please read the page content below
www.nature.com/scientificreports
OPEN Effect of high‑level fine particulate
matter and its interaction
with meteorological factors
on AECOPD in Shijiazhuang, China
Beibei Song1, Huiran Zhang2, Libin Jiao3, Zeng Jing4, Honglin Li1 & Siyu Wu1*
Epidemiological evidence of the effect of high-level air pollution and its interaction with
meteorological factors on the risk of acute exacerbation of chronic obstructive pulmonary disease
(AECOPD) is limited. Daily data on AECOPD cases, air pollutants and meteorological factors were
collected from 2015 to 2018 in Shijiazhuang. A distributed lag non-linear model (DLNM) was used to
explore the lag and cumulative effect of PM2.5 on the risk of AECOPD. The effect of the interaction
between PM2.5 and meteorological factors on AECOPD was estimated by a generalized additive
model (GAM) and a stratification model. A total of 4766 patients with AECOPD were enrolled. After
controlling for confounders, each 10 μg/m3 increase in PM2.5 led to a 5.8% increase in the risk of
AECOPD on day lag 0. The cumulative effect of PM2.5 on AECOPD risk showed an increasing trend
after 3 days. Similar results were observed in both smoking and non-smoking patients. There was
an interaction between PM2.5 and meteorological factors, and the risk of AECOPD was higher in
cold and lower humidity conditions than in other conditions. High-level PM2.5 exposure is positively
associated with the risk of AECOPD onset, and the effect of PM2.5 can be modified by the temperature
and relative humidity. Public health guidelines should pay close attention to AECOPD risk under the
condition of high-level PM2.5 with low temperature or low humidity.
Air pollution is a major contributor to the global burden of disease and was the 4th highest leading risk factor
for mortality after high systolic blood pressure, tobacco use, and dietary risks. An estimated 12% of all deaths
were attributed to outdoor and indoor air pollution in 2019, and respiratory diseases are linked to an estimated
6.7 million deaths every year around the w orld1.
Chronic obstructive pulmonary disease (COPD) is the leading cause of respiratory disease death in China,
resulting in 0.9 million deaths each year and posing huge economic and societal b urdens2. COPD is a chronic
progressive disease, and most COPD hospitalizations are attributed to acute exacerbations3,4. Acute exacerbation
of chronic obstructive pulmonary disease (AECOPD) is a crucial stage in the natural history of the disease, which
leads to the accelerated deterioration of lung function, reduced quality of life, and increased mortality5–7. Previous
studies have reported that AECOPD patient deaths usually occur in the short term after hospital admission8,9. The
largest proportion of the total COPD burden has been ascribed to AECOPD in the healthcare s ystem10. Ambient
air pollutants and meteorological factors are regarded as vital modifiers of the exacerbation process. Mechanistic
studies have found that PM2.5 can enter distal respiratory tracts due to their small size, resulting in air restriction
and severely affecting AECOPD11. Recent epidemiological studies have indicated a positive association between
low-level PM2.5 exposure and the risk of A ECOPD12–15. Some studies have also suggested that extreme mete-
orological conditions are associated with the occurrence of A ECOPD16–18. However, few studies have explored
the effect of high-level P
M2.5 and its interaction with meteorological factors on the development of AECOPD.
Severe air pollution events were reported in Shijiazhuang for a long time during 2015 and 2018. The daily
average concentration of P M2.5 was occasionally recorded to be over 500 μg/m319. Our study aimed to evaluate
the effect of high concentrations of P M2.5 on the risk of AECOPD onset in Shijiazhuang and to investigate the
interaction of P M2.5 with temperature and relative humidity, using a generalized additive model (GAM). The
1
Department of Respiratory and Critical Care Medicine, The Second Hospital of Hebei Medical University/Hebei
Key Laboratory of Respiratory Critical Care, No. 215 Heping West Road, Shijiazhuang 050000, China. 2Department
of Biological Pharmacy, Hebei Medical University, Shijiazhuang 050000, China. 3Hebei Far East Communication
System Engineering Company, Shijiazhuang 050000, China. 4Department of Pharmacy, The Fourth Hospital of
Shijiazhuang, Shijiazhuang 050000, China. *email: wusiyu.2003@163.com
Scientific Reports | (2022) 12:8711 | https://doi.org/10.1038/s41598-022-12791-4 1
Vol.:(0123456789)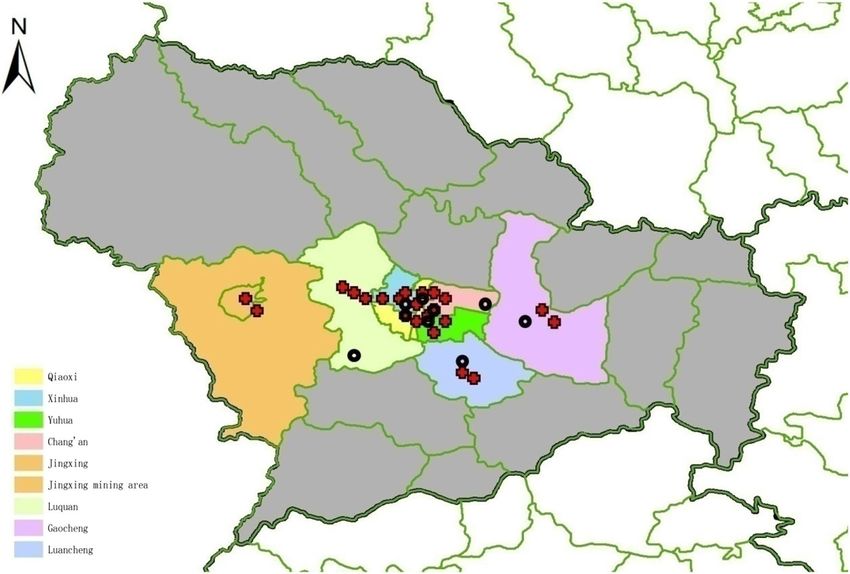
www.nature.com/scientificreports/
Figure 1. The geographical location of hospitals (red crosses denoting public tertiary hospitals and secondary
hospitals) and air quality monitoring stations (black circles) in Shijiazhuang. (ArcGIS 10.2 for Desktop software,
Environmental Systems Research Institute Inc., USA, https://www.esri.com).
results are beneficial for developing public health policies and measures to prevent the exacerbation of COPD
due to PM2.5 and meteorological factors.
Materials and methods
Study area. Shijiazhuang, the capital of Hebei Province, lies in the North China Plain and is one of the
largest transport hubs and industrial cities in the North China Plain. The city is located between 113° 30ʹ and
115° 20ʹ N longitude and 37° 27ʹ–38° 47ʹ E latitude and has a sub-humid warm temperate continental monsoon
climate and seasonal changes. The annual mean temperature is 12.9 ℃. The 2020 census showed that there were
more than 10 million permanent residents in Shijiazhuang. The areas in our study cover more than 60% of the
residents of Shijiazhuang. Cars ownership surpassed 2.8 million across the city by the end of 2020 (National
Bureau of Statistics, 2021). The geographical locations of hospitals and air quality monitoring stations in Shiji-
azhuang are shown in Fig. 1.
Study population. Hospitalization information for AECOPD patients was derived from the electronic
medical records of most public tertiary hospitals and secondary hospitals in Shijiazhuang between January 2015
and December 2018. These hospitals accounted for 58% of tertiary hospitals and secondary hospitals and served
most of the COPD patients residing in Shijiazhuang. The Electronic Medical System is used to record all patients
coming into the hospital who visited a doctor in the emergency department, outpatient department or inpatient
department. Our study collected information on patients with AECOPD including dates of hospital admission,
principal diagnosis, smoking status, place of residence, and history of diseases. All the patients with primary
and secondary diagnoses of AECOPD were included in the analysis. All the AECOPD patients were confirmed
according to the standard diagnostic criteria for AECOPD (J44.100 and J44.101) by the 10th Edition Interna-
tional Classification of Diseases. Smoking status was categorized as smokers and non-smokers. The patients
were residents of Shijiazhuang city which includes 8 counties, and they lived in Shijiazhuang during 2015–2018.
Patients diagnosed, such as cancer, stroke or myocardial infarction, with other severe diseases were not included.
This study was conducted according to the guidelines of the Declaration of Helsinki, and all procedures involv-
ing human subjects were approved by the Ethics Committee of the Second Hospital of Hebei Medical University.
Written informed consent was obtained from all the subjects.
Data collection. Daily 24-h average concentrations of air pollutants during the same period, including fine
particulate matter (PM2.5), inhalable particulate matter (PM10), sulfur dioxide(SO2), nitrogen dioxide(NO2),
and ozone(O3),were obtained from the Hebei Environmental Protection Bureau. We used mass concentra-
tion (μg/m3) as a unit for the air pollutants, consistent with “national ambient air quality standards” (NAAQS)
Scientific Reports | (2022) 12:8711 | https://doi.org/10.1038/s41598-022-12791-4 2
Vol:.(1234567890)www.nature.com/scientificreports/
(GB3095-2012) (http://datacenter.mep.gov.cn/). To adjust for weather conditions, daily average meteorological
data including mean temperature (°C) and relative humidity (%) were extracted from the Hebei Meteorological
Bureau. All the data on air pollutants and meteorological factors were collected at the national standard weather
station in Shijiazhuang.
Statistical analysis. A descriptive analysis was conducted to describe the temporal distribution of
AECOPD cases, air pollutants, and environmental factors.
Previous studies showed that the exposure–response relationship between ambient factors and health out-
comes was always non-linear and that the number of daily AECOPD cases approximately followed a quasi-
Poisson distribution20–22. GAMs have been widely used to explore the association of environmental factors and
health outcomes. A GAM with quasi-Poisson link function can control nonlinear confounding factors and over
dispersion by nonparametric spline functions23. Because of the cumulative and delayed effects of environmental
factors on health outcomes, a distributed lag non-linear model (DLNM) was used to estimate the effect of PM2.5
and meteorological factors on AECOPD risk24–26. PM2.5 was applied with a cross-basis function.
Available studies in areas with low-levels of P
M2.5 showed that the acute influence of ambient air pollutants
on the respiratory system always occurred within 6–12 days. In the preliminary analyses, we compared the 7
patterns of the max lag period. We also estimated the degree of model fitting using the determination coeffi-
cient (R2) and conducted sensitivity analyses. Preliminary analyses showed that a 7-day lag period was the most
applicable and robust for our models. Moreover, a recent study in Shanghai reported that the cut-off value of
the day prior to acute exacerbation of COPD was 7 days in the warm s eason32. Model diagnostics were further
analyzed. Finally, we chose a 7-day lag period for this study. In addition, temperature and relative humidity have
previously been shown to be associated with the A ECOPD17,18,27. Taken together, the formula for the multiple
pollutants model was specified as:
7
Log[E(Yt)] = β+ αp PM2.5t−p +s air pollutants +s(tem)+s(hum)+s(time)+holiday+DOW,
p=0
where E(Yt) is the expected daily count of AECOPD cases on day t; β is the intercept; and αp is the effect estimate
of PM2.5 p days before the onset day of AECOPD. air pollutants represents other air pollutants except for P M2.5
and was used to adjust for the influence of other pollutants on AECOPD. tem and hum indicate the daily mean
temperature and relative humidity, respectively. s() represents the thin plate spline function. s(time) was used
to control the seasonal and long-term trends. Holiday and DOW were adjusted for the confounding effect of
public holidays and the day of the week because participants had different air pollution exposure levels during
the week and during holidays. The optimal degrees of freedom (df) was assessed by generalized cross validation
(GCV) criteria. The GCV score can be taken as an estimate of the mean square prediction error based on the
leave-one-out cross validation estimation process. The df was automatically selected by R s oftware28. Addition-
ally, AECOPD patients were stratified by smoking status to test the modification of tobacco smoking on the risk
of AECOPD onset.
The interactions of P
M2.5 and meteorological factors on AECOPD risk were investigated using a GAM with
the thin plate splines function in two steps. First, we used a three-dimensional diagram to explore the potential
interactions of P M2.5 with temperature and relative humidity. The formula for the model was specified as:
Log(E(Yt) = β+s(PM2.5 , meteorological factors)+s air pollutants +s(time) + holiday + DOW.
Then stratified models were used to examine the effect of P M2.5 on AECOPD risk with each level of tem-
perature and relative humidity, namely, low level, medium level and high level, using the cut-point of the 33.3rd
and 66.6th percentiles.
R 3.4.3 software (R Foundation for Statistical Computing, Vienna, Austria) was used in all analyses. A two-
sided p < 0.05 was considered statistically significant.
Results
Descriptive analysis. Table 1 shows the main characteristics of AECOPD cases, air pollutants, and mete-
orological factors in Shijiazhuang between January 2015 and December 2018. A total of 4,766 AECOPD cases
were assessed during the study period. The average count of AECOPD cases was 3.26 ± 2.68 per day. The daily
average concentrations of PM2.5, PM10, NO2, SO2, CO, and O3 were 85.4 μg/m3, 147 μg/m3, 51.6 μg/m3, 35.7 μg/
m3, 1.37 μg/m3, and 92.9 μg/m3, respectively. The daily mean temperature was 14.5 °C and the relative humidity
was 57.4%. The demographic characteristics of the AECOPD patients in Shijiazhuang during 2015–2018 are
shown in Supplementary Table 1.
Figure 2 shows the time-series distributions of the daily AECOPD cases, daily average concentration of air
pollutants, daily mean temperature and relative humidity during the study period in Shijiazhuang. The long-term
trend of the number of AECOPD cases was mild, and seasonality was found in all series. The number of AECOPD
cases increased slightly from 2015 to 2018, with more cases developing in winter and spring.
Exploratory analysis. Table 2 presents the Spearman correlation coefficients between AECOPD cases and
ambient factors. Daily AECOPD cases were positively and strongly associated with PM2.5 (rs = 0.711) and PM10
(rs = 0.693). Nevertheless, a weak and negative relationship of daily AECOPD cases with temperature and rela-
tive humidity was observed. Figure 3 lists the exploratory results from the GAM. A nonlinear relationship of
AECOPD cases with P M2.5, SO2, CO, O
3 and average temperature was found, while AECOPD cases were linearly
Scientific Reports | (2022) 12:8711 | https://doi.org/10.1038/s41598-022-12791-4 3
Vol.:(0123456789)www.nature.com/scientificreports/
Percentiles
Mean SD Min 25th 50th 75th Max
Cases of AECOPD 3.26 2.68 0 1 3 4 23
PM2.5 (μg/m3) 85.4 73.2 6 39 64 104 621
PM10 (μg/m3) 147.0 98.0 17 81 126 183 866
NO2 (μg/m3) 51.6 25.2 9 34 48 64 183
SO2 (μg/m3) 35.7 30.7 4 15 26 44 259
CO (μg/m3) 1.37 1.12 0.1 0.7 1 1.6 10.4
O3 (μg/m3) 92.9 58.2 2 48 86 128 287
Temperature (℃) 14.5 10.7 − 9.4 4.6 16.3 24.3 35.5
Relative humidity (%) 57.4 20.2 12 42 58 73 99
Table 1. Descriptive statistics of the AECOPD cases, air pollutants, and meteorological factors in Shijiazhuang
during 2015–2018.
Figure 2. The distribution of the daily AECOPD cases, daily mean air pollutants and meteorological variables
in Shijiazhuang, China, 2015–2018.
AECOPD PM2.5 PM10 SO2 CO NO2 O3 Temperature Relative humidity
AECOPD 1.000 0.711* 0.693* 0.433* 0.252* 0.311* − 0.239* − 0.450* − 0.444*
PM2.5 1.000 0.981* 0.589* 0.531* 0.642* − 0.237 − 0.479* − 0.336*
PM10 1.000 0.634* 0.483* 0.443* − 0.220 − 0.426* − 0.309*
SO2 1.000 0.323 0.423* − 0.131 − 0.242* − 0.219*
CO 1.000 0.580* − 0.220 − 0.212 − 0.166
NO2 1.000 − 0.108 − 0.224 − 0.107
O3 1.000 0.326* 0.064
Temperature 1.000 0.619*
Relative humidity 1.000
Table 2. Spearman correlation coefficients of the AECOPD cases with air pollutants and meteorological
factors. *p < 0.05.
Scientific Reports | (2022) 12:8711 | https://doi.org/10.1038/s41598-022-12791-4 4
Vol:.(1234567890)www.nature.com/scientificreports/
Figure 3. Relationship between air pollutants, meteorological variables and AECOPD cases (tem, temperature,
hum relative humidity). Y-axis: the predicted value of AECOPD cases as the independent variables changed.
X-axis: the distribution of variables (including P
M2.5, other air pollutants, temperature, humidity and time) in
the AECOPD patients.
associated with NO2 and relative humidity. PM10was not included in the GAM due to the influence of collinear-
ity between PM2.5 and P
M10 (rs = 0.981).
Regression analysis. The relative risks of AECOPD associated with a 10 μg/m3 increase in P
M2.5 on dif-
ferent lag days are displayed in Table 3. After controlling for other air pollutants, temperature, relative humidity,
long-term trends and seasonality, significant associations of PM2.5 with AECOPD cases were found in the pre-
sent analysis. Each 10 μg/m3 increase in P M2.5 led to a 5.8% increase in the risk of AECOPD on day lag 0. Table 3
also provides the results of the cumulative effect of P M2.5 on the development of AECOPD. The results showed
that each 10 μg/m3 increase in PM2.5 led to an 11.4% increase in the cumulative risk of AECOPD on days lag
0–lag 7. The cumulative effect of PM2.5 on AECOPD risk showed an increasing trend after 3 days. Similar results
were observed in smoking and non-smoking patients.
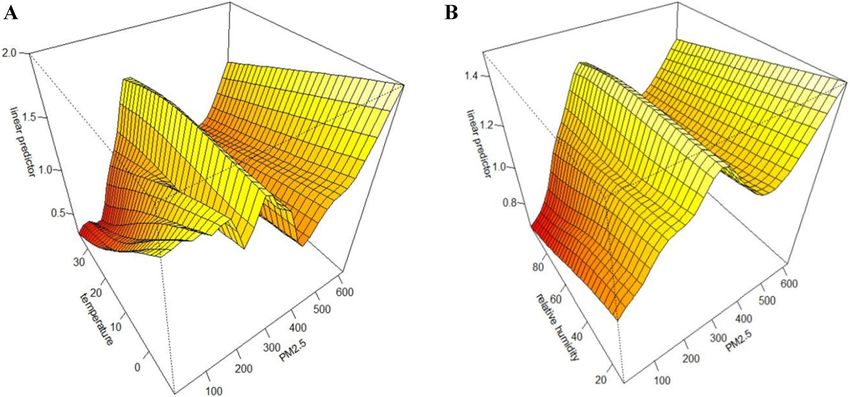
Interaction analysis. Figure 4 displays the interaction of AECOPD cases with different scenarios of tem-
perature and relative humidity using a three-dimensional diagram. After adjusting for the air pollutants, long-
term trends and seasonality, the risk of AECOPD on day lag 0 increased when the temperature and relative
humidity were low, while the significant effect of PM2.5 was not observed for the medium and high levels of
temperature and relative humidity. Figure 5 shows that each 10 μg/m3 increase in PM2.5 led to 7.1% (3.5–10.7%)
and 6.7% (2.8–10.6%) increases in the risk of AECOPD on day lag 0 when the temperature and relative humidity,
respectively, were low.
Sensitivity analysis and model diagnostics. Supplementary Table 2 shows the comparisons of 7 pat-
terns max lag period and R2. We found that the DLNM was robust for the different max lag times, and the deter-
mination coefficient was largest for the 7-day lag pattern (R2 = 0.878). Supplementary Fig. 1 shows the result of
the model diagnostics. We did not observe obvious autocorrelation in model diagnostics using deviance residual
analysis. The model diagnostic results suggested that the DLNMs used in our analyses were robust.
Discussion
This study explored the effect of high-level P
M2.5 and its interaction with meteorological factors on AECOPD
risk in Shijiazhuang, using time-series analyses including a DLNM and a GAM. Our study indicated that a high
level of PM2.5 was positively associated with the risk of AECOPD on present day. The results illustrated that
PM2.5 increased the 7-day cumulative risk of AECOPD. This study also suggested that there was an interaction
Scientific Reports | (2022) 12:8711 | https://doi.org/10.1038/s41598-022-12791-4 5
Vol.:(0123456789)www.nature.com/scientificreports/
Total patients Smokers Non-smokers
RR 95% CI RR 95% CI RR 95% CI
Lag effect
Lag 0 1.058 1.021–1.095* 1.057 1.014–1.103* 1.065 1.019–1.114*
Lag 1 1.001 0.983–1.019 1.001 0.979–1.022 1.004 0.978–1.030
Lag 2 0.992 0.979–1.005 0.993 0.977–1.009 0.989 0.970–1.009
Lag 3 1.001 0.988–1.014 1.003 0.987–1.018 0.997 0.978–1.017
Lag 4 1.011 0.998–1.024 1.012 0.996–1.027 1.010 0.990–1.030
Lag 5 1.014 1.002–1.027* 1.013 0.997–1.028 1.018 0.999–1.037
Lag 6 1.013 0.996–1.029 1.010 0.989–1.031 1.018 0.993–1.044
Lag 7 1.019 0.997–1.042 1.020 0.993–1.047 1.015 0.982–1.050
Cumulative effect
Lag 0–1 1.059 1.019–1.100* 1.058 1.010–1.108* 1.069 1.019–1.121*
Lag 0–2 1.050 1.009–1.093* 1.051 1.001–1.103* 1.058 1.007–1.113*
Lag 0–3 1.052 1.009–1.096* 1.054 1.002–1.108* 1.056 1.000–1.114*
Lag 0–4 1.063 1.016–1.113* 1.063 1.009–1.126* 1.066 1.004–1.132*
Lag 0–5 1.079 1.028–1.132* 1.079 1.019–1.144* 1.085 1.018–1.158*
Lag 0–6 1.092 1.038–1.149* 1.091 1.026–1.159* 1.105 1.031–1.185*
Lag 0–7 1.114 1.055–1.176* 1.113 1.042–1.187* 1.122 1.040–1.210*
Table 3. Relative risks with 95% CI of AECOPD hospitalizations in Shijiazhuang during 2015–2018 based on
10 μg/m3 increases in the fine particulate matter (PM2.5) concentration. *p < 0.05.
Figure 4. The interaction of P
M2.5 and meteorological variables on AECOPD cases at present day in
Shijiazhuang China, 2015–2018, (A) the interaction of PM2.5 with temperature; (B) the interaction of PM2.5 with
relative humidity.
between high-level PM2.5 and meteorological factors on the risk of AECOPD. Low temperature and low humidity
strengthened the effect of P
M2.5 on AECOPD risk.
Convincing time-series studies indicated a positive relationship between PM2.5 and the development of
AECOPD. Notably, each 10 μg/m3 increase in PM2.5 concentration on day lag0 of the onset of AECOPD was
associated with a 1.05% and 0.8% increase in AECOPD in Yancheng and Shenyang city, r espectively12,13. Hwang
et al. found that a 10 μg/m3 increase in P M2.5 was associated with a 0.99% increase in the risk of AECOPD on
day lag0 in Taiwan14. Ko et al. found that a 10 μg/m3 increase in P M2.5 was associated with a 3.05% increase in
AECOPD in Hong Kong15. However, former studies were conducted in Chinese cities with a relatively low-
level annual mean PM2.5 during the study period (45.2 μg/m3 in Yancheng, 60 μg/m3 in Shenyang, 38.8 μg/m3
in Taiwan, and 37.5 μg/m3 in Hong Kong). Previous studies with cross-over designs in Europe and the United
M2.5 in the study period (22.8 μg/m3 in Roma,
States were also conducted in areas with a relatively low level of P
Scientific Reports | (2022) 12:8711 | https://doi.org/10.1038/s41598-022-12791-4 6
Vol:.(1234567890)www.nature.com/scientificreports/
Figure 5. Associations between PM2.5 and AECOPD cases based on different levels of temperature and
humidity.
32.8 μg/m3 in Italy and less than 18 μg/m3 in America)29–31. The differences between the results of our study and
those of previous studies may mainly be due to the differences in pollutant concentrations in the different study
areas. High-level air pollutants in Shijiazhuang may be attributed to the following reasons. Regarding the terrain,
Shijiazhuang is located between the Taihang Mountains and Yanshan Mountains, which form a natural “safe
haven” and block the northwestern wind that prevails in the autumn and winter, leading to the accumulation
of pollutants that cannot be effectively distributed. However, the cities in other studies were located on a plain
(including Yancheng and Shenyang) or close to a sea (including Yancheng, Shenyang, Taiwan and Hong Kong),
which helped disperse the pollutants. Moreover, the density of the population in Shijiazhuang is larger than
that in cities in other countries. There are more than 10 million permanent residents in 14,464 square kilometer
(National Bureau of Statistics, 2021). A larger population density means more potential for pollutant emissions.
The use of central heating in winter is another important reason for the high concentrations of P M2.5, SO2, and
NO2 in Shijiazhuang. November to March is the annual heating season, and 17.8% of the AECOPD burden has
been attributed to P M2.5 associated with central heating19.
A study in Shanghai suggested that the cut-off value of P M2.5 for predicting AECOPD was 83.0 μg/m3, and
AECOPD may be induced by a high concentration of P M2.532. The average annual concentration of P M2.5 reached
85.4 μg/m3 in our study during 2015–2018. Additionally, this study showed that each 10 μg/m3 increase in P M2.5
increased the relative risk of AECOPD by 9% with a 3-day cumulative effect in the cold season and 7-day cumu-
lative effect in the warm season. Specifically, each 10 μg/m3 increase in P M2.5 led to an 11.4% increase in the
cumulative number of AECOPD cases 7 days later. The cumulative effect of P M2.5 on AECOPD risk represented
an increasing trend after three days in our study. Taken together, our findings filled the gap in knowledge of the
relationship between a high concentration of P M2.5 and the risk of AECOPD.
Cigarette smoking (active and passive) has been widely regarded as an established risk factor for AECOPD33,34.
The China Pulmonary Health study showed that a two-fold increase in the risk of COPD was associated with
smoking exposure of 20 pack-years or more (OR 1.95, 95% CI 1.53–2.47). However, the results also presented
a high prevalence of COPD in never-smokers35. Our study investigated the relationship between P M2.5 and
the number of AECOPD patients stratified by smokers and non-smokers. The relative risk of AECOPD onset
was similar among the smoking and non-smoking patients, but the relative risk was slightly higher in the non-
smokers (RR = 1.065, 95% CI 1.019–1.114) than in the smokers (RR = 1.057, 95% CI 1.014–1.103). This result
suggested that the effect of PM2.5 on AECOPD among smokers may be stronger than that among non-smokers.
Moreover, Xu et al. found that non-smokers may be more sensitive to PM2.5 than s mokers36. Therefore, it is
necessary to attach equal importance to preventing the onset of AECOPD among smoking and non-smoking
COPD patients under conditions of heavy pollution.
In interaction analyses, the results showed that the number of AECOPD cases may increase more under high-
level PM2.5 and low temperature or low humidity conditions in the study area. Previous studies in Korea and
London have suggested that exposure to extremely low temperatures is associated with more severe AECOPD37,38.
Available studies in Taiwan and Chengdu both show that lower humidity is associated with an increased risk of
AECOPD17,39. The underlying mechanisms for the increased risk of AECOPD may be explained as follows. On the
one hand, a lower temperature could increase the risk of respiratory infections and decrease lung function40–42.
On the other hand, lower humidity is associated with inducing bronchoconstriction, drying the mucosal mem-
brane along the airway, and therefore increasing the susceptibility to airway bacterial and viral i nfections43. Many
studies in Chinese cities, including Shanghai, Yancheng, and Shenyang, have suggested that the association of
PM2.5 and AECOPD is larger in the cold seasons than in the warm s easons10,11,30. As shown in the results of
the descriptive analysis, higher PM2.5 levels are often accompanied by lower temperature and lower humidity
in cold seasons. A study in Chengdu showed that the association of PM2.5 and AECOPD risk was significant
for temperatures less than 8 °C and humidity less than 60%17. Another study in Chengdu also suggested that
low temperature and low humidity significantly enhanced the effects of particulate matter on COPD morbidity
burden44. Hence, COPD patients need to pay more attention to the concentration of P M2.5, together with tem-
perature and relative humidity in cold seasons.
Our study is the first to report the risk of AECOPD onset under the condition of a high level of PM2.5 and its
interaction with meteorological factors using the DLNM. Several limitations of our study should be acknowl-
edged. First, underreporting bias is inevitable for AECOPD cases. Most AECOPD patients are diagnosed with
Scientific Reports | (2022) 12:8711 | https://doi.org/10.1038/s41598-022-12791-4 7
Vol.:(0123456789)www.nature.com/scientificreports/
obvious symptoms, whereas patients with mild clinical symptoms may not have been diagnosed and may not
have been included in the study. Then, the time-series study missed the personal risk factors that may influence
the risk of AECOPD onset, such as social and economic status and living and working e nvironment45. Most
COPD patients with smoking habits have a long history of smoking and consume a large number of cigarettes
per day46. Many smokers in the process of quitting return to s moking35. Smoking cigarettes permanently and
irreversibly damages patients’ lung function even if they quit the smoking habit later in life47. Doctors thus regard
ever smokers (including ex-smokers) as smokers. Finally, the number of AECOPD cases per day was relatively
small, which might have led us to ignore some relationships between P M2.5 and AECOPD risk.
Conclusions
In summary, our study reveals that high-level P
M2.5 exposure is positively associated with the risk of AECOPD
onset in Shijiazhuang, China, and the effect of P
M2.5 can be modified by the temperature and relative humid-
ity. Non-smoking and smoking patients were both susceptible to the influence of high levels of P M2.5. Public
health professionals and medical service providers should pay more attention to preventing and controlling a
potential increased risk of AECOPD under the condition of high-level P M2.5 together with low temperature or
low humidity.
Received: 22 February 2022; Accepted: 16 May 2022
References
1. GBD 2019 Risk Factors Collaborators, 2020. Global burden of 87 risk factors in 204 countries and territories, 1990–2019: A sys-
tematic analysis for the Global Burden of Disease Study. Lancet 396, 1223–1249 (2019).
2. Zhou, M., Wang, H., Zhu, J., Chen, W. & Wang, L. Cause-specific mortality for 240 causes in China during 1990–2013: A systematic
subnational analysis for the Global Burden of Disease Study 2013. Lancet 387, 251–272 (2016).
3. Fusco, D., Forastiere, F. & Michelozzi, P. Air pollution and hospital admissions for respiratory conditions in Rome, Italy. Eur. Respir.
J. 17(6), 1143–1150 (2001).
4. Frostier, B. & Faustino, A. Fine and ultrafine particles and hospital admissions for cardiovascular and respiratory diseases. Epide-
miology 18, S112 (2007).
5. Roberts, C. M. et al. Clinical audit indicators of outcome following admission to hospital with acute exacerbation of chronic
obstructive pulmonary disease. Thorax 57(2), 137 (2002).
6. Lainscak, M. et al. Body mass index and prognosis in patients hospitalized with acute exacerbation of chronic obstructive pulmo-
nary disease. J. Cachexia Sarcopenia Muscle 2(2), 81 (2011).
7. Almagro, P. & Calbo, E. Mortality after hospitalization for COPD. Chest 121, 1441–1448 (2002).
8. Wedzicha, J. A. & Donaldson, G. C. Exacerbations of chronic obstructive pulmonary disease. Respir. Care 48, 1204–1213 (2003).
9. Guarascio, A. J. et al. The clinical and economic burden of chronic obstructive pulmonary disease in the USA. Clinicoecon. Outcomes
Res. 5, 235–245 (2013).
10. Brook, R. D. et al. Particulate matter air pollution and cardiovascular disease: An update to the scientific statement from the
American Heart Association. Circulation 121, 2331–2378 (2010).
11. Evangelopoulos, D. et al. Personal exposure to air pollution and respiratory health of COPD patients in London. Eur. Respir. J.
58(1), 2003432 (2021).
12. Sun, Q. et al. Association of fine particulate matter on acute exacerbation of chronic obstructive pulmonary disease in Yancheng,
China. Sci. Total Environ. 650(Pt2), 1665–1670 (2019).
13. Chen, C. et al. Effect of air pollution on hospitalization for acute exacerbation of chronic obstructive pulmonary disease, stroke,
and myocardial infarction. Environ. Sci. Pollut. Res. 27(3), 3384–3400 (2020).
14. Hwang, S. L. et al. Fine particulate matter on hospital admissions for acute exacerbation of chronic obstructive pulmonary disease
in southwestern Taiwan during 2006–2012. Int. J. Environ. Health Res. 27, 95–105 (2017).
15. Ko, F. W. et al. Temporal relationship between air pollutants and hospital admissions for chronic obstructive pulmonary disease
in Hong Kong. Thorax 62, 780–785 (2007).
16. Huh, J. Y. et al. The impact of air pollutants and meteorological factors on chronic obstructive pulmonary disease exacerbations:
A Nationwide Study. Ann. Am. Thorac. Soc. 19, 214 (2021).
17. Li, M. et al. The short-term associations of chronic obstructive pulmonary disease hospitalizations with meteorological factors
and air pollutants in Southwest China: A time-series study. Sci. Rep. https://doi.org/10.1038/s41598-021-92380-z (2021).
18. Javorac, J. et al. What are the effects of meteorological factors on exacerbations of chronic obstructive pulmonary disease? Atmos-
phere 12(4), 442 (2021).
19. Qu, F. et al. Comparison of air pollutant-related hospitalization burden from AECOPD in Shijiazhuang, China, between heating
and non-heating season. Environ. Sci. Pollut. Res. 26(30), 31225–31233 (2019).
20. Zhidong, L. et al. Effect of ambient temperature and its effect modifiers on bacillary dysentery in Jinan, China. Sci. Total Environ.
650, 2980 (2018).
21. Liu, Z. et al. Effects and interaction of meteorological factors on influenza: Based on the surveillance data in Shaoyang, China.
Environ. Res. 172, 326–332 (2019).
22. Liu, Z. D. et al. Association between floods and typhoid fever in Yongzhou, China: Effects and vulnerable groups. Environ. Res.
167, 718 (2018).
23. Galway, L. Spline Models for Observational Data (1990).
24. Gasparrini, A., Armstrong, B. & Kenward, M. G. Distributed lag non-linear models. Stat. Med. 29, 2224–2234 (2017).
25. Gasparrini, A. & Leone, M. Attributable risk from distributed lag models. BMC Med. Res. Methodol. 14(1), 552014 (2014).
26. Gasparrini, A. et al. Mortality risk attributable to high and low ambient temperature: A multicountry observational study. Lancet
386(9991), 369–375 (2015).
27. Chen, C. et al. Risk of temperature, humidity and concentrations of air pollutants on the hospitalization of AECOPD. PLoS ONE
14(11), e0225307 (2019).
28. Simon, N. Generalized Additive Models: An Introduction with R Vol. 49, 360–361 (Chapman & Hall/CRC, 2006).
29. Valeria, B. et al. Impact of fine and ultrafine particles on emergency hospital admissions for cardiac and respiratory diseases.
Epidemiology 21, 414–423 (2010).
30. Lepeule, J. et al. Chronic exposure to fine particles and mortality: An extended follow-up of the Harvard six cities study from 1974
to 2009. Environ. Health Perspect. 120(7), 965–970 (2012).
Scientific Reports | (2022) 12:8711 | https://doi.org/10.1038/s41598-022-12791-4 8
Vol:.(1234567890)www.nature.com/scientificreports/
31. Santus, P. et al. How air pollution influences clinical management of respiratory diseases A case-crossover study in Milan. Respir.
Res. 13(1), 95 (2012).
32. Sun, X. W. et al. The cumulative effect of air pollutants on the acute exacerbation of COPD in Shanghai, China. Sci. Total Environ.
622–623, 875–881 (2018).
33. Zhang, S. et al. Short-term exposure to air pollution and morbidity of COPD and asthma in East Asian area: A systematic review
and meta-analysis. Environ. Res. 148, 15–23 (2016).
34. Li, M. H. et al. Short-term exposure to ambient fine particulate matter increases hospitalizations and mortality in COPD: A sys-
tematic review and meta-analysis. Chest 149(2), 447–458 (2016).
35. Wang, C. et al. Prevalence and risk factors of chronic obstructive pulmonary disease in China (the China Pulmonary Health [CPH]
study): A national cross-sectional study. Lancet 391, 1706 (2018).
36. Xu, Q. et al. Fine particulate air pollution and hospital emergency room visits for respiratory disease in urban areas in Beijing,
China, in 2013. PLoS ONE 11, e0153099 (2016).
37. Lee, J. et al. Factors associated with chronic obstructive pulmonary disease exacerbation, based on big data analysis. Sci. Rep. 9,
1–8 (2019).
38. Donaldson, G. C., Goldring, J. J. & Wedzicha, J. A. Influence of season on exacerbation characteristics in patients with COPD.
Chest 141, 94–100 (2012).
39. Tseng, C. M. et al. The effect of cold temperature on increased exacerbation of chronic obstructive pulmonary disease: A nationwide
study. PLoS ONE 8, e57066 (2013).
40. Zhang, Y. et al. Effects of ambient temperature on acute exacerbations of chronic obstructive pulmonary disease: Results from a
time-series analysis of 143,318 hospitalizations. Int. J. Chron. Obstruct. Pulmon. Dis. 15, 213 (2020).
41. Tang, J. W. The effect of environmental parameters on the survival of airborne infectious agents. J. R. Soc. Interface 6, S737–S746
(2009).
42. Donaldson, G., Seemungal, T., Jeffries, D. & Wedzicha, J. Effect of temperature on lung function and symptoms in chronic obstruc-
tive pulmonary disease. Eur. Respir. J. 13, 844–849 (1999).
43. Lam, H. C. Y., Li, A. M., Chan, E. Y. Y. & Goggins, W. B. The short-term association between asthma hospitalizations, ambient
temperature, other meteorological factors and air pollutants in Hong Kong: A time-series study. Thorax 71, 1097–1109 (2016).
44. Qiu, H. et al. The burden of COPD morbidity attributable to the interaction between ambient air pollution and temperature in
Chengdu, China. Int. J. Environ. Res. Public Health 15, 492 (2018).
45. Toy, E. L., Gallagher, K. F., Stanley, E. L., Swensen, A. R. & Duh, M. S. The economic impact of exacerbations of chronic obstructive
pulmonary disease and exacerbation definition: A review. COPD 7, 214–228 (2010).
46. Rassouli, F., Baty, F. & Brutsche, M. H. Significant reduction of COPD hospitalizations after implementation of a public smoking
ban in Graubünden, Switzerland. In European Respiratory Society Annual Congress (2013).
47. Dusemund, F., Baty, F. & Brutsche, M. H. Significant reduction of AECOPD hospitalisations after implementation of a public
smoking ban in Graubunden, Switzerland. Tob. Control 24, 404 (2014).
Acknowledgements
The authors would like to thank Hebei Environmental Protection Bureau and Hebei Meteorological Bureau for
sharing the data needed for this study.
Author contributions
S.W. contributed to the study concept. B.S. had full access to all the data in the study and take responsibility
for the integrity of the data. H.Z. and L.J. contributed to the statistical analysis and tables’ development of this
article. B.S., H.Z., L.J., Z.J. and H.L. interpreted the findings and drafted the article. All the authors contributed
to the critical revision of the article for important intellectual content.
Funding
This research did not receive any specific grant from funding agencies in the public, commercial, or not-for-
profit sectors.
Competing interests
The authors declare no competing interests.
Additional information
Supplementary Information The online version contains supplementary material available at https://doi.org/
10.1038/s41598-022-12791-4.
Correspondence and requests for materials should be addressed to S.W.
Reprints and permissions information is available at www.nature.com/reprints.
Publisher’s note Springer Nature remains neutral with regard to jurisdictional claims in published maps and
institutional affiliations.
Open Access This article is licensed under a Creative Commons Attribution 4.0 International
License, which permits use, sharing, adaptation, distribution and reproduction in any medium or
format, as long as you give appropriate credit to the original author(s) and the source, provide a link to the
Creative Commons licence, and indicate if changes were made. The images or other third party material in this
article are included in the article’s Creative Commons licence, unless indicated otherwise in a credit line to the
material. If material is not included in the article’s Creative Commons licence and your intended use is not
permitted by statutory regulation or exceeds the permitted use, you will need to obtain permission directly from
the copyright holder. To view a copy of this licence, visit http://creativecommons.org/licenses/by/4.0/.
© The Author(s) 2022
Scientific Reports | (2022) 12:8711 | https://doi.org/10.1038/s41598-022-12791-4 9
Vol.:(0123456789)You can also read