Educational Reforms Beyond - Dr. C. W .W. Kannangara Memorial Lecture
←
→
Page content transcription
If your browser does not render page correctly, please read the page content below
NATIONAL INSTITUTE OF EDUCATION
                       MAHARAGAMA, SRI LANKA

         Educational Reforms Beyond
        Kannangara for the 21st Century
       Dr. C. W .W. Kannangara Memorial Lecture

                             Dr. Mohottige Upali Sedere
                                   Rector /CEO
            Sri Lanka International Buddhist Academy (SIBA CAMPUS)
                          Pallekele, Kundasale, Sri Lanka
         & Former Director General of the National Institute of Education,
                               Mahragama Sri Lanka
                             upalisedere@gmail.com

                                     October 12, 2016

Hon C. W. W Kannanagara is truly the father of Free Education in Sri Lanka who had a vision of providing
free education to all at all levels from primary to tertiary in 1944, whereas it was only in 1990, after
Jometien EFA conference, the world development organization advocated at least primary education
must be free for all. After 70 years of free education Sri Lanka has accomplished the Kannangara agenda
with achieved high performance in the socioeconomic indicators. Now the time has come for Sri Lanka
to go beyond the Kannangara agenda to ensure the Sri Lankan children and youth are offered the 21st
skills based education. Though Sri Lanka records high performance in internal efficiency of the
education system, the external efficiency is low due to heavy academic and examination oriented
education and negligence of developing skills. The 21st century learning framework demands generic
skills as a learning outcome. Educational reforms need to address the issue of developing an innovative
curriculum and authenticated learning and assessment systems to ensure the 21st century children of
Sri Lanka to acquire generic skills and to be able to do things than simply have the knowledge of things
with no skills to perform.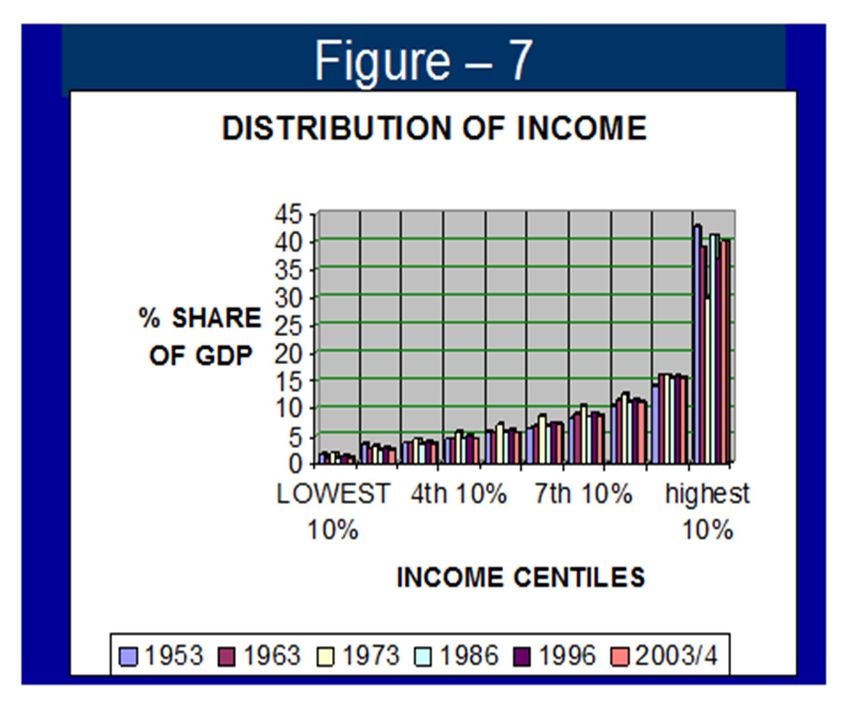
Contents
Introduction: ................................................................................................................................................. 1
   Free Education and Socioeconomic Context of 1943 Reforms:................................................................ 3
   Socioeconomic Up-liftment: ..................................................................................................................... 4
   Is Kannangara Agenda Unfinished? .......................................................................................................... 6
   Socioeconomic Achievements since 1944: ............................................................................................... 7
       Demographic Parameters: .................................................................................................................... 7
   Economic Disparities: .............................................................................................................................. 10
        Distribution of Gross National Income............................................................................................... 10
       Provincial Income Disparities: ............................................................................................................. 10
       GDP Share of Education ...................................................................................................................... 11
   Educational Issues of Today: ................................................................................................................... 11
       Heavy Examination Orientation: ......................................................................................................... 11
       Heavy Academic Orientation: ............................................................................................................. 11
       Educational Process and Low Order Thinking:.................................................................................... 12
       Stereotype Graduates: ........................................................................................................................ 12
   21st Century Educational Expectations: .................................................................................................. 12
       Education and Change: ....................................................................................................................... 12
       The 21st Century Learning Framework: ............................................................................................... 13
       Human Capital and Knowledge Economy: .......................................................................................... 14
       Generic Skills: ...................................................................................................................................... 14
       Emotional Intelligence and the Soft Skills: .......................................................................................... 15
       Development of Skills: ........................................................................................................................ 15
       Skills Oriented Curriculum: ................................................................................................................. 16
       The Generic Skills Are Transferable Skills ........................................................................................... 17
       Instructional System and Assessment System Reforms: .................................................................... 18
       Creativity as a Learning Outcome: ...................................................................................................... 19
   Bibliography: ........................................................................................................................................... 19
Introduction:
Dr. Christopher William Wijekoon - (October 13, 1884 to September 29th, 1969), a legendary heroic
politician is dearly remembered and commemorated today is acknowledge by the Sri Lankans as the
father of free education in Sri Lanka. C. W. W. Kannangara is commemorated by all Sri Lankans because
of the educational reforms that he brought forward in 1944, seventy years ago. Dr. Kannangara
entered Sri Lanka politics with the granting of universal adult franchise to Sri Lankans by the British
colonial rulers in 1932. It is the last decade before independence, was a transitional period of self-
government by the Donoughmore Constitution, which allowed Sri Lankans to elect 46 State Councilors
to the State Council. The Donoughmore reforms granted seven portfolios to the elected Sri Lankan
councilors. Education was one of the seven portfolios. Each of these portfolios had an executive
chairman; The Chairperson of the executive committee was the Minister for the portfolio. Dr.
Kannangara became the first Minister of Education in Sri Lanka and chaired the committee from 1937 -
1946. Donoughmore Constitution placed three critical portfolios with three British officers –Legal,
Finance, and Chief Secretary and they were appointed by the colonial administration. Together with the
elected Chairpersons the ‘Board of Ministers’ was formed. (Note: There was no Tamil representation
because the four constituencies of the Jaffna Peninsula boycotted the election as they felt they were
under-represented.)

Today, Dr. Kannangara is called ‘the father of free education in Sri Lanka’ because of the successful
struggles that he led to grant free education to all who seek access to education. His struggle was not
only with the British Colonial rulers to find financial support for his reforms particularly at the time of
the 2nd world war. His struggle was also with some of his fellow Sri Lankan State Councilors who were
directly or indirectly opposing the free education move. Although the Donoughmore Constitution
placed education under an elected ‘Education Committee’ the implementation of reforms had to be
done through the ‘Board of Education’ that was established by Ordinance No 1 of 1920, placing all
administrative powers and authority of approvals and implementation of programs. The ‘Board of
Education’ inherited more authority than the ‘Education Committee’ and hindered the efforts for
reforms. Yet, Kannangara was determined to push his free education agenda successfully. Prof. J. E.
Jayasuriya, who had the opportunity to work with Dr. Kannangara as the Chairperson of the 1960
National Education Reforms Commission, states that for sixteen years, Dr. Kannangara strove
unceasingly to open wide opportunities for free education for all. The facilitation of the expansion of
free education in the context of the then Sri Lanka was no easy task – (Jayasuriya 1988).

The nation was fortunate to have Dr. Kannangara as the first minister of education because as an
elected politician he had the right commitment and will to bring about a real change to provide free
education and expand it for the common good of the people. This is evident to us because some of the
elected members of the same State Council did not support the move for free education. If one of those
elected members had been the chairperson of the committee, the future of the children of the less
affluent class in Sri Lanka would have been jeopardized, free education would have been definitely

                                                    1
delayed and our present achievements in the domain of human resource development would not have
been achieved. The nation is thankful to Dr. Kannangara as well as to those who untiringly supported
the struggle to bring about free education and expand educational facilities to all citizens of Sri Lanka.
Dr. C. W. W. Kannangara introduced the Education Bill that contained the Free Education scheme on
May 30, 1944 with one of the longest speeches in the legislature. When he concluded his speech on the
adjourned day on June 02, 1944 he sat down under a thunderous applause. M. S. Aney the Indian
government representative who had listened to the whole speech from the distinguished visitors`
gallery immediately rushed from the downstairs, took Dr. C. W. W. Kannangara by both hands and said
to him `You would have been worshipped as a God, had you been in India. To the surprise of many the
hero Dr. C. W. W. Kannangara who brought about the free education and liberated the rural poor, lost
his seat at the next parliamentary elections in 1947. Mr. Wilmet A. Perera defeated Dr. Kannangara
with the help of the affluent rich and the socialists camp. Even the communist in Sri Lanka worked
against Dr. Kannangara’s election. He was elected once again at the 1952 but never made the minister
of education. The merits of today’s events and actions are judged by the next generation. It cannot be
judged by movements of today. Merit of reforms is judged by the benefits that they receive and not the
short term political movement. Kannangara is commemorated as father of free education even after 70
years, though he was ousted immediately after introducing free education.
I do not intend to talk much about each and every reform that the Special Committee of Education
Report of 1943 because there are hundreds of articles and book on his contribution to education. The
major reforms he brought introduced are:
Granting Free education,
Establishing three types of schools – Secondary, Senior, and Practical Schools
Introducing Vernacular medium of instruction at Primary level and bilingual or English
Medium schools for Junior Secondary level and English schools for Senior Secondary and
higher education;
Establishing Central schools with boarding facilities and scholarships to expand access for
higher secondary education;
Introducing Religious education
Facilitating Adult Education for illiterate adults;
Institutionalizing regular monthly salaries for teachers;
Localizing curricula and examinations
Establishing an autonomous university
These educational reforms were introduced in October 1944 after the approval of the reforms by the
State Council. The Practical School that the reforms proposed was not implemented.
The 1944 Educational Reforms generated a process to facilitate schooling. The number of schools,
number of students enrolled, number of teachers serving, number completing primary and secondary
schooling increased significantly. Four hundred (400) new schools were built during the four years 1944-
48 and student enrollment reached 1.2million. The reforms provided night schools for adults as well. Dr.
Kannangara proposed three types of schools – secondary schools leading to university education, senior
2schools leading to polytechnics, and practical schools leading to Agricultural colleges. Although
evaluation supported the Practical schools experimented with under Handessa Schools system in 243
schools, it had an abrupt ending. If the Handessa school system (Grameeya Pasala) was continued and
expanded the crisis of unemployment that Sri Lanka has had to face throughout the recent history (post-
independence period) would have been better addressed.
Free Education and Socioeconomic Context of 1943 Reforms:
One must realize that education cannot progress without the support of other services. Reforms
happened during the 2nd world war. By the 1930s the Sri Lankan villages were wrecked; village
institutions and irrigation systems and the take-over of village lands by the colonial British led to famine
which assisted in the spread of epidemics such as dysentery, cholera, tuberculosis, malaria, etc.
spreading fear and terror among the Sri Lankan peasants. One of the principal issues dealt with and
which has relatively recent origins was the malaria epidemic of 1934-35, though there were earlier
epidemics in the dry zone It was a major cause of death until the late 1940s and depended on the extent
to which conditions favored the malaria carrying vector mosquito both in the dry zone and wet zone
(Meegama, 20121). By handing over of Health portfolio to elected Sri Lankans, side by side health
services too improved during this period. Feeding programs for the poor were introduced under the
Poor Law Ordinance of 1939 and social services expanded. Milk feeding programs and milk distribution
centers started all over the country. The Anti malaria campaign began spraying DDT to stop spread of
malaria. It is important for us to understand that these collective efforts of all departments supported
the progress of education. These programs enabled all school aged children to enroll in schools, and
learn to improve standard of living.
It is important for us to understand the contextual framework of Kannangara Reforms. Why he
supported free education, vernacular medium of instruction, Practical Schools for 80% of the students
and limited access to 05% to Secondary Schools and 15% to Senior Schools. All these recommendations
have a bearing on the socioeconomic context of that era. Reforms were needed to address the issues
those were evident.
Dr. Kannangara opted and dedicated his efforts for change. His intentions were to bring social reforms
through education to address the burning problems of the day. Column two of Table –I presents some
of the critical socioeconomic indicators. People were so poor and they could not afford fee levy
education. The number employed in wage earning occupations was so small. In 1937 only 39% was
literate; female literacy was as low as 12%. Less than 8% had some form of secondary education. Health
situation in the country was very poor and was threatening all socioeconomic activities. The malaria
epidemic was causing 36 deaths per thousand. Birth rates were as high as 38 per 1000. Infant mortality
rate was as high as 141 per 1000. Life expectancy was around 42 years. In a 6 million population
dependency rate was as high as 72% and only 2.6 million was engaged in some occupation and over 50%
1
Meegama (2012): Famine, Fevers and Fear: The State and Disease in British Colonial Period. Nov 30, 2013 -,
Sridevi Publication, Sri Lanka, 2012. www.ips.lk/staff/ed/latest_essays/downloads/2013/famine_fevers_fear_ips.pdf
3was peasants. Only 900,000 were wage earners. Unemployment rates were high. Access to education
and health care was seriously limited.
One should not forget the global situation in this period of time. The 2nd world war broke out at the
same time. Scarcities were growing. Transportation of goods and services became more difficult.
Despite these difficult circumstances the educational reforms were implemented.
During the 2nd world war and immediately after the war the entire world had to address new issues.
Europe, the Colonial Masters, was helped by the Americans with their Marshall Plan. The colonial
administrations were not geared to have development plans for the colonies. The approach to
development was a ‘Charity Based Approach’ (CBA) where things were given on charity. “Charitable
allowances” for the poor (Pin-Padi), free food, distribution of milk etc. were extended to a large number
in Sri Lanka. The Poor Law Ordinance was implemented. The Charity Based Approach to development
continued with adjustments until the 1960s. Free rice ration was a big issue in the 1960s. Situation
changed in the 1960’s. The free rice to all was change to subsidized rice. If education is to be given to
all, free education was the only choice. Vernacular medium was the only choice because only 03% of the
population was literate in English and even finding teachers to teach in vernacular media was difficult.
Reforms advocated 80% of the students to be admitted to Practical Schools because unemployment was
so high and there was no gainful employment for many. The only possible area of employment was
agriculture. The nation was not self-sufficient in rice and food. The peasants were so poor. They did not
own land. Night schools were opened because parents were illiterate and did not know how to deal
with personal, family and community health problems. There were more births and deaths. The village
elite were exploiting the poor. The economic dependency was very high.
Due to then prevailing contexts, free education was the only choice if education was to be given to all.
Vernacular medium was the only choice because only 3% was English literate and even finding teachers
to teach in English was not possible. Reforms advocated 70% of the students to be admitted to Practical
Schools because unemployment was so high and there was no gainful employment for many. The only
possible area of employment was agriculture. The nation was not self-sufficient in rice and food. The
peasants were very poor. Night schools were opened because parents were illiterate and did not know
how to deal with personal, family and community health problems. There were more births and deaths.
The village elite were exploiting the poor.
It is important for all Sri Lankans to realize that many of the developing countries, including all South
Asian countries introduced free education only after the Jomtien conference on Education for All in
March 1990. When the other developing countries were making plans to achieve universal primary
education, thanks to Dr. Kannangara’s vision and leadership, we had already reached those goals by
1990. The Human Development Index of 1990 is a clear indication of this when Sri Lanka recorded 0.65,
it was 0.185 for Bangladesh, 0.29 for India, 0.305 for Pakistan (UNDP 1992).
Socioeconomic Up-liftment:
The impact of the educational reforms of 1944 facilitated an unprecedented social up-liftment in the last
seventy years in Sri Lanka. All governments elected after independence continued to support free
4education and the expansion of education at all levels. In 1960s many colonies were given
independence. The Russian Socialist Economic Policies were spreading as the popular choice in all
former colonies. With that changing global context in the 1960s, the development vision was shifting
from the ‘Charity Based Approach’ (CBA) to the ‘Need Based Approach’ (NBA). Advocacy was for
planned economies. Mrs. Srimavo Bandaranaike’s government (1960 – 1965) facilitated the further
expansion of free education and established a larger number of schools than in any other five year
period in the history of education in Sri Lankan. A large number of schools were up-graded to Maha
Vidiyalayas, opening up Senior Secondary Education to rural student. Her government introduced free
textbooks, mid-day meals and limited curriculum reforms.
The 1972 educational reforms further expanded the facilities and the quality of free education with the
introduction of English, Math and science education to all schools. As a professional who has served in
almost all South Asian countries I value these reforms more because I have realized how much the
Kannangara reforms contribute to the general welfare of all Sri Lankans. The policies and practices that
he initiated and institutionalized were the beginning of a long journey for the betterment of the quality
of life.
If not for the Kannangara reforms we would have been at a similar stage like our neighboring countries.
Although India, Bangladesh, Pakistan has made significant progress since Education for All (EFA)
declaration in 1990, yet they have a long way to go in providing basic education to achieve basic literacy
for all; where-as Sri Lanka stands out amongst all developing nations as the most literate nation.
The current educational issues in Sri Lanka are not about achievement of basic literacy like in India,
Pakistan or Bangladesh. The nation salutes Dr. Kannangara and his close associates for the process that
he initiated, facilitated and enabled us to achieve such distinction over the last seven decades.
Kannangara’s education movement is even more appreciated because India - (Bangladesh and Pakistan
were a part of India then) made a similar move to introduce education reforms in 1944 but the Indian
educational reforms did not make any significant headway. We all know that the political reforms of
1930s’ – 1940s were not only in Sri Lanka. In fact our political movements for independence closely
followed the Indian political movements. That’s why India got independence before Sri Lanka. Similarly
there were education reforms in India and transitional governments vested with similar responsibilities
in the Indian sub-continent yet the reforms died and failed in India. What Kanangara and his associated
brought forward, facilitated and established in Sri Lanka undoubtedly contributed to the pride of Sri
Lanka as an educated nation, not just a literate nation.
Today in Sri Lanka 76% of the younger population (below 40years) has achieved secondary education.
Today Sri Lanka has a population where 62% have had secondary education which is an unprecedented
level of achievement even when compared with developed countries.
I wish to introduce Dr. Kannangara as a reformist of that era. He was one of the leading Change Agents
of that era. He was strongly supported by several State Councilors and without their support
Kannangara could have failed to introduce the changes to the same extent. It is important for us to pay
tribute to all those who untiringly supported Dr. Kannangara in his endeavor for change.
5Is Kannangara Agenda Unfinished?
Many of the recent publications tell us that Kananagra Agenda remains unfinished. The publication by
NIE compiling previous 13 Kannangara Memorial Lecturers (NIE 2001) is also named Kannangara
Reforms as an unfinished task. While saluting
Figure 1: Accomplishment of Kannangara Agenda
Dr. Kannagara for his massive heroic
Since 1940 to 2014
120%
contribution made 70 years ago we need to
100%
understand that a nation cannot keep
80%
implementing the same recommendation of
60%
1943. After 70 years of its successful
40%
20%
implementation of free education policy by all
0% past governments, today Sri Lanka is one of the
Percentages
Non-chooling
Series1 68% 26% 15% 8% 1%
best performing nations in the world in
GCE OL ++ Series2 11% 27% 42% 59% 85% education and health. The UNDP Human
Series3 40% 72% 88% 93% 96% Development Report of 2015 places Sri Lanka in
Literacy
Status from Year 1940 to 2014
the 73rd position with a Human Development
Index (HDI) of 0.757 amongst 188 countries, The World Human Development Report – 2004 placed Sri
Lanka in the 96th position amongst 177 nations, with HDI of 0.74. Sri Lanka stands above all South Asian
Countries (India, Bangladesh, Bhutan, Nepal, Pakistan, Afghanistan and Maldives) as well as above many
South East Asian nations (Thailand, China, Indonesia, Philippines, Vietnam, and Myanmar et al.).
Table – 1: Some Selected Socioeconomic Indicators
INDICATOR 1940 1960 1980 2003/4 2014
Population Million 6.2 9.8 14.7 19.2 20.5
Literacy 40% 72% 88% 93% 96%
Life Expectancy 42 61 69 74 75
Infant Mortality per ‘000 live births 141 68 34 17 15
Birth Ratio per ‘000 38.4 36.6 28.4 18 17
Death Ratio per ‘000 20.3 8.6 6.2 6 6
Population Growth Rate 3.2% 2.8% 2.1% 1.3 0.8
% No Schooling 68% 26% 15% 8%percentage is just 02%, this is very likely the severely disabled children; all others are in schools. While
the blue line dropping to lowest levels below the green-line, the rate of literacy is climbing from 40% in
1940 to 96% by 2014. The red-line (middle line) is the line that indicates the percentage completing
Secondary Education with GCE O/L. Only 11% were in Secondary schools in 1940. By 2014, repeating
GCE OL many times by some, eventually nearly 70% of the cohort completes GCE O/L education.
Dr. Kannangara’s agenda had targets; 80% for practical schools, 15% for Secondary and 5% for Senior
Secondary.
Today 40% enters GCE A/L or Senior Secondary, 98.5% completes Primary education, 90% completes
Grade 9 (the compulsory education), and 85% sits for GCE O/L and 64% who appears for the first-time
pass GCE O/L, and 70% completes O/L in 2nd and 3rd sittings. These clearly indicate with gratitude that
Kannangara agenda has been successfully accomplished. The literacy level is 96.5%. Moreover, we are
hopeful of a society with over 90% will complete Grade 11 by 2020. These are no easy achievements for
any nation.
I wish to illustrate the progress that Sri Lanka has achieved over the last seventy years as a preamble for
the way forward for current educational reforms.
Socioeconomic Achievements since 1944:
Despite spending on the civil war, Sri Lanka has graduated to the status of a Middle Income country. We
are no more a Low Income Economy. Our per capita income reached $1000 by 2005; and the US$3785 in
year 2014 (Central Bank 2015)..
Table 1 shows the significant developments that Sri Lanka has achieved in the last seven decades. All
governments irrespective of the political party governed the country have contributed to the success
that Sri Lanka has achieved. When most of the countries are under the threat of HIV/AIDS we are not
threatened by such diseases.
Demographic Parameters:
Figure 2 and Figure 3 illustrate very critical health indicators for a nation. In 1940s many died at birth.
The life expectancy was only 40-years; meaning at the time of birth average age a person live was
Figure 2: Comparative Picture of Infant estimated as 40 years. By 2014 the life expectancy
150 Mortality Vs Life Expectancy 1940 - 2014
at birth has reached 75.4 years for men and 79.5
Infant Mortality Vs Life Expectancy
years for women which is on par with most of the
developing countries and is the highest level
100 Life Expectancy
recorded by any of the Middle Income countries.
The population growth is near freezing with 0.8%
growth one can be hopeful of zero growth by
50
2020.
infant mortality
0 In 1930s men and women were suffering from
1 2 3 4 5 infertility due to repeated malaria attacks. Figure 3
1940, 1960, 1980, 2004, 2014
7Figure 3 : Comparative Trends in Death, Birth Figure 4 1940 - 2014 Age 5-18 Schooling
Death, Births and Population Growth and Population Groth Rates 1940 - 2014 Population and the Per Capita GDP
8000
50 Birth Ratio per ‘000 GDP PER CAPITA 5-18 Population
Death Ratio per ‘000
40 Population Growth Rate 6000
Average
30 4000 family
Average number
4
20 family
2000 number
8
10
0
0
1940, 1960, 1980, 2004, 2014 1940 1960 1980 2004 2014
1 2 3 4 5 Years 1940 to 2014
Figure 5 : 1940 - 2014 Number of
Figure 6 : Structural % Share of Sri
Public Schools
Lanka GDP from 1940 - 2013
60.5
55 56 59.3 59.3 59.5 58.5
1980 53 51
2004 2014
43
1960 9414
9887
33 28.6 28.7 29.3 30.4 31.3
5000
1940 11
6 12 11.9 11.2 11.1 8.2
2400
1 2 3 4 5 6 7 8 9
1 2 3 4 5
1940 2000 2013
Agriculture Industry Service
shows the women and infant death rates were alarming and life expectancy was as low as 40years.
Infant and maternal deaths and child disabilities were high.
Figure 4 illustrates in 1950 to 1970 though the death rate was going down, the birth rates were high and
there was a population explosion and average family size was near 08 persons (with 5 children). Today
the crude birth rate and death rate are down and in par with most of the developed countries such as
United States and New Zealand. Population growth rate is below one (0.8) and by year 2020 it is
expected to be around zero population growth. Today the average family size is 4 (with 02 children).
In 1960s government had to build more schools to accommodate the growing population (see Figure 5)
and during the period 1960-65 alone over 5000 schools were built. Today the actual number of
schooling aged children is on the decline and there are too many schools. Today Sri Lanka has 9887
schools and number of schools has dropped from 10,093, by 206, due to decrease of student numbers
or due to non-viability.
The Figure 6 illustrates that in the 1940s agriculture sector was the most predominant employment
sector; over 50% of GDP was from agriculture sector. That is a symptom of a primary economy. With the
gradual expansion of education due to 1944 reforms education and social up-liftment happened; by year
82014 the agriculture sector employment rate is dropped to 08%, and Service Sector and Production
sectors jointly has taken 92% of the employed. The Kannanagra reforms have contributed to a total shift
in the economic structure.
Table 1 illustrates that over the decades how the unemployment has significantly dropped from 20% in
1980s to 4.5% by 2015. Dependency rates have dropped. However, unemployment amongst the 18 – 25
age groups is high as 25% and this remain the critical issue to be dealt in educational reforms. According
to the recent statistics over 500 leave for foreign employment daily, which is higher than the number
Figure 8: Sri Lanka - Per Capita
Income in US$ 1940 - 2012
3795
Source Central Bank (2015)
997
540
187
1
0
1940 1960 1980 2004 2014
provided with new employment in country. While the per capita GDP increasing the population growth
rates declining. Smaller families with increased incomes are seen in the last five decades (See Figure 7
and Figure 8). The bottom line of the discussion is that our socioeconomic conditions have significantly
improved and sustained over the last few decades. Moreover, the individual monthly income as well as
the number employed in a given house hold has significantly increased. The incomes of everyone,
including the poorest household has significantly increased.
Today’s educational reforms have to seriously take note of these socioeconomic changes. The same
system of education that we have had for the 20th century will not serve the nation and particularly the
youth. The educational policies need drastic changes.
The bottom line of the discussion is that our socioeconomic conditions have been significantly improved
and sustained over the last few decades. Moreover, the individual monthly income as well as the
number employed in a given house- hold has significantly increased. The incomes of everyone, including
the poorest households has significantly increased. The graphical illustrations in the rest of this paper
show these trends.
9Economic Disparities:
Distribution of Gross National Income
However, it is also important to note some of the negative trends in the recent years in this domain.
Although the Per Capita GDP has increased the disparity
Table : 2
INCOME DISTRIBUTION IN SRI LANKA in the distribution of incomes has not decreased. Figure
2013 (Source: Central Bank 2014) 9 and the Table 2 present the disparity in the
Highest 20% 54.1 distribution of incomes. The lowest income earning
Middle 41.4 20% of the population, amounting to 4million people,
Lowest 20% 4.5
live on 04.5% of the national income, as the GNI being
Gini Coefficient (Households) 0.49 Rs.10,052 billion (2013), meaning the per capita annual
Gini Coefficient (per Person) 0.49 income of the lowest 20% averages to annual income of
Gini Coefficient (Income 0.55 Rs.114,000/ or a monthly income of Rs.9,500/, while the
Receivers) highest 20% of the people earning a per capita annual
Figure 8: Behaviour of Population, Unemployment and GDP and GDP Growth
income of Rs1,357,000 or a monthly income of
Figure 9: Behaviour of Population, Unemployment
Growth 18Rate 1970 - 2013 Rs.113,000. This means the highest income
16
14 earning 20% earns more than 12 times the
12 lowest 20% of the people. The monthly
GROWTH RATE %
10
8 income of a person in the top 20% is higher
6
4 than the annual income of a person in the
2 lowest 20%. This is the average income of a
0
1970 1980 1990 2005 2006 2007 2008 2009 2010 1011 2012 2013
person and a family with 4 person in the lowest
Population Growth
2.8 2 1.5 1.1 1.1 1.2 1.1 1.1 1 1 0.9 0.8
Rate 20% of population has an income of Rs.38,000/
Unemployment % 16 10 9 7.7 6.5 6 5.2 5.8 4.9 4.2 4 4.4
GDP Growth Rate 4.6 3.4 3 6.2 7.7 6.8 6 3.5 8 8.2 6.4 7.3
a month; whereas the highest 20% with 4
persons in the family gets an average income
of Rs.540,000/ a month. The rest of the 60% in
the middle gets an income in between these estimates. The Gini coefficient being 0.5 also indicates the
wide disparity in the distribution of incomes.
Provincial Income Disparities:
The disparities are also evident across the provinces, districts, and communities. Regional income
inequality has been increasing in Sri Lanka during the past few decades. The Western Province of Sri
Lanka represented 5.7 percent of the total land area and 28 percent of the total population but the
Western Province contribution to the Gross Domestic Product (GDP) increased from 43 percent in 1996
to almost 50 percent in 2005. Meanwhile, contribution made by three other provinces together, namely
Sabaragamuwa, Central, and Uva to the total GDP decreased from 24 percent to 19 percent. The
Western Province alone contributed to 2/3 of the services sector in Sri Lanka. According to various
sources, the Western Province of Sri Lanka represents lion’s share not only in production but also in
economic growth rate, aggregate consumption, investment, employment, industrial production,
10infrastructure availability, energy consumption, etc. (Karunaratne 2007, Karunaratne 2002).
Karunartane illustrates that 47% of the employment is in the Western Province and certain provinces
got a very low share of the expansion of the service sector employment opportunities. However,
Karunaratne also make a strong point that the poverty levels taking the international One Dollar a day
criteria only 6% of the Sri Lanka population is below poverty level. However, the income disparities have
to be addresses and a safety net for the poor is essential.
GDP Share of Education:
Another observation is that the GDP share for education has decreased over the last few years. Sri Lanka
was the first nation amongst the developing nations to allocate 3.5% of GDP to education in 1973 with
the education reforms for quality improvement in education. It has now dropped to 2.2%. Same is the
case with all investment expenditures other the recurrent expenditure. This situation in the past was
largely due to the expenditure on war. Yet, it is a fact that public investment has decreased since 2001.
An attempt must be made to increase the share at least to the level of 3.5%. The World Bank
recommends 4% - (Source: Please note all graphs are based on Central Bank of Sri Lanka Statistics).
Educational Issues of Today:
Although the system of education has demonstrated high internal efficiency with fewer dropouts, grade
repeaters and high completion rates, the system suffer from several serious issues and low external
efficiency (employability of the graduating cohorts). Some of the predominant features of our formal
education system are discussed in brief here to facilitate the reader to understand the 21st century
reforms context.
Heavy Examination Orientation:
Heavy examination orientation has brought adverse effects on the total development of the student.
Over all development of student personality is seriously neglect or ignored by students and parents as
students forgo all other co-curricular activities, social activities at school, home and community to
attend coaching classes. Examination has created an unhealthy out-of-school coaching culture that has
devalued the school and education. Sri Lanka having achieved a very high degree of success in
enrollment and completion of general education at different phases of education, public examinations
receives too much attention of student, parents and school. This is an area that Sri Lanka has gone
against the Kannangara reforms. In Kannangara Reforms it was said to localize examinations. Despite
of many efforts by NIE and MOE, the Department of Examination has been successfully denied the
localization. The introduction of School based Assessment (SBA), rather than improving SBA to gain
validity and reliability, the Department of Examination discarded its value and further centralized
examinations opposing the Kannangara reforms agenda. This certainly remains an unfinished task.
Heavy Academic Orientation:
Further, examinations are loaded with cognitive material and the school system has failed to realize its
broad goals and objectives. The academic education and paper-pencil examination system and poor
quality of examination questions make the student to a culture of rote memorization. A student spends
11time to read and understand subject content neither develop any life skills nor the application of
knowledge to solve problems. The learning is passive and often confined to a learning culture with in a
classroom. Entire examination system has cultivated and strengthened the testing of academic content.
Educational Process and Low Order Thinking:
The Anderson (2001) taxonomy clearly demonstrate that knowledge and understanding
(Comprehension in Bloom’s Taxonomy), are Lower Order Thinking (LOT) abilities. The Higher Order
Thinking (HOT) abilities such as Analysis, Evaluation and Creativity are not given the necessary emphasis
in school and classroom instructional processes and more over in the school tests and public
examinations. Recent MSc studies, 09 MSc thesis projects, done at Post Graduate Institute of Science
(PGIS) with the author has very clearly demonstrated at GCE OL examination papers in science has very
little HOT abilities tested. The instructional systems are totally examination oriented and hardly there is
instructional practices those cultivate authenticity, practice, and learning of skills. The result of this is we
have educated youth who are with no generic skills, values and adoptability.
Stereotype Graduates:
The system of education is too stereo-type. The education process is so homogeneous with one set of
textbook, a common set of school subjects, classroom based teaching, and teacher centered learning
process. There is very little space for a student to pursue his or interests. Child’s ability is only seen
through the paper-pencil examinations. There is very little learner centered learning. Child is always
compared against the other students and no real value is added to an individual. These conventional
teaching and conventional school curriculum and instruction provide stereotype graduates with no skills.
21st Century Educational Expectations:
If Dr. Kannangara is given the task of addressing today’s education sector issues, will he come up with
the same recommendation that he made in 1943? We all know that he will not because he would have
considered today’s context of reforms.
The socioeconomic context of today is very different from what it was in 1940s. My attempt from this
point onwards is to address concerns for the way forward for educational reforms.
Education and Change:
Education is the most powerful tool of change. Education gives an individual the capacity to adapt to
change. Education can prepare people for change. Education can initiate change. Building awareness of
the self, society and human welfare more and more rests upon education. Education is considered the
best strategy of initiating, achieving, and sustaining progress and development. Moreover, education
can mitigate disparities in society amongst people. Education is a powerful tool in conflict resolution. In
short education is the most powerful tool of brining in any change and sustaining it.
Not everyone welcomes reforms and change. Not everyone aspires to set targets and reach targets.
Not everyone is futuristic. Envisioning is a hypothetical situation. No doubt that there are risks. All
reforms are not supported by all. One should always expect opposition in the cause of introducing
12changes and reforms. Do not forget that Dr. Kannangara after 16 years of dedicated service to education
sector was defeated at the first
elections after independence.
Preparing the younger generation to
face the rapidly changing global
surroundings is the challenge that
education is faced with. It is not a
matter of bringing new knowledge to
the school curriculum. Shaping up of
the total personality of the child to
face the future challenges is becoming
increasingly more important. The
challenge today is to facilitate the
development of full-potential of each
and every individual learner for the
benefit of that individual and the
larger society. The more we delay reforms the more will our children be kept away from the rapidly
changing socioeconomic arena and they will miss opportunities.
The reformists should understand this hypothetical premise better than the common citizens because it
is the task of the professionals to analyze trends and do the envisioning of education. Education will
become the most powerful tool under the new wave because general education will not be sufficient to
face the emerging challenges. This demands more intellectual skills than knowledge.
The 21st Century Learning Framework:
The 21st century learning framework came into light in USA with the dawning of the new millennium,
and already 16 years of the 21st century is gone, yet Sri Lanka has not seriously look at the framework.
The Canadians have adopted it and call it the ‘Shifting Minds’3. Almost all developed countries have
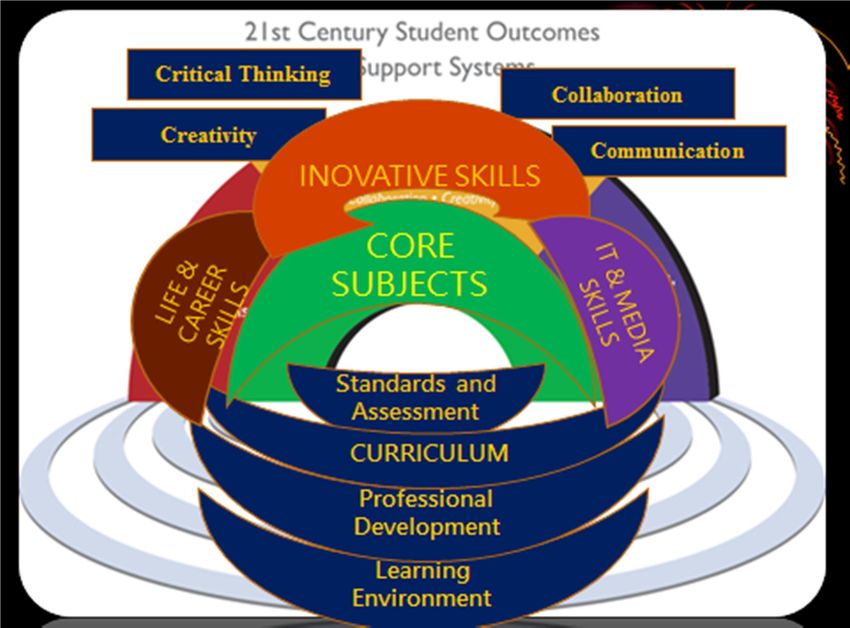
adopted the framework as the main working document of educational reforms. The Figure 10 presents
the framework.
The 21st century learning framework (P21Century Learning Framework4) looks at ‘Learning Outcomes’ as
skills. The core-subjects that we generally offer in school curriculum need to be strongly linked with
Standards and Assessment, not examinations. Assessment is much needed, but not the tests and
examinations in the conventional sense. The Assessment and Standards are for learning, as a formative
process of helping the learner achieves what is expected as learning outcomes. To enable the learning
process need “Professional Development” as to facilitate learning and create the ‘Learning Environment’
to ensure the type of learning outcomes expected by the framework. These learning outcomes are
identified in three clusters:
3
Shifting Minds 3.0 - C21 Canada, Shifting Minds 3.0: Redefining the Learning Landscape in Canada
www.c21canada.org/wp-content/uploads/2015/05/C21-ShiftingMinds-3.pdf .
4
http://www.mabankisd.net/upload/page/0075/Framework%20for%2021st%20Century%20Learning.pdf
13 Life and Career Skills
Information Technology and Media skills
The 4Cs – Critical Thinking Skills, Communication Skills, Collaborative Skills and Creativity
This means all content that we identify for learning and presented for learning must relate to life skills
and career skills. All subject matter needs to use IT and Media skills; all subject matter learning ensures
a learning process that facilitates critical thinking skills, collaborative skills, communication skills and
creativity. In the Sri Lankan schools unfortunately the teacher and the learning environment belongs
the 20th century thinking. Teacher centered, classroom based teaching has to be replaced with child
Centered, out of classroom, out of school learning culture.
Human Capital and Knowledge Economy:
The 21st Century is into a knowledge economy. The knowledge economy demand human capital than
knowledge. Oppose to ‘human resource development’ in the 20th century thinking particularly in the
1980s. Human capital means the general skills level of the labor as an investment. Formal schools have
to address this - Lucas (1988), Sedere (2010). Sedere (2010) further stated that the transformation of
educational institutions by changing the instructional methodology creating more space for information
technology based learning and giving more space for creative learning and totally shifting from
examinations to assessment systems.
These new developments in the field of education cannot be delayed for our children. Just the way free
education and vernacular media and cultural revival was needed in a growing socialist world to establish
the ‘Nation States’ and ‘National Citizenship’ in the 1940 – 60; today we are faced with the challenge of
initiating and facilitating an educational reforms process to lift our children to share the ‘Global Village’
to become ‘Global Citizens’. Global trends are sweeping across the globe. Socialist ideology spread fast
in 1940 – 70s. Democratization is now sweeping across the globe and socialist ideology has lost its
place. Even the Red China has embraced globalization. Just the way the Industrial Revolution spread to
all corners of the globe, globalization will continue to spread and the boundaries of all nations will
continue to disappear making the globe a common place to share. The challenge is for us to bring about
change, striking a balance without destabilizing our national identity. We need to produce a global
citizen with Sri Lankan identity to successfully reap the benefits of the emerging world.
Generic Skills:
Generic skills are the transferable skills that the learner acquires. These skills are the critical skills those
facilitate adaptation to different situations in life, in career, workplace and in society. Today, all
countries where 21st Century Learning Framework has been adapted have framed school curricular and
syllabi with Generic Skills. Communication skills, Collaborative skills, Critical Thinking Skills, Creativity
are generic skills those can be learnt or mastered from any core-subject if the instructional methodology
facilitates the enhancement of these skills. This can be clearly seen in the school curriculum in all most
all States in North America (USA & Canada), Australia, New Zealand, Finland, Scandinavia, and South
Korea. Sri Lanka continues to remain with academic content loaded examination oriented academic
education system where generic skills are not given much attention or very little place.
14Emotional Intelligence and the Soft Skills:
In the 20th century a person’s human abilities was largely accounted to the level of intelligence or the
Intelligence Quotient (IQ) of the learner. In the 20th century, high achievement was correlated with IQ.
However, in the last decade of the 20st century, in 1990s, many research studies challenged the IQ
dominance. There were many studies those demonstrated the success of a person’s life - personal life,
career life, social life etc. does not necessarily depend on IQ only, but more on the emotional quality of
the person. The theory of Emotional Intelligence (E!) came up and several key personalities advocates
were J. D. Mayer, D. R. Caruso, P. Salovey, (1999) and Daniel Goleman (1998). They advocated with
evidence that Emotional Quotient (EQ) is more important for success in life and career than IQ.
The soft skills are another important advocacy, very much link with EQ. The soft skills are for
interpersonal relations. These are people’s skills. Listen skills, speaking skills, understanding the feelings
of others, empathy, ability to share and work together are the main soft skills. Today these skills are
very much needed in the use of digital media as well. The emotional control is seen in the
communications. These need to be cultivated through the learning process in school. Hardly these skills
are given any importance in formal school or higher learning institutions.
Development of Skills:
The efforts in the last six decades were more on increasing the ‘internal efficiency’ of the system by
ensuring all schooling aged children are enrolled, retained and graduated within the set time frames for
each level. Although there are internal efficiency issues yet to be resolved, Sri Lanka’s top priority for
today is to address ‘external efficiency’ issues to ensure employability of the graduate. This means how
well the education system could be knitted with the growing global economy to ensure employability of
the graduates at different stages of the education cycle. This is a realistic objective to address because
nearly 30% of our school leavers remain unemployed for some time before get to employment. This will
also address the youth unrest to a larger extent and contribute towards social stability. This can be
done only by enhancing skills of each and every learner. Vooget and Roblin (20105) reviewed all 21st
century skills and raised the following questions and are the valid questions that our education system
needs to address. The main motive for this approach is to empower young people for the change from
an industrial society into a knowledge society - (De Bruijn (20146). However Brujin’s position is that most
of these skills were there and nothing new.
How to integrate skills and competencies to the formal school curriculum?
What does the implementation of the 21st century skills demands from the teachers, students,
educational administrators?
How can different educational contexts, outside the formal school support the acquisition of
skills?
How ICT could contribute to bridge formal and informal learning of skills?
5
Vooget J and Roblin N. P. (2010): 21st Century Skills, Kennisnet, University f Twente, Netherlands;
http://archief.kennisnet.nl/fileadmin/contentelementen/kennisnet/Bestanden_Feddo/21st-Century-Skills.pdf
6
De Bruijn Stephanus M. (2014); Proceedings of the Third International Conference on Argumentation and
Rhetoric, Sept. 4, 2014,Partium Press, Oradea
15 What specific types of support the schools would be required to facilitate skills enhancement?
What changes to be introduced in the assessment of learner achievement and acquisition of
skills?
What changes to be introduced to national examinations to incorporate skills?
In my professional opinion, formal education needs to enhance the “Generic Skills’, ‘IT and Media Skills’
and ‘Creativity’ in learner. The generic skills prepare the student with transferable skills to any
vocation. There are two major issues need to addressed in enhancing those three types of skills
(Generic, IT and Creativity) those facilitate employability through formal general school education.
Formal school systems are largely following academic education, paper-pencil examinations and
classroom based teacher centered teaching as discussed earlier in this paper and published work earlier
(Sedere et al; 20147).
1. How the formal school curriculum is to be reformed from ‘Content and Academic Oriented
Curriculum’ to a ‘Skills Oriented Curriculum’?
2. How could the teacher, the school and classroom, and the teacher and the teacher centered
instructional system; the learning environment, be transformed to support the 21st century skills
learning?
Skills Oriented Curriculum:
Skills oriented curriculum is usually found in the Vocational and Technical Education (VTE). However,
the VTE is directly training to perform specific jobs and prepare the graduates to be employed in a
specialized area. If anyone thinks that all formal schools have to be converted to Vocational Training
Institutions that is not correct.
Employer in the 21st century demands employable generic skills and personality qualities. This demand
is not only in Sri Lanka even in the United States a special commission had to address this issue in 1990s.
In the United States the Secretary Commission on Achieving Necessary Skills appointed by US Secretary
of Labor has identified what work requires of schools (1991). SCANS skills have been embraced by both
education and business leaders. SCANS has a powerful vision of how fundamental changes in the school
curriculum, instruction and organization can create an educational system that solidly prepares young
people for further education and employment (SCANS 2000, 1997). The SCANS classification of skills can
be read on Internet -Web Site. The SCANS report stated that “Our primary message to schools is to look
beyond the schoolhouse to the role students will play when they leave to become workers, parents and
citizens. Our message to teachers is to look beyond your discipline and your classroom to the other
courses your students take, to your community, and to lives of your students outside school…… Our
message to employers is to look outside your company and change your view of your responsibility for
human resource development.”- (SCANS Principles, 1997). This statement holds true for our own
context as well.
7
Sedere M. U, et al: Study on Evaluation and the Assessment System in General Education in Sri Lanka (2014)
Research Series #3, National Education Commission, Sri Lanka
16The Generic Skills Are Transferable Skills
Skills are not the academic competencies as was spelled out in the 5E method that was advocates in Sri
Lanka Science Curriculum. Of course the 5E was a good beginning to apply constructivist theory of
exploration and definitely a progressive step towards the acquisition of skills. It was poorly practiced in
our schools. Skills-based learning provides classroom environments where independence, thinking skills,
collaboration and active learning are developed at the same time as knowledge is acquired. Mike
Fleetham states that ...“There is a very small yet very significant change in mindset needed if you want
to be a skills-based educator. Traditionally we teachers look at our knowledge curricula then choose
activities we think will best pass on that knowledge, the activities happen to require certain skills.” –
(Fleetham8).
I suggest everyone to look at the curriculum reforms in New Zealand, Finland and some of the States of
the USA to understand how skills are brought into the curriculum. The Finland reforms states in brief as
follows:
The core of change in this world, our doing, knowing and being had changed (Pirjo Ståhle, 20099).
Doing – all important and most influential outcomes are produced by cooperation and
networks.
Knowing – more and more decentralized both technically and socially.
Being – our identity is hard-pressed in a world of constant change and global information flows
The Finland Board of Education10 states:
Pupils are entitled to at least one integrative, multidisciplinary learning module every school
year
• Learning modules integrate skills and knowledge of various school subjects, teachers work
together
• Pupils participate in the planning of these modules
• Goals, content and ways of working are planned and decided at the local level
• They should be interesting and meaningful from the pupils’ point of view
• They realize the principles of the school culture
• They promote the development of transversal competences
We need to identify the various skills a student has to develop to be a beneficiary of the global
economy. It is said that low quality general education constrains the trainability, adaptability and
productivity of the workforce. This is particularly true for social skills and emotional skills. These skills
and qualities are not easy to change once they have taken root at an early stage of life. Learning a living
will help educators in their efforts to transform schools into places where students are empowered and
8
Fleetham Mike : Key Ideas About Skills Based Learning:
http://www.thinkingclassroom.co.uk/ThinkingClassroom/SkillsBasedLearning.aspx
9
Pirjo Ståhle, Mauri Grönroos and Werner Soderstrom Osakeyhtio, 2009, Dynamic Intellectual Capital: Knowledge
Management in Theory and Practice
10
http://www.dge.mec.pt/sites/default/files/Noticias_Imagens/1_curriculum_in_finland.pdf
17prepared for success. There are many studies where the type of skills required by the global economy is
analyzed.
There are generic skills, operational skills, intellectual skills, communication skills, social skills,
technological skills, economic skills, emotional skills and many other skills which need to be developed
at school level. These demands need to be embodied into the general education that we offer. The
translation of knowledge to skills is the challenge that we face today. I have spelled out many of these
skills in my earlier publications (Sedere 2000). The Activity Based primary school curriculum needs to be
further strengthened and expanded to other levels. The global economy demands a dynamic
personality. Adoptability, neuromuscular coordination, democratic behavior, commitment to family and
work, effective personal relations, community participatory skills, emotional stability, courteous
behavior, manners and many other personality traits to cultivated at very early in every child to enable
them to achieve success in their future world (Sedere 2000). Our teachers are attuned to impart
knowledge and they need training and mentoring to be effective teachers to cultivate these new skills
and qualities.
Beside these the 21st century skills need IT and Media skills. IT can be taught as a standalone course as
our schools do today. But it should be practices as a tool of learning. IT and media skills can be easily
built into learning. IT can be embodied into the Junior School curriculum and this must be done at all
tertiary education institutions.
Instructional System and Assessment System Reforms:
Though the curriculum reforms introduce skills based learning, the most important reform is the reform
in the present practice of education at school level. The top priorities for change are the reforming the
learning environment; the professional training of all educators to the new wave of authentic instruction
and assessment. The teacher centered, classroom based learning environment cannot cultivate generic
skills.
Authentic Instruction and Assessment Systems are already in practice in many countries. The Authentic
Assessment Toolbox by Muller (201011) is widely used by teachers. Under my supervision 09 MSc
dissertation projects were done in four different school subjects – Math, Physics, Biology and Chemistry
at Junior Secondary Level - at the Post Graduate Institute of Science (PGIS) at University of Peradeniya
and distinctly these 09 studies shows how skills are enhanced and significantly better learning
achievement is achieved by children. These were done using the same time allocation in school time
table and instruction system empowered the learner to find, explore individually and in groups. Learning
environment and school environment need to be changed from the classroom learning culture to
activity based, skills oriented, learner driven learning systems replacing the word teaching by learning.
Present tests and examinations culture that is enrooted in our education system destroys the reforms as
finally teachers and students teach for the tests and examinations. This can be stopped only by reducing
the value of public examination and replacing the examinations by assessment at school level and giving
11
http://jfmueller.faculty.noctrl.edu/toolbox/
18You can also read