Economic overview: Recent developments in the global and South African economies - IDC
←
→
Page content transcription
If your browser does not render page correctly, please read the page content below
Economic overview:
Recent developments in the global and South African economies
                                                            February 2020
                                    Department of Research and Information

                         1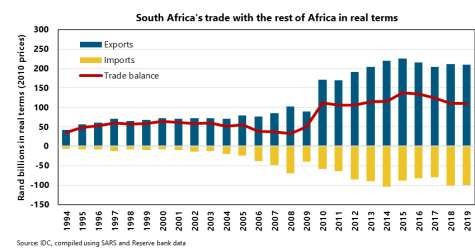
Highlights
Economic   overview

Contents

Highlights ........................................................................................................................................................................................................ ii

Implications for South African businesses ......................................................................................................................................... iii

The global economy’s recovery may be delayed............................................................................................................................. 1

Industrial commodities - relative stability in prices, risks abound ............................................................................................ 4

A positive economic outlook for Sub-Saharan Africa .................................................................................................................... 5

South Africa’s economic performance ................................................................................................................................................. 7

Growth prospects for the South African economy ...................................................................................................................... 14

                                                                                                          i
Highlights
Economic overview
Highlights
The new year has heralded signs of an improved economic performance for the world
economy. Global growth is set to recover some momentum in 2020, projected at 3.3%
by the International Monetary Fund (IMF), up from an estimated 2.9% in 2019.
World economic
Market sentiment has improved on the back of emerging signs that the downturn in growth in 2020:
global trade and manufacturing production is bottoming out, continued monetary
policy accommodation in major economies, the de-escalation of trade tensions +3.3%
between the US and China, and reduced fears of a no-deal Brexit.
(IMF forecast)
The emerging and developing economies as a group are expected to be key
contributors to global growth, despite a further slowing of Chinese economy in line
with its structural transformation strategy. The pace of expansion in advanced
economies is anticipated to return to more normalised levels. While a slower rate of
growth is projected for the United States (US), the Eurozone economy is expected to
achieve a slightly better growth outcome in 2020.
The outbreak of the coronavirus may, however, delay the global economic recovery.
Its potential impact on economic activity in China and globally will depend on how Sub-Saharan Africa’s
swiftly the outbreak is arrested. economic growth in
2020:
Following the signing of the “phase one” agreement on trade between the US and
China, a renewed bullish prognosis emerged for industrial commodities coming into +3.5%
2020. The coronavirus outbreak has, however, impacted negatively on industrial
(IMF forecast)
commodity supply chains due to the mandatory shutdowns of productive operations
in various parts of China in efforts to contain its transmission. At this stage, the
epidemic’s impact on global supply chains is expected to be transitory, with increased
prospects for a recovery in industrial commodity prices after the first quarter of 2020.
Sub-Saharan Africa is expected to post a moderate acceleration of GDP growth to
3.5% both in 2020 and 2021, from an estimated 3.3% in 2019. Economic conditions
will vary widely across the region, with countries that are less reliant on resources
generally likely to record robust rates of expansion, whereas several commodity-
Job losses in
exporting countries may continue facing significant constraints to growth. South Africa over
the year to the
The South African economy finds itself amidst the longest economic downturn on
4th quarter of 2019:
record. Real GDP growth in 2019 is estimated at a mere 0.3%. In the face of weak
demand conditions, economic activity was lacklustre across all broad sectors of the 108 000
economy. In a very low growth environment, the economy could not sustain
employment levels. Approximately 108 000 jobs were lost over the year to the final (StatsSA)
quarter of 2019.
Public finances have worsened substantially in the 2019/20 financial year, with the
budget deficit estimated at 6.7% of GDP and overall gross loan debt of government
projected to rise sharply to a ratio of 61.8% of GDP (IDC projections). Measures to
contain government expenditure are critical, as revenue raising efforts may not
contribute meaningfully towards restoring fiscal sustainability.
Fiscal metrics (% of
Eskom recently announced that South Africans must brace themselves for prolonged GDP in 2019/20):
periods of load-shedding over the next 18 months, so that the utility can embark on
Budget deficit: 6.7%
“philosophy maintenance” to fix its power stations. Although consistent and effective
Gross loan debt of
maintenance is critical, the negative implications for economic growth are government: 61.8%
considerable. Government has announced efforts to address the financial plight at
Eskom, whilst numerous measures are being contemplated to restore its financial (IDC estimates)
situation.
iiHighlights
Economic overview
The lead Moody’s analyst for South Africa was recently quoted as saying that it is too
early to assess progress on undertaking structural reforms that could assist in
improving the economy’s growth prospects and arrest the deterioration in public
South Africa’s
sector finances. This has been interpreted as suggesting that Moody’s might not economic growth in
downgrade South Africa’s rating to sub-investment shortly after the release of the 2020:
2020 Budget on 26 February.
+1.2%
In his State of the Nation Address, President Ramaphosa emphasized the need to “fix
the fundamentals” and executing strategic plans, while acknowledging that there (IDC forecast)
needs to be a social compact as government cannot do it alone. The President
elaborated on action plans regarding the energy, water, telecommunications and
specific industrial sectors, and emphasised the imperative of addressing youth
unemployment as well as restoring fiscal sustainability.
In the shorter term, South Africa’s economic performance is likely to continue being
adversely affected by weak domestic demand, electricity supply constraints, a degree
of policy uncertainty and, among other factors, a challenging global trading
environment. Real GDP is projected to expand by 1.2% in 2020 and, on average, by
1.7% per annum over the five-year outlook period 2020 to 2024.
Implications for South African businesses
Potential implications of global economic developments
Although gradually higher growth is forecast for the world economy over the next
couple of years, the expansion momentum for some of South Africa’s key trading
partners is projected to decelerate, including China, the United States and Japan.
- Businesses targeting these markets may encounter some challenges, with
commodity-based exporters potentially affected by weaker demand emanating
from China. South Africa’s export basket to the world’s second largest economy
is overweight in mining and mineral products, with iron ore, chrome and
manganese as the key export products.
- The United States, in turn, is in the process of altering a key exemption of its trade
law, with implications for South Africa. This move could have adverse implications
for the domestic motor vehicle and parts industry, considering the preferential
access it presently has to the US market. Other product categories at risk of losing
preferential market access include ferroalloys, industrial chemicals, citrus and
nuts, among others.
- The de-escalation of trade tensions between the US and China may alleviate,
albeit to a limited extent, the scramble for alternative global markets by Chinese
and American producers, which risked the displacement of South African exports
or increased import penetration in the local market.
The anticipated gradual, but nevertheless marginal, improvement in Eurozone growth
should be welcomed by business enterprises focusing on its markets. The bloc’s
increased emphasis on green investments, including through considerable fiscal
support, could bring about export opportunities but also threats, such as substantially
reduced demand for thermal coal.
The growth momentum anticipated for Sub-Saharan Africa should provide trade and
investment opportunities for South African business enterprises wishing to expand
their global reach.
iiiHighlights
Economic overview
- Some of South Africa’s key export markets in the region are expected to post
significantly higher growth over the next couple of years, such as Botswana and
Mozambique, thus enhancing export potential.
- Regional market development efforts should also target sizable African
economies with limited penetration of South African products and services.
The coronavirus outbreak is currently denting economic growth in China and affecting
other economies in the process, including South Africa.
- Factory closures in major Chinese industrial centres are affecting exports and
disrupting global supply chains - from parts and components for electrical and
electronic goods, to vehicle parts and accessories, machinery and equipment, etc.
South African businesses that are reliant on such supplies may experience
significant delays in their shipment.
- The disruptions to global supply chains are prompting companies around the
globe to consider diversifying sources of supply to reduce their reliance on China.
This could potentially enhance manufacturing investment activity in African
economies, including South Africa.
- The negative effects of mandatory shutdowns of industrial operations in areas
affected by the coronavirus is affecting import demand in China, including
demand for industrial commodities generally imported from South Africa or
other African economies. Cancellations or delays in import shipment orders will
affect the respective suppliers.
Financial and currency markets are likely to experience volatility from time to time,
with heightened risk aversion towards emerging markets not to be ruled out. This was
evident at the start of 2020, although mostly linked to concerns over the implications
of a potential spread of the coronavirus in China and elsewhere in the world.
Potential implications of domestic economic developments
Fixed investment activity is likely to remain subdued in the short-term, particularly in
certain segments of the mining sector, as well as in manufacturing sub-sectors that
have considerable spare production capacity due to weak demand.
Businesses that rely on public sector procurement, whether of a capital- or
consumption spending nature, are likely to encounter reduced demand due to
financial constraints facing government in general and several SOEs.
Prolonged periods of load-shedding over the next 18 months will affect the
operations of business enterprises basically across the board. However, based on
recent experience, the release of relatively reliable load-shedding schedules will
improve predictability, enabling firms to plan their production runs.
Various opportunities for investment and business activity may be inferred from
President Ramaphosa’s State of the Nation Address (SONA), including:
- The expanding potential for energy generation by independent power producers
(IPPs) through the implementation of the IRP 2019 and, among others, by
permitting municipalities in good financial standing to procure directly from IPPs.
Importantly, limits to embedded generation will be removed and prescribed
application processing times adhered to.
- The broadband roll-out, considering that the licensing process by means of
auction will be concluded before year-end.
ivHighlights
Economic overview
- Co-financing opportunities in the pipeline of projects associated with the
Infrastructure Fund.
- Industrial development opportunities associated with the green economy will be
opened up through the finalisation of the Climate Change Bill, which aims for a
just transition to a low-carbon economic growth trajectory.
- The implementation of various master plans. The automotive, CTFL, poultry, sugar
and steel master plans were specifically mentioned.
- A strong focus on SMME development, including the planned designation of
1 000 products for local procurement from this enterprise segment.
- The release of 700 000 hectares of state-owned land for agricultural production.
- The launch of a tourism equity fund in 2020 to stimulate the sector’s
transformation.
The substantial worsening of the fiscal metrics is of major concern as it enhances the
probability of a sovereign credit rating downgrade by Moody’s. This agency may,
however, opt for waiting a while longer (that is, beyond the scheduled review date of
27 March 2020), as it assesses South Africa’s progress on undertaking structural
reforms.
As the South African economy is forecast to experience subdued rates of growth over
the next five years, this will require careful planning and strategising by businesses to
withstand the challenging environment, but also to be on the lookout for emerging
opportunities in local as well as global markets.
vHighlights
Economic overview
The global economy’s recovery may be delayed
2019 turned out to be a difficult year for the world economy, and 2020 is off to a challenging
start.
Global growth is estimated by the International Monetary Fund (IMF) to have slowed to 2.9% World GDP growth slowed
in 2019, the weakest pace of economic expansion since the 2009 recession. Growth rates to 2.9% in 2019, the lowest
moderated in most of the world’s larger economies, both advanced and emerging. Adverse rate since the 2009 recession
developments in the global trading and investment arenas, especially the trade war between
the United States (US) and China, were the principal contributing factors. The trade spat
reached its peak in September 2019 when the cumulative trade between the US and China
subject to increased tariffs amounted to USD550 billion.
In January 2020, the US and China signed “phase one” of a trade deal, which placed on hold The recent (limited) agreement
further escalations in tariffs previously threatened. Under the agreement, the US and China on trade between the US and
will, by mid-February, halve the tariffs imposed on each other’s exports in September 2019. China has eased uncertainty
Furthermore, China has committed to USD200 billion worth of additional imports from the levels globally to some extent
US over the next three years.
The two countries also committed to continue negotiations surrounding the outstanding
sources of conflict, including US allegations of inadequate intellectual property protection,
forced technology transfers and competitive currency devaluation by China, as well as the
opening-up of its market to foreign financial service providers. Such positive developments
have eased uncertainty globally to a significant extent.
Figure 1: A mixed picture in the anticipated performance of the economy in 2020
GDP growth projections for select advanced and emerging economies, 2020
7 Circle size reflects projected size of the
economy in 2020 (GDP in USD)
6
China India
$15 269bn $3 202bn
GDP growth rate forecast for 2020 (%)
5
4
3
Brazil
$1 893bn
US 2
$22 321bn
Eurozone
$13 678bn
1
Japan South Africa
$5 413bn $370bn
Decelerating Accelerating
0
-0,75 -0,5 -0,25 0 0,25 0,5 0,75 1 1,25
Differential between GDP growth rate forecast for 2020 and that
estimated for 2019 (percentage points)
Source: IDC, compiled using IMF data
1Highlights
Economic overview
In contrast to the gloom that characterised 2019, the new year has heralded signs of an Signs of recovery in the
improved economic performance. The IMF projects world growth to accelerate to 3.3% in global expansion momentum
2020 and 3.4% in 2021. This outlook is supported by more positive market sentiment on the as some of the headwinds
back of “tentative signs that manufacturing and global trade are bottoming out, a broad- evident in 2019 dissipate
based shift toward accommodative monetary policy, intermittent news on US-China trade
negotiations, and diminished fears of a no-deal Brexit…” (IMF, World Economic Outlook
Update, 20 January 2020)
The emerging and developing economies as a group are expected to be the main drivers of Emerging economies among
growth. India, Brazil, Mexico, Russia and Turkey, among others, should be key contributors, the principal contributors to
while Sub-Saharan Africa is also projected to post a higher growth momentum. The outlook world growth
for the advanced economies is somewhat diverse but generally not as promising, ranging
from marginally higher rates of expansion in the Eurozone, the United Kingdom (UK) and
Canada, to slower growth in the US and Japan.
The moderation in US economic growth is likely to continue, with rates of 2.0% and 1.7%,
projected for 2020 and 2021, respectively. This is based on expectations that fiscal policy
will be neutral (i.e. the previous sizeable tax reductions having worked through the
economy) as well as lower growth support from further loosening of financial conditions.
The slowing economic momentum should encourage the US Federal Reserve to maintain its
accommodative monetary stance.
The Eurozone is anticipated to experience marginally higher growth as its export sector’s
performance improves in a relatively more normalised global trading environment, as well
as due to potential fiscal stimulus, or at the very least an end to fiscal austerity. With the
Brexit focus shifting to the future trading relationship between the UK and the EU, some
uncertainty will remain, although at a lower level compared to 2019.
However, the trade tensions between the US and the European Union (EU) remain
unresolved, while continued weakness in Germany’s manufacturing sector provides reason
for concern. The US imposed higher tariffs on USD7.5 billion worth of EU goods due to the
World Trade Organisation (WTO) ruling against the EU regarding state support to Airbus.
The US continues to threaten to impose increased tariffs on European cars and vehicle parts
due to the sustained trade deficit with the EU. The strong push by European countries to
introduce digital taxes is also raising the spectre of retaliatory tariffs from the US.
The Chinese economy’s ongoing structural transformation underpinned the IMF’s forecasts
of 6.0% and 5.8% for GDP growth in 2020 and 2021, respectively. The conclusion of “phase
one’’ of the agreement on trade with the US is expected to cushion the slowdown to some
extent, but the unresolved disputes with the US will still weigh on economic activity.
Furthermore, the measures being taken by the Chinese authorities to contain the outbreak
of the coronavirus, alongside the accompanying reactions of households and business
enterprises, are having a considerable impact on the economy’s performance, at least in the
first quarter of 2020 (refer to the following sub-section). Stimulatory measures are, and will
continue, being rolled out by the Chinese authorities to support the economy, but these are
unlikely to prevent a downward revision to its growth projections.
Economic growth in India is forecast by the IMF to improve to 5.8% in 2020, from an
estimated 4.8% last year, boosted by anticipated monetary and fiscal stimuli as well as
relatively low oil prices. However, the risk to the growth outlook is significant due to the
disappointing budget announced early in February, which did not introduce the reforms
required to stimulate economic activity as assumed by the IMF.
The Brazilian economy is anticipated to benefit from the passage of pension reforms, as well
as from increased mining activity. This should result in growth recovering to 2.2% in 2020,
from a subdued 1.2% recorded in 2019. Similarly, the Russian economy is expected to report
improved, albeit modest, growth supported by consumer spending and investment activity.
2Highlights
Economic overview
The coronavirus may delay the global economic recovery
The improved outlook for the world economy has been underscored by relatively positive The coronavirus will dent
developments in the trading arena, continued monetary policy support and anticipated economic growth in China
fiscal stimulus, particularly in larger economies. However, the outbreak of the coronavirus in Q1 2020, affecting other
may delay, if not outright threaten the global economic recovery. economies in the process
The Chinese authorities have implemented strict measures to try and contain the spread of
the virus, which has thus far infected over 60 000 people, mostly in China, and claimed more
than 1 300 lives (only 2 outside of China). Such measures have included extending the Lunar
New Year holiday, restricting travel and implementing quarantine rules in certain areas,
especially in Hubei province, the outbreak’s epicentre.
The scale of disruption to economic activity in China has been massive, affecting
manufacturing activity across a broad spectrum of industries due to forced shutdowns; retail
and catering services as consumers stay home; transportation services due to travel
restrictions; and domestic as well as international tourism, both inbound and outbound.
The ramifications are rippling through the world economy. Factory closures in major Chinese
industrial centres, especially Wuhan, are affecting exports and disrupting global supply
chains - from parts and components for electrical and electronic goods, to vehicle parts and
accessories, machinery and equipment, and so on. Moreover, bearing in mind that China is
the world’s second-largest importer of goods, after the US, and that it accounts for about
half of global demand for industrial commodities, cancellations or delays in import shipment
orders are affecting the respective supply markets.
The disruptions to global supply chains are prompting many companies around the globe The diversification of global
to consider diversifying their sources of supply to reduce their reliance on China. This will manufacturing capabilities
reinforce the ongoing gradual shift in manufacturing production out of China, towards ex-China may intensify
regional producers and further afield, including Africa.
Figure 2: China plays at a key role in global supply chains
China's share of world exports: overall exports and select product categories
20
Total exports
18 Exports of machinery and equipment
Chinese exports as proportion of world exports (%)
Exports of electronic components
16
Exports of motor vehicle parts and accessories
14
12
10
8
6
4
2
0
2001 2002 2003 2004 2005 2006 2007 2008 2009 2010 2011 2012 2013 2014 2015 2016 2017 2018
Source: IDC, compiled using International Trade Centre data
The Chinese authorities, along with their counterparts in an increasing number of countries, The economic impact will
are expected to continue taking measures to contain the spread of the virus. Hence, the depend on the extent to
potential impact on economic activity in China and globally will depend on how swiftly the which the virus spreads
outbreak is arrested. Should it be successfully contained within a relatively short timeframe, globally and the timeframe
the impact will be transitory, albeit still meaningful. Should efforts, however, extend over a within which the outbreak is
protracted time period, the impact could be considerable. Initial indications are that the arrested
resumption of production activity in China will be gradual and orderly, as well as region-
dependent. Importantly, the Chinese government has been front-loading, via public
spending, portions of the fiscal stimulus budgeted in support of growth.
3Highlights
Economic overview
Industrial commodities - relative stability in prices, risks abound
The deterioration in trade relations between the US and China was the dominant driver of China accounts for around
industrial commodity markets’ performance throughout 2019, weighing on dry bulk 50% of global demand for
commodity trading activity and prices. The negative effects propagated into industrial value industrial commodities
chains, hampering manufacturing production and import demand in China, which accounts
for approximately 50% of world consumption of industrial commodities. Such developments
had a sustained negative impact on investor sentiment across the industrial commodities
complex, except for markets that experienced major supply-side disruptions (e.g. iron ore).
Figure 3: Prices of key minerals exported by South Africa appear to be finding increasing support
Relative commodity price performance, China's manufacturing PMI,
South Africa's exports of major mineral commodities
% of SA
merchandise
300 China Manufacturing PMI (RHS) 53 SA exports exports
Oil (2019) (2019)
Platinum Thermal coal R68.5bn 4.8%
Commodity price indices (index base = 100 (Jan 2015)
250 Gold 52
China Manufacturing Purchasing Managers Index
Thermal Coal
Iron ore Iron ore R83.6bn 6.4%
200 Manganese 51
Chrome
Gold R66.7bn 4.3%
150 50
Manganese R45.2bn 3.5%
100 49
Chrome R27.7bn 2.1%
50 48
Platinum
R119.6bn 8.3%
Group Metals
0 47
Nov-15
Nov-16
Nov-17
Nov-18
Nov-19
Jan-15
Jan-16
Jan-17
Jan-18
Jan-19
May-15
May-16
May-17
May-18
May-19
Jul-15
Jul-16
Jul-17
Jul-18
Jul-19
Mar-15
Mar-16
Mar-17
Mar-18
Mar-19
Sep-15
Sep-16
Sep-17
Sep-18
Sep-19
Source: IDC, compiled using data from Bloomberg and South African Revenue Service
The implementation of various growth-supportive policies in China, including the easing of China’s growth-supportive
industry-specific pollution controls, liquidity stimulus measures and the approval of various policies provided the basis for an
infrastructure-related projects, contributed to the rebound in the manufacturing PMI index improved outlook for commodity
later in 2019 (refer to Figure 3 above), providing a basis for an improved outlook for prices, but the coronavirus
commodity demand in 2020. This was reinforced by the eventual de-escalation of the US- outbreak poses significant risks
China trade war through the “phase one” agreement.
However, the outbreak of the coronavirus has impacted negatively on industrial commodity
supply chains due to the mandatory shutdowns of productive operations in various parts of
China in efforts to contain its transmission. Since these measures have been enforced at the
beginning of the seasonal industrial restocking period – generally running from December
to May - they will delay the recovery in China’s commodity demand. This has negative
implications for industrial commodity prices, at least in the first quarter of 2020, as investor
sentiment is weighed downward by uncertainty regarding both the persistence and global
economic impact of the coronavirus outbreak.
Commodity restocking in
Nevertheless, the restocking of commodities as the disruption eases and economic activity China should support prices
gradually normalises in China is expected to provide support for industrial commodity while uncertainty prevails
prices. Furthermore, China’s ban on the imports of scrap materials of various base metals regarding the impact of the
will have a beneficial impact on seaborne demand for these metals. coronavirus outbreak
4Highlights
Economic overview
Following steep price corrections throughout 2019 due to global market surpluses, which
progressively removed high-cost production capacity, the prices of both manganese and
thermal coal could be supported by the resumption of restocking demand in China as
economic activity ramps up in the weeks/months ahead. The recovery of margins in China’s
steel industry, together with the relaxation in environmental restrictions, should support
steel production, with a beneficial impact on demand for manganese.
Robust demand for thermal coal in south-east Asian economies, along with the reported
curtailment in China’s hydropower generation and rebound in thermal coal fired electricity
generation, could boost seaborne demand for thermal coal and investor sentiment.
Crude oil prices are expected to hold above USD50/barrel, with a bias towards this
psychological support level as a plethora of macro risks weigh on oil market sentiment. The
International Energy Agency (IEA) estimates that China accounted for around 75% of the
growth in global oil demand in Q3 2019 (latest available data). Consequently, continued
uncertainty regarding the economic impact of the coronavirus outbreak should continue to
weigh on oil prices for some time.
A positive economic outlook for Sub-Saharan Africa
Economic growth in the Sub-Saharan Africa (SSA) region is expected to gain some Although expected to
momentum in 2020 and 2021, specifically to 3.5% (from 3.3% in 2019). This is despite the improve, the pace of
rather subdued performances anticipated from the Nigerian and South African economies. economic growth is likely
Economic conditions will vary widely across the region, with countries that are less reliant to be modest on
on resources generally likely to record robust rates of expansion, while several commodity- persistent challenges in
exporting countries may continue facing significant constraints to growth. its largest economies
Notwithstanding this positive outlook for regional growth, relatively high debt levels,
weather-related shocks, continued vulnerability to developments in commodity markets and
in the global trading arena in general, among other risks, could weigh on domestic spending
levels, export performances and investment activity, including foreign direct investment.
Developments in key regional markets for South African exports
Positive economic prospects for several African countries should bode well for South African
exporters. In 2019, South Africa’s exports to the rest of the African continent totalled
R345.7 billion at current prices. Although this represented a 4.8% increase in nominal terms
compared to the previous year, exports in fact declined by an estimated 0.7% in real terms.
Figure 4: South Africa maintains a positive balance of trade with the rest of Africa
5Highlights
Economic overview
The top five African markets for South Africa’s exports in 2019 were Botswana, Improving prospects for
Mozambique, Namibia, Zambia and Zimbabwe. Collectively they claimed a 17% share of South Africa’s 5 largest
South Africa’s merchandise export basket and 24.1% of total manufactured exports. As African markets in 2019
indicated in Table 1, these countries are expected to post faster rates of economic growth bode well for export sales
in 2020, except for Zambia.
Table 1: SA exports likely to benefit from better economic performances in key African markets
Recent growth performance and forecasts for South Africa’s five largest export trading
partners in Sub-Saharan Africa
Economic growth % share of % share of % growth in
(% change in GDP) SA’s overall SA’s total SA exports
export manufactured to the
2019 2020 2021
basket in exports in country in
estimate forecast forecast
2019 2019 2019
Botswana 3.5 4.3 5.9 4.4 6.6 5.9
Mozambique 1.8 6.0 4.0 4.1 3.7 25.4
Namibia -0.2 1.6 2.4 4.0 6.3 9.6
Zambia 2.0 1.7 1.7 2.3 3.9 -5.0
Zimbabwe -7.1 2.7 2.5 2.2 3.6 -7.1
Source: IDC, compiled using IMF WEO October 2019 and SARS data
Botswana: Improved economic conditions in key markets for Botswana’s exports, good
prospects for agricultural sector performance and an accommodative monetary policy
stance should support growth in 2020 and 2021. A pick-up in demand for diamonds and
the anticipated start of copper production on a commercial scale should contribute to
higher mining sector output from 2021 onwards. However, the pace of expansion,
particularly in the diamond segment, will remain vulnerable to developments in major
external markets, especially the US, China and India.
Mozambique: Following the economic slowdown to an estimated 1.8% in 2019, largely
due to the devastating impacts of tropical cyclones on the country’s infrastructure
(including ports) and farmlands, the outlook for the medium-term is expected to improve
significantly. GDP growth is anticipated to reach 6% in 2020, albeit from a low base, as
reconstruction activity intensifies and investment in the gas sector commences.
Namibia: After three years of recession, a return to positive growth is anticipated in 2020.
However, subdued growth in the mining sector, particularly due to a collapse in diamond
output, along with the impact of fiscal austerity on government consumption following the
2019 elections, are likely to constrain economic growth to 1.6% in 2020.
Zambia: Government’s constrained fiscal space and declining mining sector activity, largely
due to an increasingly uncertain environment for mining companies, are likely to result in
weak economic growth in 2020 and 2021. Continued public sector investment in
infrastructure, election-related spending and improving copper prices should, however,
provide some support.
Zimbabwe: Marginal improvements on the economic front are anticipated in 2020 on the
back of better weather conditions, which should result in increased agricultural production,
higher water levels for electricity generation and, by implication, a slight pick-up in mining
and industrial activity. However, the ongoing liquidity and hard currency challenges, erratic
supply of inputs, shortages of basic goods and a challenging business environment are
expected to continue weighing on growth in the medium-term. Furthermore, indications
are that the risks to the economic outlook are tilted to the downside, with any rebound in
growth being largely dependent on external financial support.
6Highlights
Economic overview
South Africa’s economic performance
The South African economy has been experiencing the longest downturn in the business Longest downward phase in
cycle on record, which started in December 2013. Low consumer, business and investor the business cycle on record,
confidence persist, largely due to depressed domestic demand, policy uncertainty, with low levels of business
infrastructure-related challenges, a worsening of South Africa’s fiscal position and a more and consumer confidence
challenging global trading and investment environment.
Figure 5: Low business confidence amidst the longest economic downturn on record
Business confidence in South Africa
100
Longest
90 economic
downward
80 phase on
record:
70
> 70 months
Net balance
60
50
40
30
20
10
Latest reading: Q4 2019 = 26
0
Source: IDC, compiled using Bureau for Economic Research data
In the face of weak demand conditions, economic activity was lacklustre across all broad
sectors of the economy in 2019. Output levels in the mining and manufacturing sectors were
affected by weak demand, rising input costs and operational challenges, while prolonged
interruptions in energy supply at the start of 2019, as well as towards the end of the year,
impacted adversely on these sectors’ performances. The impact of load-shedding was felt
across all segments of the economy, with wide-ranging implications for production, trading
and investment activity. Corporate profits are under strain and the number of company
liquidations increased by 10.7% in 2019, the first increase since the 2009 recession.
Real GDP is estimated to have expanded by only 0.3% in 2019 as a whole and the leading
business cycle indicator of the South African Reserve Bank is pointing to continued
economic weakness in the months ahead. This does not bode well for a swift and sustained
recovery, whilst challenging global conditions are adding to the woes of the South African
economy, at least over the short-term.
Manufacturing sector in recession
Manufacturing output decreased by 0.9% in 2019, but there were tentative signs of In 2019, the manufacturing
improvement gauging from trends observed over the course of the year. The rate of decline sector posted its worst annual
in sectoral output softened to -1.2% (q-o-q) in the final quarter, from -4.5% in Q3 2019. performance in a decade, but
signs of improvement are
Despite the sharp downturn in the transport equipment sub-sector (see Figure 6), some emerging
recovery was evident in the second half of 2019 (on a q-o-q, seasonally adjusted and
annualised basis). Output in the basic iron and steel, as well as in the chemical products
sectors also rebounded in the final quarter of the year. In contrast, the clothing, textiles,
leather and footwear sub-sector (CTFL), which had shown some recovery in the middle of
the year, reported a steep drop in output in the final quarter, with a similar trend also
observed for motor vehicles, parts and accessories. Although food processing was the best
performing sub-sector for the year as a whole, its output fell marginally in the final quarter.
7Highlights
Economic overview
Figure 6: Manufacturing output declined as operating conditions deteriorated
Growth in manufacturing output by sub-sector in 2019
4.0
2.0
% change (y-o-y)
0.0
- 2.0
- 4.0
- 6.0
- 8.0
- 10.0
Source: IDC, compiled using Stats SA data
Manufacturers remain unsatisfied with prevailing business conditions, as indicated by Manufacturers expect
confidence levels remaining continuously below the crucial 50-point mark for an extended business conditions to
period. Insufficient demand has been highlighted as a key constraining factor in doing remain unsatisfactory,
business in the manufacturing surveys of the Bureau for Economic Research (BER), with the affecting investment
reading of 74 points in Q4 2019 being the highest in 10 years. decisions
Manufacturers expect the operating environment to remain challenging in 2020, according
to the BER survey of Q4 2019 (refer to Figure 7). However, despite the challenging global
trading environment, domestic manufacturers indicated that they anticipate a modest
improvement in their export performance in 12 months’ time.
Figure 7: The outlook for the manufacturing sector remains unsatisfactory
Manufacturing sector: expectations in 12 months'time
60
Business conditions
40 Fixed investment
20
Net balance
0
-20
-40
Latest data: Q4 of 2019
-60
Source: IDC, compiled using BER and Stats SA data
Mining production recovering, but the sector is still facing challenges
Operational challenges, rising costs and weakening demand are among the key factors
affecting the mining sector. Output fell by 1.3% in 2019, with the sharp decline in the gold
mining sub-sector having been the main contributor. Excluding gold, mining output
growth would have been flat (0%) in 2019.
8Highlights
Economic overview
However, the mining sector contributed positively to overall GDP growth in the final
quarter of the year. Its output expanded by 1.1% (q-o-q, seasonally adjusted and
annualised basis), following the 6.4% contraction recorded in Q3 2019. This improved
performance was underpinned by strong rebounds in the output levels of sub-sectors such
as platinum group metals (+14.4%, q-o-q), iron ore (+32.7%), chromium (+22.5%) and
other metallic minerals (+46.9%).
Figure 8: Mining production has improved more recently, but the sector is still taking strain
Growth in mining output by sub-sector in 2019
35
% change (y-o-y)
25
15
5
-5
-15
Source: IDC, compiled using Stats SA data
Retail sales reflecting a difficult consumer environment
Household consumption spending remained subdued during the course of last year, As consumer sentiment
affected by moderate growth in real disposable incomes, yet high levels of indebtedness plummeted, growth in retail
and poor employment creation. In real terms, retail trade sales rose by 1.2% - the slowest trade sales slowed to a
rate of increase in a decade. decade low
This reflected low confidence levels amongst consumers, which fell sharply during 2019.
However, a lower interest rate and inflation environment should provide some relief to the
households going forward.
Figure 9: Household spending mirroring low confidence levels
Retail and wholesale trade sales and consumer confidence
30 30
Consumer confidence (net balance)
25 Retail trade 25
Wholesale trade
20 20
Trade sales: % change (y-o-y)
Consumer confidence
15 15
10 10
5 5
0 0
-5 -5
-10 -10
-15 -15
Q4 of 2019
-20 -20
Source: IDC, compiled from Stats SA, BER data
9Highlights
Economic overview
Employment losses in a weak economic environment
In a very low growth environment, the economy could not sustain employment levels. Job losses amidst a weak
Approximately 108 000 jobs were lost over the year to the final quarter of 2019. economic performance
Reduced employment across a number of key labour-intensive sectors is a matter of
concern. The construction sector, which employs roughly 1.35 million people (or 8.2% of
overall formal and informal sector employment) and has been facing extremely difficult
operating conditions for quite some time, recorded 131 000 job losses in the year to Q4
2019. The manufacturing sector shed 46 000 jobs over this period, as a challenging
operating environment resulted in a contraction in output volumes across various of its sub-
sectors and companies faced a squeeze on profit margins amidst rising costs to do business.
Figure 10: Employment losses across most broad sectors in 2019
Changes in sectoral employment: Q4 2019 vs Q4 2018
200
Change in numbers ('000): y-o-y
150
100
50
0
-50
-100
-150
Source: IDC, compiled using Stats SA data
The economy’s inability to provide jobs for all new entrants into the labour market has The number of unemployed
resulted in a substantial rise in the number of unemployed people. By Q4 2019, more than people increased by 587 000
6.7 million people were jobless, an increase of 587 000 compared to a year earlier. over the year to Q4 2019
The unemployment rate measured 29.1% in Q4 2019, unchanged from the all-time high
recorded in the previous quarter. Of all the unemployed, 63% were younger than 35 years,
and 73.3% (or 4.9 million unemployed people) had been without a job for more than 12
months in the final quarter of 2019.
Government finances deteriorated
South Africa’s fiscal position has worsened substantially. Weak economic growth has been
affecting revenue collection, while government spending has continued to increase rapidly.
For the first nine months of the 2020 fiscal year, government revenue increased by a modest Substantial rise in government
4.8% year-on-year, whereas overall government expenditure rose by 12%. The steep debt threatening fiscal
spending increase is of particular concern in light of repeated promises by government to consolidation and debt
put measures in place to contain spending as part of its efforts to ensure fiscal consolidation sustainability commitments
and debt sustainability.
Widening budgetary shortfalls along with higher funding requirements by key state-owned
enterprises (SOEs) have resulted in a steep rise in overall government debt, to a level of
roughly R3.1 trillion by September 2019. As a ratio of GDP, this stood at 61.5%, an all-time
high and contrasting starkly with the record low of 26% in September 2008.
10Highlights
Economic overview
The fiscal deficit widened considerably over the nine months to December 2019 (see Figure
11). Estimates for the 2020 fiscal year as a whole point to a considerably higher budget
deficit than that estimated in the Medium-Term Budget Policy Statement (MTBPS) in
October 2019. According to the MTBPS, the deficit-to-GDP ratio was estimated at 6.2% (or
R324.3 billion) for the 2020 fiscal year, whereas it is now projected (IDC forecast) to reach
6.7% of GDP, or approximately R350 billion.
Figure 11: Budget deficit to be substantially larger than expected
Fiscal performance in recent years (cumulative balances per fiscal year)
0
- 50
- 100
Rand billion
- 150
- 200
2016/17
- 250
2017/18
- 300
2018/19
- 350 2019/20 2019/20 estimates
- 400
Fiscal year
Source: IDC, compiled using National Treasury data; IDC estimates
Government will struggle to raise additional revenue in the current economic environment.
South Africa’s tax base is already over-burdened, considering that tax revenue represents
approximately 26% of GDP, a ratio that is comparable to those of advanced economies.
An attempt to raise value-added tax (VAT) would be met with considerable public resistance. Limited room for raising
Government might be tempted to raise personal income tax for higher income earners additional tax revenue in the
(wealth tax), but the associated additional tax collections could prove to be limited. current economic environment
Considering business conditions at present and efforts to stimulate investment activity, it is
unlikely that any attempt will be made to raise the corporate tax rate.
As usual, the so-called sin taxes will again be raised, including excise duties on alcohol and
tobacco. The fuel and road accident fund levies are also likely to be increased. Consideration
may also be given to raising the sugar tax, but the resultant additional revenue would be
fairly limited and, furthermore, such a move would aggravate the plight of the domestic
sugar industry.
Additional means of raising revenue could include the sale of specific state assets, such as
unutilised properties, as well as a clampdown by the South African Revenue Service on base
erosion and profit-shifting.
Bold actions will be required to bring government expenditure downward to more Urgent actions required to
sustainable levels, otherwise the continued deterioration of South Africa’s fiscal metrics is contain government
not likely to be arrested. Key in this regard is the ballooning public sector wage bill, which expenditure
absorbs roughly 46% of all tax revenue.
Considering the salary and wage increases projected over the next few years, which are well
above inflation, government will have to be decisive in its wage negotiations going forward.
At the very least it should negotiate annual increases in line with inflation. This could, on its
own, make a major contribution towards lowering overall expenditure. Further downsizing
of governmental employment may also prove inevitable. This may be achieved through
11Highlights
Economic overview
continued natural attrition, the offer of voluntary/early retirement packages and/or by
scrapping vacant positions altogether.
Critically, government cannot bailout SOEs indefinitely, making it imperative that effective
solutions be found for their ongoing financial and operating challenges, with a view towards
long-term sustainability. A credible plan for dealing with Eskom’s rising debt burden is
essential in this regard.
Eskom – the single largest risk in the South African economy
Bailouts to key state-owned companies have escalated over the years, placing an undue
burden on government finances. By March 2019, government guarantees to SOEs totalled
R683.3 billion, compared to R670 billion a year earlier, with the largest facility being the
R350 billion guarantee underpinning Eskom’s debt. By March 2019, some R372.4 billion of
such guarantees had been used. Eskom accounted for R294.7 billion or 55.7% of this figure.
Considering that Eskom is buckling under a R450 billion debt burden, this entity is clearly Eskom is placing a huge
the single largest risk facing public finances, as well as the South African economy. National burden on the fiscus and
Treasury has indicated that it will not provide additional debt relief to Eskom until proven poses the biggest single risk
progress has been made with its unbundling process. to the economy
COSATU recently put forward a proposal for Eskom to tap onto R250 billion in funding from
the Public Investment Corporation (i.e. state employee pension funds) and state-owned
development finance institutions.
Eskom will have to find ways of curbing its expenditure (e.g. reducing its over-sized staff
complement, reviewing its coal purchase agreements); addressing operational challenges
(e.g. improving productivity, implementing proper maintenance to its aging power-
generating fleet to increase its energy availability factor); recovering outstanding debt; and
rolling out the proposed operating structure, unbundling into three separate entities -
power generation, transmission and distribution.
Eskom has also been putting the case for much steeper electricity tariff hikes before the The energy efficiency of the
National Energy Regulator of South Africa (Nersa), so as to complement its efforts to return economy has improved
to financial viability over time. This has not met with Nersa’s blessing, for the adverse considerably over time
economic and social impacts would be far-reaching. Electricity prices as included in the
consumer price index (CPI) increased by 301% from 2008 to 2019, well in excess of the 97.7%
in overall CPI over the entire period. In response to rising electricity costs and uncertain
supply, the economy has become less energy-intensive over time, as illustrated in Figure 12.
Figure 12: Energy-intensity of the economy has been reduced
Real GDP, electricity consumption and the electricity intensity
of the South African economy
220 120
210 Electricity consumption in GWh (Index) 115
200 GDP in real terms (Index) 110
190 Electricity intensity (MWh per R1 million of real GDP) 105
Electricity intensity
180 100
Index: 1985 = 100
170 95
160 90
150 85
140 80
130 75
120 70
110 65
100 60
90 55
Source: IDC, compiled using Stats SA, SARB data
12Highlights
Economic overview
Eskom recently announced that South Africans must prepare themselves for prolonged Load-shedding will be a fact
periods of load-shedding over the next 18 months, so that the utility can embark on of life for the next 18
“philosophy maintenance” to fix its power stations. Although consistent and effective months, but pre-announced
maintenance is critical, especially for an ageing fleet of power stations, the negative scheduling permits planning
implications for economic growth are considerable. Nonetheless, should these power
outages be communicated properly and also taking into account that businesses and the
public at large are aware of what to expect in the months ahead, this could soften the
adverse impact on the economy to some extent.
Going forward, the playing field in terms of electricity supply could also change radically, Minister Mantashe’s self-
considering the pronouncement recently made by the Minister of Mineral Resources and generation commitments to
Energy on creating an enabling environment for self-generation. Mining companies have mining companies has been
expressed a keen interest in generating their own electricity. The roll-out of such a plan, highly welcomed
along with the possibility of selling surplus energy back into the grid, would go a long way
in addressing the energy supply shortfall which is constraining the economy at large,
diversifying the energy basket and introducing competition in this monopolistic arena.
Moody’s assessing South Africa’s progress on structural reform
Ratings agency Moody’s has kept South Africa’s sovereign rating (foreign currency) at
investment grade, although it changed its outlook from “stable” to “negative” in November
2019. A negative outlook generally has a 12- to 18-month horizon, although a ratings’ action
may of course be taken in the interim.
The agency is expected to make an announcement of its ratings review on 27 March 2020. A Moody’s downgrade of
Late in January, Lucie Villa, the lead Moody’s analyst for South Africa, was quoted as saying South Africa’s credit rating
that it is too early to assess South Africa's progress on undertaking structural reforms that shortly after the Budget
could assist in improving the economy’s growth prospects and arrest the deterioration in announced is not a given
public sector finances.
This has been interpreted as suggesting that Moody’s might not downgrade South Africa’s
rating to sub-investment shortly after the release of the 2020 Budget on 26 February, even
if the agency is not quite satisfied with government plans to restore its finances back onto
a sustainable path. In addition, it was indicated that the scheduled date for the ratings
review, 27 March 2020, could ultimately be waived or delayed.
Nevertheless, the ratings agency will be keeping a close eye on developments in the fiscal
space, state-owned enterprises, economic growth and the much-awaited structural reforms.
The State of the Nation Address
In his State of the Nation Address (SONA) on 13 February 2020, President Ramaphosa
focused on various issues aimed at fostering inclusive growth as well as addressing structural
constraints on investment and economic growth. The President emphasised the imperative
of social compacts, for “government cannot solve our economic challenges alone”. Among
the salient aspects of the SONA are:
The resolution of South Africa’s energy challenges by altering the trajectory of energy
generation going forward. This includes restoring Eskom’s operational capabilities and
expanding generation capacity outside of the utility’s domain. Aspects pertaining to
the effective implementation of the Integrated Resource Plan 2019 were elaborated
upon. Importantly, no limit will, henceforth, be imposed on the generation of electricity
for own use and applications will be processed within the prescribed 120 days.
Further investment opportunities will be unlocked through the release of high-demand
spectrum by auction before the end of 2020.
The finalisation and implementation of various industry master plans.
13Highlights
Economic overview
Improving the business environment by cutting red-tape and enhancing the efficiency
of key economic infrastructure.
A strong focus on vocational training and the development of advanced skills in
science and innovation.
Enhancing the functioning of the criminal justice system, visible policing, and the
introduction of specialised units to combat crimes of economic disruption (i.e.
extortion, corruption etc.) and to support tourism development.
The rolling out of public infrastructure projects with private funding support, including
independent water and electricity production.
Addressing the challenge of youth unemployment through various initiatives,
including the allocation of 1% of the national budget for this purpose.
Restoring fiscal sustainability and the rationalisation of SOEs.
The establishment of a sovereign wealth fund.
The establishment of a state bank to extend access to financial services to all South
Africans.
A blow from the US on South Africa’s preferential access to its markets
The US is in the process of altering a key exemption of its trade law, which will make it easier
to penalise a number of its trading partners, including South Africa.
This move could have far-reaching implications for South Africa, considering that the US
was the country’s third largest trading partner in 2019, with exports valued at R89.5 billion
or almost 7% of the overall merchandise export basket. The top export categories to the US
in 2019 were platinum group metals (31.6% of South Africa’s export basket to the US); motor
vehicles, parts and accessories (11.1%); chemicals and chemical products (10.3%); basic iron
and steel (8.3%); and non-ferrous metal products (7.2%).
South Africa’s motor vehicle exports, in particular, could be adversely affected considering
the preferential market access the sector receives at present. Other product categories at
risk of losing market access include ferroalloys, industrial chemicals, citrus and nuts, among
others.
There is also concern regarding South Africa’s draft Copyright Amendment and Performers’
Protection Bills, with the US having expressed dissatisfaction with the protection of
copyrights, seeing it as violating the Generalised System of Preferences.
Growth prospects for the South African economy
In the shorter term, South Africa’s economic performance is likely to continue being
adversely affected by weak domestic demand, electricity supply constraints, a degree of
policy uncertainty and, among other factors, a challenging global trading environment.
Real GDP is projected to expand by 1.2% in 2020 and, on average, by 1.7% per annum over Economic prospects to
the five-year outlook period 2020 to 2024. Although growth is likely to remain quite remain unsatisfactory for
subdued earlier in the period, it should garner momentum towards the latter part of the some time
forecast horizon. The anticipated progressive recovery in household consumption spending
and in private sector fixed investment, alongside stronger export growth, should underpin
the gradually faster pace of economic expansion.
Household spending is likely to remain constrained in the short- to medium-term due to
modest increases in disposable incomes, yet high household debt levels and an uncertain
14You can also read