ECONOMIC OUTLOOK 2022: NAVIGATING THROUGH A BUMPY RECOVERY - ECONOMIC RESEARCH 6 DECEMBER 2021 - Bank Islam Malaysia Berhad
←
→
Page content transcription
If your browser does not render page correctly, please read the page content below

ECONOMIC OUTLOOK 2022:
NAVIGATING THROUGH A BUMPY
         RECOVERY
             6 DECEMBER 2021
       ECONOMIC RESEARCH

       DR. MOHD AFZANIZAM ABDUL RASHID
            ADAM MOHAMED RAHIM
             SHAFIZ BIN JAMALUDDIN
             NOR JANNAH ABDULLAH
           RAJA ADIBAH RAJA HASNAN

                                         Strictly Private & Confidential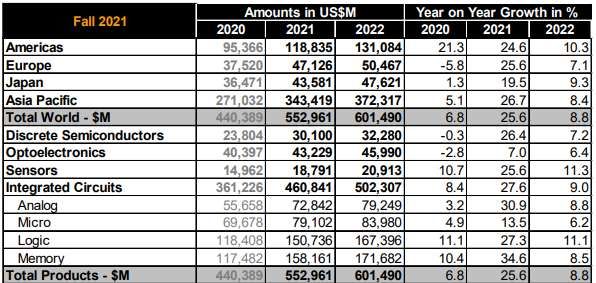
TABLE OF CONTENT

  • REVIEW ON THE FINANCIAL MARKET              PAGE 3

  • PRESENT ECONOMIC CONDITION                  PAGE 10

  • WHAT TO LOOK OUT FOR IN 2022?               PAGE 16

  • RISKS THAT MAY CONTINUE TO LINGER IN 2022   PAGE 24

  • POTENTIAL OPPORTUNITIES IN 2022             PAGE 27

  • SECTORAL VIEW                               PAGE 32

  • MACROECONOMIC FORECAST                      PAGE 34

  • FORWARD LOOKING STATEMENT                   PAGE 36

  • APPENDIX                                    PAGE 39

ECONOMIC RESEARCH                                         Page 2
REVIEW ON THE
                    FINANCIAL MARKET
                    (EQUITIES & BONDS)

ECONOMIC RESEARCH                        Page 3
REVIEW OF REGIONAL MARKETS
Among major regional markets, Wall Street’s S&P 500 index was the largest gainer on a Year-To-Date (YTD)
basis with a 21.6% advance. The rally in the S&P 500 index has been fuelled by President Joe Biden’s
infrastructure bill worth USD1.2 trillion which is expected to facilitate the country’s economic growth from the
pandemic. However, the final trading day of November saw the U.S. Federal Reserve (Fed) Chairman
Jerome Powell mention that the risk of higher inflation has increased and that it was appropriate to consider
wrapping up tapering of bond purchases a few months sooner, causing the S&P 500 index to slump by 1.9%
on the same day.
Meanwhile, Hong Kong’s Hang Seng index led laggards with a 13.8% decline on a YTD basis which was
initially sparked by Evergrande’s debt crisis. The latest drag on the index was the news of the Omicron
variant which sapped risk appetite while a sell-off in Macau casino operators prolonged after Macau’s
largest casino junket operator Suncity Group said its controlling shareholder Alvin Chau Cheok-wa offered
to step down as chairman and executive director, following his arrest.
On the domestic front, the FBM KLCI index stood out as the third smallest decliner among its Asian peers,
declining by 7.0% on a YTD basis due to the absence of major catalysts after the one-off prosperity tax was
tabled during Budget 2022.
Source: CEIC
ECONOMIC RESEARCH Note: As at 30 November 2021 Page 4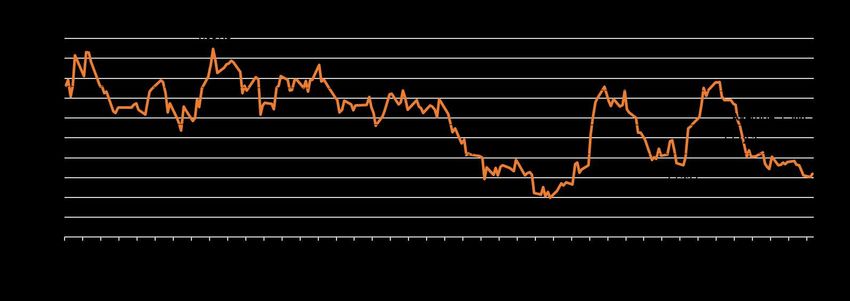
REVIEW OF SECTORAL PERFORMANCE IN MALAYSIA’S EQUITY MARKET
It came to no surprise that the Bursa Malaysia Technology index was the best performer during
11M2021, rising by 42.5% amid Malaysia’s position as an important semiconductor hub. Although
manufacturing activities were affected during the series of lockdowns, Malaysian semiconductor
fabrication plants are back to 100.0% capacity which could accommodate the pent-up
demand for server shipments in Asia. Original equipment manufacturers (OEM) in the automotive
industry also stated that the worst of the chip shortage is behind them and it could take at best 3
to 4 months for the issue to be over.
The tables have turned for the Bursa Malaysia Healthcare index which recorded a 31.3% decline
during 11M2021 compared to a 220.9% gain in 11M2020. It cannot be denied that the progress of
vaccination efforts throughout the globe have somehow reduced the urgent need for rubber
gloves. As a result, the average selling prices (ASPs) of rubber gloves have been on a downtrend,
painting gloomy prospects for the profitability of rubber glove manufacturers. Nevertheless, the
concerns from the Omicron variant could possibly put rubber glove manufacturers back into the
centre of attention among investors.
ECONOMIC RESEARCH Page 5
Source: CEIC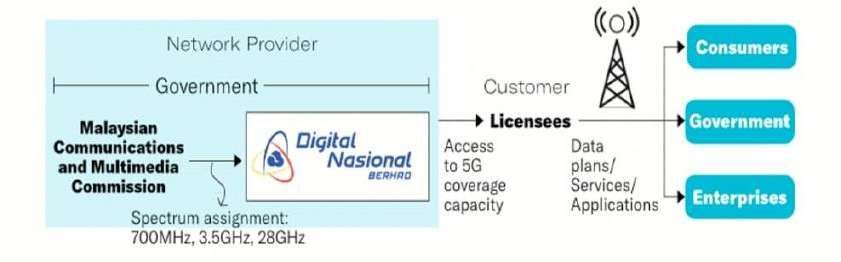
FOREIGN EQUITY FLOWS
Source: Bursa Malaysia
For the past 4 straight months, international investors
have been accumulating Malaysian equities.
The cumulative foreign net selling stood at RM2,011.6
million in 11M2021 compared to a foreign net outflow of
RM24,000.6 million in 11M2020.
With one month left, the year 2021 is set to mark the
fourth consecutive year of foreign net outflow from
Bursa.
Foreign ownership levels in terms of percentage of Bursa
Malaysia’s market capitalisation have been steadily
coming off since hitting the peak of 24.2% in March 2018.
The recent influx of foreign investors into Malaysia did not
help in increasing foreign ownership levels as the value of
shares that they own has likely dropped after purchase
especially after the announcement of the one-off
prosperity tax or ‘Cukai Makmur’ under Budget 2022. Source: Bursa Malaysia
ECONOMIC RESEARCH Page 6
OVERALL INVESTOR PARTICIPATION ON BURSA We observed that the participation from retail investors took a sharp turn in November 2021. This is evident from the reduction in retail investors’ share of value traded on Bursa Malaysia which dropped to 31.4% in November from 35.5% in October, the lowest in 20 months. Likewise, the participation from local institutions was lower at 40.5% of the total value traded on Bursa in November compared to 43.5% in the previous month. We can infer that these two types of investors were jittered about the one-off prosperity tax for 2022 which may reduce the profitability of listed companies. Meanwhile, foreign investors saw their trading participation based on value traded on Bursa increased markedly to 28.1% for the month of November (October: 21.0%). Overall, the total value traded on Bursa Malaysia for 11M2021 was at RM1.65 trillion compared to 2.1 trillion for 11M2020. ECONOMIC RESEARCH Source: Bursa Malaysia Page 7
DEMAND FOR LOCAL GOVVIES REMAINS STURDY IN 2021
U.S. Treasury & Malaysian Government Securities
(MGS) YTD Performance
Yields (%) Yields (%)
UST Change (bps)
31-Dec-20 30-Nov-21
3-Y MGS 0.09% 0.05% -4
5-Y MGS 0.13% 0.52% 39
10-Y MGS 0.36% 1.14% 78
Yields (%) Yields (%)
MGS Change (bps)
31-Dec-20 30-Nov-21
3-Y MGS 1.88% 2.68% 80 Note: * As at November 2021
5-Y MGS 2.12% 3.13% 101 On domestic front, the yields of 3-Y, 5-Y and 10-Y
10-Y MGS 2.65% 3.52% 87 MGS have increased significantly by 80 bps, 101 bps
and 87 bps respectively on a YTD basis, mirroring the
U.S. Treasury (UST) yield movement as the risks from
the Covid-19 have gradually dissipated
accompanied by progress on vaccination efforts.
Meanwhile, foreign investors continued to purchase
local govvies for three straight months with the latest
net inflow standing at RM2.9 billion in October
(September: RM0.6 billion).
This has brought the cumulative net inflow higher at
RM31.0 billion in 10M2021 compared to RM12.8
billion in 10M2020.
In addition, the average BTC for MGS and GII was
fairly stable at 2.04x and 2.34x respectively as at
November.
Sources: CEIC, Bond Info Hub This shows that the demand for Malaysian bonds
remains supportive.
ECONOMIC RESEARCH Page 8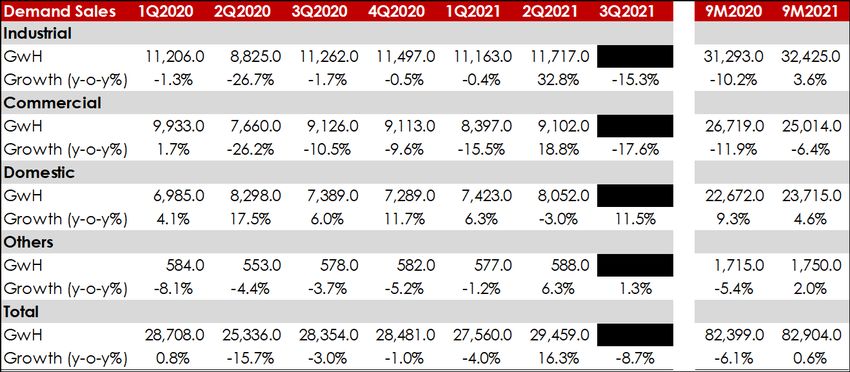
RINGGIT – EXTERNAL PRESSURES CONTINUE TO DRAG THE
LOCAL NOTE
Source: Investing.com
At the current juncture, the Ringgit has weakened by 4.3% on a YTD basis to close at RM4.200 against the U.S. dollar
on 30 November from a RM4.023 on 1 January.
One of the reasons was attributable to the current account balance of payments which registered a smaller surplus
of RM11.6 billion or 3.1% of GDP in 3Q2021 after increasing by RM14.4 billion or 3.9% of GDP in the previous quarter
and thus, further lowering the value of the Ringgit.
Other than that, hawkish remarks from the Fed that indicated the tapering process could be quicker should
economic data point to a more sustainable recovery might bring pressure to currencies of emerging countries
including the Ringgit. In addition, he suggested to retire the word ‘transitory inflation’ which subsequently could
open the door to interest rate hikes thereafter.
Despite the gradual reopening of the economy, the future remains uncertain. This is especially true when the recent
discovery of new Covid-19 variant of concern (VOC) called Omicron might be a sign that the pandemic will remain
with us for some time.
The weakness of the Brent crude oil price which dropped below USD80.00 per barrel amid demand concerns arising
from the possible threat of the Omicron will also have some bearing towards the Ringgit. The reason being is that
Brent crude oil price has a causality effect towards the Ringgit.
In brief, the Ringgit is still exposed to a combination of external factors ranging from monetary policy to the new
Covid-19 variant.
ECONOMIC RESEARCH Page 9
PRESENT ECONOMIC
                        CONDITION

ECONOMIC RESEARCH                      Page 10
HIGHER ECONOMIC GROWTH NEXT YEAR
GDP FORECAST IN 2022 Current
Performance
GDP
2022F: 5.5% 9M2021: 3.0%
2021E: 3.0% Demand Side 9M2020: -6.4% Supply Side
Private Public
Consumption Consumption Services Manufacturing
2022F: 5.5% - 6.5%%
2021E: 3.0% - 4.0%
9M2021: 1.2% 9M2021: 7.7% 9M2021: 1.4% 9M2021: 9.7%
9M2020: -4.6% 9M2020: 4.7% 9M2020: -5.7% 9M2020: -4.6%
Private Public
Investment Agriculture Mining
Investment
2022F: 5.8%
2021E: 3.3%
9M2021: 4.2% 9M2021: -15.4% 9M2021: -1.2% 9M2021: 1.3%
9M2020: -13.3% 9M2020: -21.8% 9M2020: -2.5% 9M2020: -10.7%
Exports Imports Construction
2022F: 6.0%
2021E: 3.5%
Sources: World Bank, IMF, BNM, Bank
9M2021: 16.9% 9M2021: 19.9%
Islam, CEIC 9M2021: -2.6%
ECONOMIC RESEARCH 9M2020: -11.2% 9M2020: -10.1% Page 11
9M2020: -21.3%TRANSITIONING TOWARDS NORMALCY – HUMAN MOBILITY HAS
BEEN INCREASING IN MALAYSIA
Workplace, % (2021) Workplace, % (2020)
70 60
Flexible working
50
-13%* compared to baseline arrangement is
the way to go
40
-14% compared to baseline
30
20
10
0
-10
-20
-30 28 Aug: -22% 28 Aug: -10%
-50 28 Sept: -28% -40 28 Sept: -13%
28 Oct: -21% 28 Oct: -22%
-70 -60
9/28/2021 10/18/2021 11/7/2021 11/27/2021 9/28/2020 10/18/2020 11/7/2020 11/27/2020
Grocery & Pharmacy, % (2021) Parks, % (2021)
35 50
25
30
15
5 10
-5 -10
-15 +13%* compared to baseline
-25
-30
+8%* compared to baseline
-35 -50
9/28/2021 10/18/2021 11/7/2021 11/27/2021 9/28/2021 10/18/2021 11/7/2021 11/27/2021
Note: Baseline 0 indicated no movement, while any number level above 0 means people are at specific places (workplaces, residential
areas) and any number below 0 would mean otherwise.
*figure as at 28 November
Source: Google Mobility Report
ECONOMIC RESEARCH Page 12CONSUMER AND BUSINESS SENTIMENT ARE EXPECTED TO
IMPROVE
Source: DOSM Malaysia’s Manufacturing PMI edged up to 52.3 points in
November, (October: 52.2 points) marking the second straight
month of gains and the strongest since April amid recovery
from the intense downturn seen during mid-year following the
gradual easing in Covid-19 restrictions.
Apart from that, Department of Statistics Malaysia (DOSM) has
reported that businesses gain confidence towards fourth
quarter of 2021 with the confidence indicator recorded a
smaller contraction at 0.3% (3Q2021: -21.3%) as compared to
the previous quarter. The positive outlook was supported by
the easing of economic restrictions during mid-October.
On the other hand, both BCI and CSI have further increased
to 97.0 points (2Q2021: 87.5 points) and 101.7 points (2Q2021:
64.3 points) respectively in 3Q2021, indicating that both
indicators are looking up once again due to the easing of
Covid-19 restrictions.
Be that as it may, the encouraging sentiment might be
reversed amid fears on the emergence of Omicron variant
Source: Bloomberg which has been detected in over 20 countries including
ECONOMIC RESEARCH Malaysia as of 3 December 2021. Page 13LABOUR MARKET RECOVERED AT A MODERATE PACE
Overall, the labour market has yet to return to pre-
pandemic levels during 3Q2021 albeit posting a
better quarter-on-quarter (q-o-q) performance.
Unemployment rate (UR) saw a slight improvement
as the figure declined by 0.1 percentage points
(ppts) to reach 4.7% (2Q2021: 4.8%) during the said
quarter amid gradual ease of restrictions according
to the phases of the national recovery plan (NRP).
Similarly, employment rate recorded a marginal
increase of 67.5 thousand persons to hit 15.3 million
in 3Q2021 (2Q2021: 15.2 million).
Meanwhile, labour productivity expressed in terms of
value added per employment has plummeted by
5.6% during the quarter after increasing by 13.7% in
2Q2021. The downward pressure was due to most of
the states especially key states such as Selangor and
Kuala Lumpur that were under phase 1 of NRP. As
such, demand for good and services remained
subdued following cautions of high daily Covid-19
cases though there was progressive lift of selected
restrictions targeted towards the fully vaccinated
individuals.
Moving forward, the labour market is expected to
improve for the next quarter since the economy has
gradually opened with the reopening of state
borders from 11 October.
Nevertheless, with the new emergence Omicron
strain of Covid-19 which was first detected in South
Africa, this could pose challenges for the road to
Sources: CEIC, DOSM recovery in the country.
ECONOMIC RESEARCH Page 14LOSS OF EMPLOYMENT IS DECLINING
The series of Movement Control Orders (MCOs) imposed by the government to curb the fast-spreading virus have
restrained economic activities and human mobility, thus affecting labour market and business operations.
Consequently, job losses have been higher compared to the pre-pandemic period. Last year, the total loss of
employment (LOE) in Malaysia stood at 107,024 (2019: 40,084) as employers had to bear the brunt of the Covid-
19 pandemic.
As at 19 November 2021, the total LOE in 2021 had reached 57,314 which was more than the total LOE recorded
in 2019. However, the cumulative figure was lower during 10M2021 at 54,481 as compared to the same
corresponding period last year (10M2020: 91,133), suggesting an improvement in labour market conditions amid
new job opportunities in light of the gradual reopening of the economy.
In effort to generate and sustain jobs next year, the government under the Jamin Kerja Keluarga Malaysia
(JaminKerja) initiative will guarantee 600,000 job opportunities with an allocation of RM4.8 billion. This would
further stimulate job creation moving forward.
2021: 57,314*
2020: 107,024
2019: 40,084
* *
Source: SOCSO
*as at 19 November 2021
ECONOMIC RESEARCH Page 15WHAT TO LOOK OUT FOR
IN 2022?
ECONOMIC RESEARCH Page 16MALAYSIA’S VACCINATION JOURNEY
As Malaysia’s vaccination rate for the adult
population reached 90.0%, the government has Malaysia’s Vaccination Rate For Fully
allowed to resume interstate and overseas travel Vaccinated Individuals
from 11 October.
The next focus will be to complete the vaccination Adults
Adolescents
programme for adolescents (12 to 17 years of (18 years Total
(12 to 17
age). old and Population
years old)
In addition, the administration of booster shots has above)
commenced from 13 October 2021 with a smooth
progress. So far 2,457,510 booster shots have been
administered as at 30 November from just 3,158 86.2% 97.0% 77.8%
booster shots on 13 October.
Booster shots are important as the effectiveness of
vaccines against the virus wanes after three to five
Source: Covid-19 Immunisation Task Force
months. Note: As at 1 December 2021
Therefore, a higher vaccination rate in the country
could prevent another wave of infections.
Pfizer Fffectiveness Sinovac Fffectiveness
Against Covid-19 Against Covid-19
Infections Infections
100.0% 89.0% 80.0% 76.0%
80.0% 68.0% 60.0%
60.0%
40.0%
40.0% 28.0%
20.0%
20.0%
0.0% 0.0%
1 -2 months 3- 5 months 1 -2 months 3- 5 months
Source: Ministry of Health Page 17
ECONOMIC RESEARCHUPDATES ON THE OMICRON VARIANT
However, the world was shocked on 26 November Number of Covid-19 cases related to the
when the World Health Organisation (WHO) Omicron variant
Country Number of Omicron-related cases
designated the variant B.1.1.529 a VOC, named Australia 7
Omicron. Austria 1
Since then, many countries have re-imposed Belgium 1
certain standard operating procedures (SOPs) such Botsw ana 19
as wearing masks in public places and requiring Brazil 2
testing of international arrivals. Canada 6
More than 200 cases related to the Omicron variant Czech Republic 1
have been detected throughout the world as at 3 Denmark 4
December. France 1
So far, Malaysia has detected one case under the Germany 9
Omicron variant on 3 December. Hong Kong 4
I srael 4
Measures carried out by countries in I taly 9
response to the Omicron variant Japan 2
Netherlands 16
Countries Types of Measures Imposed
Nigeria 3
South Remain on the lowest 'Level One' of its Norw ay 2
Africa five-level lockdown strategy. Portugal 13
Saudi Arabia 1
Masks made mandatory in shops and on
South Africa 77
The U.K. buses and trains, while new arrivals must
take PCR tests. South Korea 5
Spain 2
New York declared state of emergency in Sw eden 3
response and released updated mask
U.K. 22
The U.S. advisory on 29 November that strongly
recommends people to wear masks U.S. 1
indoors. Malaysia 1
Total 216
Source: Various
Source: CNN Page 18
ECONOMIC RESEARCHRISKS OF OMICRON TOWARDS MALAYSIA – TOURISM SECTOR
The government has decided to pause
Countries which have banned travellers from South
Malaysia’s move into the endemic phase until Africa, Botswana, Eswatini, Lesotho, Mozambique,
more information on the Omicron variant is Namibia, Zimbabwe
available.
Tighter border controls have been in place, Malaysia
preventing entry to visitors from countries that
have recorded cases of Covid-19 from the The U.K.
Omicron variant.
As such, the aviation and tourism sector that was The U.S.
just about to gain momentum from the
Netherlands
loosening of restrictions could face obstacles if
the Omicron variant was found to be more Indonesia
dangerous than other variants.
Recall that the tourism industry contributes 14.1% Source: Various
towards the nation’s GDP in 2020 (2019: 15.9%).
ECONOMIC RESEARCH Source: Malaysia Airports Holdings Berhad Page 19RISKS OF OMICRON TOWARDS MALAYSIA – MANUFACTURING
SECTOR
While a nationwide lockdown is no longer
preferred, targeted lockdowns could still be
on the cards if the Omicron variant contracts
severe symptoms.
Assuming that an Omicron-related outbreak
is detected at factories, factories will have to
temporarily shut down their operations.
Recall that the enhanced movement control
order (EMCO) in 3Q2021 during the first half
of July saw many manufacturing sub-sectors
including electrical & electronics (E&E) such
as Unisem (M) Berhad to record softer
revenues. Sources: Bursa Malaysia, Various Media & Unisem’s 3Q2021 Analyst
Food and beverage (F&B) manufacturers like Briefing
Fraser & Neave Holdings Berhad (F&N) were
not spared from the EMCO as the prohibition
to dine-in at F&B outlets and restricted
operating hours for convenience stores
caused a 6.0% y-o-y drop in their sales in
3Q2021.
Therefore, businesses and factories have to
formulate a more comprehensive business
continuity plan in the event that a targeted
lockdown is implemented at their premises.
Source: Bursa Malaysia
ECONOMIC RESEARCH Page 20MONETARY POLICY OUTLOOK APPEARS MIXED
Inflation is The discovery of the Omicron variant coincided
with the statement by Fed Chairman Jerome
no longer Powell that inflation may no longer be ‘transitory’
transitory! in nature while signalling support for a faster
tapering schedule.
If the Omicron variant was proven to be more
infectious and cause severe symptoms, the
pathway to monetary policy normalisation by the
Fed could face some setbacks.
The reason being is that the unemployment rate
in the U.S. could increase if restrictions were
For Malaysia, our base case scenario includes a imposed later on to curb the spread of the
possible rate hike in 2H2022 with July being the variant.
earlier.
Therefore, any possible threat from the newest
variant could mean a longer timeline to consider
raising the Overnight Policy Rate (OPR) by BNM
provided that certain form of restrictions on
economic activities were imposed again.
Restrictions could also dampen consumer spending
which has been rising as reflected by the growth in
saving deposits in banks which had moderated to
4.7% y-o-y in October, (September: 6.1%) from 20.1%
in March.
More importantly, BNM will continue to utilise its
policy levers based on prevailing data points before
considering to gradually move away from its
accommodative stance. Source: CEIC
ECONOMIC RESEARCH Page 21FINANCIAL MARKET OUTLOOK – EQUITY MARKET
The FBM KLCI index has gone through a roller coaster ride this year
in light of the past political uncertainty combined with external EPS Integer Of The FBM KLCI Index
pressures from the virus and the surprise from the one-off Earnings Per
prosperity tax. Share (EPS) Year-on-year
We are revising our year-end FBM KLCI target to settle at 1,540 Year
Integer of the FBM growth, %
points at year-end for 2021 (2020 year-end: 1,627 points) from KLCI Index
1,610 points previously based on a price-to-earnings (PE) target of 2022F 105.6 7.8%
15.7x. 2021E 98.0 37.6%
The reason for the revision is to incorporate the lower consensus 2020 71.2 -20.6%
forecasted for the 2021 FBM KLCI index earnings per share (EPS)
2019 89.7 13.0%
integer of 98.0 compared to 110.0 following weaker-than
expected 3Q2021 results season. 2018 79.3 -26.5%
We are also taking the opportunity to introduce our 2022 FBM KLCI 2017 107.9 9.8%
year-end target of 1,660 points as we view that earnings will be Source: Bloomberg
stable barring any unforeseen circumstances posed by the
Omicron variant.
ECONOMIC RESEARCH Source: Bursa Malaysia Page 22FINANCIAL MARKET OUTLOOK – FIXED INCOME MARKET
Total Issuance of MGS and GII,
MGS Yields Forecast
RM Billion
3-Y MGS 5-Y MGS 10-Y MGS 200.0
175.0
180.0
2021E 2.79% 3.26% 3.63% 160.0
160.0
2022F 3.19% 3.69% 4.08% 140.0
120.0
100.0
Going into 2022, the MGS yields for 3-Y, 5-Y 80.0
and 10-Y are projected to go up to 3.19%, 60.0
40.0
3.69% and 4.08% next year respectively in view 20.0
of a swift economic recovery. 0.0
On the fiscal front, we are forecasting that the
issuance of MGS and GII will reach RM175.0
billion in 2022F (2021E: RM160.0 billion) as the
government is set to maintain its expansionary Statutory Debt (MGS, GII & MITB)-to-GDP
budget to spur the economy, ratio, %
Meanwhile, the statutory debt-to GDP ratio is 70.0%
61.5%
59.0%
likely to reach 61.5% next year which is remain 60.0% Statutory Debt Limit of 65.0%
below the new statutory debt threshold of 50.0%
65.0%.
40.0%
Hence, the government will have to balance
the need for supporting the economic 30.0%
recovery with its fiscal position. 20.0%
All in all, the risks due to emerging of new
10.0%
Covid-19 variant and global inflation remain
as wildcards that could cloud the prospects 0.0%
2011 2012 2013 2014 2015 2016 2017 2018 2019 2020 2021F
2021E2022F
2022F
next year.
ECONOMIC RESEARCH Sources, CEIC, Bank Islam Page 23RISKS THAT MAY
CONTINUE TO LINGER IN
2022
ECONOMIC RESEARCH Page 24GLOBAL SUPPLY CHAIN DISRUPTION HAS WEIGHED ON THE
BUSINESS SENTIMENT
Businesses around the world and across
key sectors are feeling the impact from
ongoing supply chain disruptions.
According to the U.S. Institute of Supply
Management (ISM) Manufacturing PMI
Survey, items such as electrical and
electronic components and
semiconductors have been in short
supply for 13-14 consecutive months.
This was followed by the shortage of
silicone and steel products which have
been prolonging for 13 straight moths.
Furthermore, key ports around the world
remain congested which have amplified
the ongoing supply shortages, leading to
backlogs and long lead times for certain
goods.
The issue of supply shortages remains in
the minds of companies around the
world and featured prominently in
earning calls for businesses in the
industrials, tech and consumer goods
Source: U.S. ISM
sectors.
ECONOMIC RESEARCH Page 25GLOBAL INFLATION WILL BE A WILDCARD
The latest data by the U.S. ISM shows that the
price paid by the manufacturers were
significantly higher by more than 80.0% since
January this year.
Hence, supply shortages and logistics issues
are pushing up prices and eating into the
margins of businesses.
Additionally, animal feed, fertilisers and
pesticides also reported in shortages which
has resulted in higher cost of farming and
harvesting activities in future.
As a result, the ongoing pandemic has
Sources: U.S. ISM, CEIC amplified the food price shock by severely
hampering food production and distribution.
This may increase the risk to the nation’s food
security.
Malaysia’s inflation has been rising Therefore, the emergence of the new variant
could lead to another round of lockdown
measures and businesses would be forced to
halt their operations.
This could stretch global supply chains further
and spike in products prices.
Sources: CEIC, DOSM
ECONOMIC RESEARCH Page 26POTENTIAL OPPORTUNITIES
IN 2022
ECONOMIC RESEARCH Page 27INTEGRATING TECH AND AGRICULTURE
Sources: DOSM, CEIC
Malaysia’s deficit in international food trade has continued to Contribution to Property Transaction Value by
show an increasing trend from just RM1.13 billion in 1990 to Sub-sector in 1H2021
RM21.69 billion last year. Agriculture
8.9%
As such, it was no surprise that Malaysia’s food import bill
reached a record high of RM55.5 billion in 2020 (2019: RM51.5 Industrial
billion). 10.4%
Therefore, Malaysia’s burgeoning trade deficit poses serious
risks in relation to food security. The rise in food inflation was Residential Commercial
also partly caused by the reliance towards imported foodstuff. 55.7% 17.6%
At the same time, transactions related to agricultural land
have also been very small, accounting for 8.9% of Malaysia’s
total property transaction value in 1H2021. This indicates the Development
Land Others
potential for such transactions to expand further in light of 7.4%
more farming activities. Source: NAPIC
ECONOMIC RESEARCH Page 28INTEGRATING TECH WITH AGRICULTURE (CONT’D)
Interestingly, a report by DOSM noted that the Percentage of Adoption of Data
adoption of the agriculture sector towards digital Analytics According to Sectors in 2019
technologies is quite high.
For instance, the percentage of adoption of Agriculture 9.0%
digital technologies, particularly data analytics
stood at 9.0% for the agriculture sector in 2019, Mining & Quarrying 3.4%
the highest among the other sectors.
Nevertheless, it could be that data analytics are
Manufacturing 4.3%
mostly used by researchers in the industry rather
than the real business operators.
Currently, one of the main drivers for the data Construction 2.8%
analytics usage in agriculture is the Malaysian
Digital Economy Corporation (MDEC) via its pilot Services 6.8%
initiative called ‘eLadang’. The initiative aims to
empower the sector by infusing technologies Source: DOSM
under the Fourth Industrial Revolution (4IR). With this in mind, Malaysia’s E&E manufacturing sector
could move up the value chain to evolve into activities
Malaysia's Trade Surplus for Electrical such as design & development (D&D) for other industries
including agriculture rather than just being a large net
& Electronic Products, RM Million
exporter of E&E products.
140.0 133.3
Corporates under the E&E sector can work together with
120.0 farmers to see what can be operationally enhanced,
100.0 enabling smart farming.
80.0
60.8
This could also provide employment for fresh science,
60.0 technology, engineering mathematics (STEM) graduates
40.0 and later develop skilled human capital which can
20.0 propel the nation’s agricultural sector.
- Thus far, pilot projects under the ‘eLadang’ programme
2010 2011 2012 2013 2014 2015 2016 2017 2018 2019 2020 have resulted in an increased yield of about 12.0% and
Source: DOSM reduced manpower by 50.0%.
ECONOMIC RESEARCH Page 29INTEGRATING TECH WITH AGRICULTURE (CONT’D)
Farm/Agricultural land
Smart crop sensor
Drones
Fly over fields to locate Collect data about moisture,
pathogens and collect data lack of nutrients or the
Cloud-based data
about the development of presence of pests to determine
crops and their needs together
management
the need for irrigation, fertiliser
with weather conditions. or pesticides.
Data collected by drones and
smart crop sensor is stored in the
cloud.
Result:
Efficient management of
crops, enabling better
production of agriculture
output.
Farmers can access information
about the farm and rectify any
issues detected from the data
collected.
Source: Various
ECONOMIC RESEARCH Page 30INTEGRATING TECH WITH AGRICULTURE (CONT’D)
Aside from addressing the efficiency of YAM 2.0 Sustainable Animal Feed
farming using technology, the issue of food
wastage can also be turned into an
opportunity for the animal farming industry
together with the technology industry.
The production of sustainable feed from food
waste can help contain the costs incurred by
farmers handling cattle and chicken.
In Kuantan, 11-year-old Maryam Muzamir
formulated a new form of livestock feed
made out of ground shrimp shells and sea
snail shells, calling the product 'YAM 2.0’.
Interestingly, data from DOSM showed that
the Malaysia is a net exporter of Crustaceans
(including shrimps) and Molluscs that are
Source: Says.com
fresh chilled frozen, salted or in brine.
Henceforth, the animal feed industry can
leverage on shrimp shells and snail shells to
produce animal feed that is less costly while Trade Surplus of Crustaceans and Molluscs
being environmentally friendly. Year 2017 2018 2019 2020
Technology could also play a role by
enabling the efficient production of the YAM Trade Surplus (RM Billion) 274.0 256.2 486.4 249.8
2.0 and expanding sales network Source: DOSM
domestically and overseas.
ECONOMIC RESEARCH Page 31SECTORAL VIEW ECONOMIC RESEARCH Page 32
OVERVIEW OF SECTOR RATINGS
We currently have 15 sectors under our observation.
Recent rating revisions were made to some sectors such as Power which was revised from neutral
to positive amid the country’s aspiration to be carbon neutral by 2050. Meanwhile,
Manufacturing Rubber Gloves was downgraded from positive to neutral, taking into account of
the normalisation in ASPs of rubber gloves.
Overall, we opine that sectors with good prospects in the coming years will revolve around
sustainable energy and the proliferation of technological adoption.
We also flag possibilities of a revision to our sector calls in the event that the Omicron variant
exerts downward pressures towards the economy and businesses.
Further explanation of each sectors can be found in the Appendix.
Positive Neutral Negative Avoid
Healthcare Manufacturing Rubber Non-residential Retail Space
Gloves Property – Shop Units
Power
Construction
Manufacturing Residential Property
Semiconductors
Automotive
Oil & Gas
Banking
Telecommunication Transportation
& Storage
Education
Plantation
ECONOMIC RESEARCH Page 33MACROECONOMIC
FORECAST
ECONOMIC RESEARCH Page 34MACROECONOMIC FORECAST
Variables 2020 2021E 2022F
GDP -5.6% 3.0% 5.5%
FBM KLCI year-end
1,627 points 1,540 points 1,660 points
target
OPR 1.75% 1.75% 2.00%
USDMYR RM4.02 RM4.15 RM4.09
CPI -1.1% 2.3% 2.2%
CPO RM3,788 MT RM4,231 MT RM4,156 MT
BRENT USD51.80 bbl. USD72.27 bbl. USD68.37 bbl.
Source: Bank Islam
FBM KLCI USDMYR, Brent Crude and CPO are end of the year forecasts
ECONOMIC RESEARCH Page 35FORWARD LOOKING
STATEMENT
ECONOMIC RESEARCH Page 36FORWARD LOOKING STATEMENT The known unknowns – Bearing in mind that the Covid-19 virus continues to mutate into other variants, it is apt for the global community to always be prepared for incoming variants. Proceed with more comprehensive scenario building exercises – This is important to ensure that actions plan are well in place before any calamity arises. The lag time between the period when the issue arises and the implementation of the action can be reduced to prevent huge danger from spreading fast. What to expect in 2022 - Overall, Malaysia’s economy is expected to record a respectable gain despite a bumpy road as the monetary and fiscal stimulus has been forthcoming. In addition, more people and businesses have increasingly adopted ways to operate and work in the pandemic era. Downside risks that may prompt a revision in our view 1. Resurgence of new cases especially the Omicron variant and delay in booster vaccine rollout whereby targeted lockdowns could adversely impact the affected industries. 2. A prolonged supply chain bottleneck which will push prices at a higher rate compared to the economic growth, giving rise to stagflation. 3. Fluid domestic political landscape – economic and institutional reforms may not be able to be executed. ECONOMIC RESEARCH Page 37
APPENDIX

ECONOMIC RESEARCH              Page 39
HEALTHCARE - BETTER PROSPECTS IN 2022

                         Healthcare awareness is rising among the public and preventive measures
                         are widely adopted.
                         Apart from that, the healthcare sector has a strong economic immunity,
                         whereby medical treatments are not tied to the vagaries of the economic
                         cycle.

01     Higher Allocation – Budget 2022
                                                                   Actual Expenses (2018-2020) and
   As the government continues to prioritise public              Allocation (2021-2022) for Operating
   health to build national resilience to prepare for             and Development Expenditure, RM
   an endemic phase later in the future, the
                                                                                Billion
   Ministry of Health is the second largest after the
   Ministry of Education to receive higher allocation     35.0

   under Budget 2022.                                     30.0
                                                                                            3.8      4.7     4.4
                                                                                 1.7
                                                          25.0       1.6
   A total of RM32.4 billion would be distributed to
   the Ministry of Health for operating and               20.0
   development expenditure, which is 1.6% higher          15.0
                                                                                 27.7       27.0     27.2   28.0
   than the previous budget at RM31.9 billion.                      25.4
                                                          10.0

   Apart from that, the government is providing an         5.0
   additional RM4.0 billion to the ministry to             0.0
   continue the agenda to tackle the Covid-19                       2018         2019       2020    2021E   2022F
   pandemic.                                                                  Operating      Development

                                                        Source: Ministry of Finance (MOF)

ECONOMIC RESEARCH                                                                                           Page 40
HEALTHCARE - STRENGTHENING MALAYSIA’S HEALTHCARE
BRAND
02 Medical Tourism
With gradual lifting of travel restrictions in National Medical Tourism Receipts
Malaysia combined with plans by the (RM Billion)
government to reopen international borders to 1.80
1.70
international visitors by 1 January 2022 at the 1.60
latest, these could be catalysts for the sector. 1.40
1.20 1.00
Thus far, the Malaysia Healthcare Tourism Council 1.00
(MHTC) estimated that the national medical 0.80
tourism receipts could reach between RM0.58 0.80
0.60
billion and RM0.65 billion in 2021 (2020: RM0.80 0.65
0.40 0.53
billion) before improving to RM1.00 billion next
0.20
year.
2011 2013 2015 2017 2019 2021E
Apart from that, Malaysia Healthcare Travel
Industry Blueprint 2021-2025 is expected to map Sources: MHTC, news
out the strategies and framework for healthcare
Aspiration to Provide the
travel industry stakeholders until 2025, as well as
“Best Malaysia Healthcare Travel Experience
to build up Malaysia's healthcare brand
internationally.
by 2025”
Focusing on:
On top of that, the MHTC is expected to receive
an allocation of RM20.0 million next year under
Budget 2022 to promote Malaysia’s medical
tourism sector globally. The allocation is aimed to
support Malaysia as one of the top medical
tourism destinations in the region.
ECONOMIC RESEARCH Source: MHTC Blueprint 2021 Page 41HEALTHCARE - BED OCCUPANCY RATES ARE IMPROVING
03 Occupancy Rate 04 Population Growth
The occupancy rate in hospitals is anticipated Malaysia’s population in 3Q2021 is estimated to
to improve further after the government be 32.67 million, expanding by 0.2% y-o-y from
allowed inter-state travel which could further 32.60 million in the same period last year.
spur demand for medical treatment.
The percentage of population aged 65 years
In addition, higher vaccination rates in and above (old age) is expected to increase
Malaysia could help to give some conviction from 7.1% in 3Q2020 to 7.4% in 3Q2021. This would
for customers who were previously reluctant to translate into higher demand for healthcare
get elective treatments and undergo surgeries services particularly for complex diseases
at the hospitals due to the fear of being treatment.
infected by the coronavirus.
Thus far, KPJ (3Q2021: 44.0% vs. 2Q2021: 41.0%)
Downside Risk
recorded an increasing trend for their
occupancy rates, mainly contributed by The threat of new variants could lead to the
higher elective treatments and Covid-19 tests. reimposition of lockdowns. As such, this would
Meanwhile, IHH Healthcare sustained its affect the recovery in occupancy rates due to
occupancy rate at 48.0% during 3Q2021. slow return of patients seeking for treatments.
Apart from that, there is an anticipation of a
3Q2021 3Q2021 regulatory risk from the potential new price
48.0% 44.0% controls on medicines in Malaysia to ensure that
2Q2021 2Q2021 treatment costs in private hospitals do not
48.0% 41.0% increase arbitrarily, which may affect the
earnings and margins of these companies.
ECONOMIC RESEARCH Page 42POWER – NOTEWORTHY GLOBAL TRENDS ARE GOING TO CHANGE
THE FUTURE OF THE POWER INDUSTRY
Key factors driving the growth of RE
Lower generation cost for solar photovoltaics
(PV).
Potential development of new Waste-to-Energy
(WTE) plant to manage increasing municipal solid
waste (MSW).
Leveraging full hydro potential.
Government incentives e.g. green tax allowance
and exemption, as well as open-bidding tender
under the Fit-in Tariff (FiT) scheme, Net Energy
Metering (NEM), Large Scale Solar (LSS), and the
New Enhanced Dispatched Arrangement
Source: TNB (NEDA).
Tenaga Nasional Berhad (TNB)’s total demand sales rebounded by 0.6% y-o-y during first nine months this year
compared to a 6.1% contraction in the same period last year as consumption activities were picking up.
The demand sales are anticipated to sustain its recovery in the upcoming months in view of reopening of the
economy that would push up the domestic and industrial consumption.
As for Malaysia’s Renewable Energy (RE) field, we foresee that the prospects will remain upbeat in the long run.
In addition, Malaysia is focusing on its power generation plan with a target of 31.0% (8,531 MW) and 40.0% (10,944
MW) RE capacity mix in 2025 and 2035 respectively in terms of installed capacity.
Meanwhile, the Large Scale Solar 4 (LSS4) project bids are expected to start commercial operations by 2023 with
each plant having a minimum operational period of 21 years.
RE players would also benefit in the longer term as the environmental, social and governance (ESG) screening is
gaining ground in banking sector.
Furthermore, green initiatives by the government during Budget 2022 particularly efforts to promote higher usage
of EVs would have positive impact on demand for RE in long run.
Hence, the maintain our positive call for this sector.
Note: Gigawatt hours (GwH), Megawatt (MW)
ECONOMIC RESEARCH Page 43SEMICONDUCTOR – POSITIVE MOMENTUM IS EXPECTED TO PERSIST
NEXT YEAR
10-Y CAGR of 8.2%
Sources: CEIC, SIA Source: CEIC
The Covid-19 outbreak has prompted a massive trend towards remote working while the advent of Internet of
Things (IoT) and Artificial Intelligence (AI) are driving the high-end application segment across the consumer
electronics and automotive industries.
This was reflected in the continued increase in Global Semiconductor Sales (GSS) which has been recording a
double-digit growth for 9 straight months since early 2021 (September: 27.6% vs. August: 29.9%).
Following this, Malaysia’s exports of Electrical & Electronic (E&E) products continued to record stellar performance
with the trade surplus for E&E products widening at a 10-Year Compound Annual Growth Rate (CAGR) of 8.2%.
Nevertheless, the production of electronic products have showed signs of easing as of late.
According to the IHS Markit, Global Electronics Purchasing Manager’s Index (PMI) softened to 58.3 points in
October (September: 58.5 points) after reaching its peak of 61.2 points in May. The slower growth was mainly
affected by short supplies of raw materials and key components.
These factors have constrained production activities and led to the rise in backlogs which have damped the
sector growth quite considerably.
Nevertheless, demand conditions still remain strong across the globe as firms are scaling up their business for
growth with employment rising sharply.
ECONOMIC RESEARCH Page 44SEMICONDUCTOR – POSITIVE MOMENTUM IS EXPECTED TO PERSIST
NEXT YEAR (CONT’D)
WSTS Market Forecast Fall 2021
Source: SEMI.org Source: WSTS
Apart from that, industry players across the world have been ramping up their production with another 10
high-volume fabs which will be constructed next year.
In 2022, the World Semiconductor Trade Statistics (WSTS) forecasted that the global semiconductor market
will grow positively by 8.8% in 2022 though slower compared to an estimated 25.6% increase this year.
All in all, we foresee that the gradual reopening of other countries will have a positive impact on the
semiconductor industry in Malaysia in the long run. This will be further supported by the push towards
digitalisation and the adoption of new technologies, fuelling chip demand.
Therefore, the narrative for now remains firmly focused on the supply-related issues which has been
weighing across market segments.
Meanwhile, the possible threat from the Omicron variant will likely result in stronger demand for
semiconductor components as more people continue to use electronic devices when working remotely.
As such, we maintain our positive stance for the manufacturing of semiconductors.
ECONOMIC RESEARCH Page 45OIL & GAS – PROFITABILITY OF PETRONAS GRADUALLY
IMPROVED FOR 9M2021
Financial Performance of Petronas
Performance Year-on-year Year-on-year
3Q2020 3Q2021 9M2020 9M2021
(RM Billion) growth (%) growth (%)
Revenue 41.1 61.8 50.4% 134.7 171.4 27.2%
Operating Profit/(Loss) 1.1 19.9 -1709.1% -10.1 51.8 612.9%
Profit/(Loss) After Tax -3.4 16.3 579.4% -19.9 35.2 276.9%
Source: Petronas, Bank Islam
Petronas posted a profit after tax of RM35.2 billion in
Capital Expenditure of Petronas, RM
9M2021 compared to a RM19.9 billion loss after tax in
9M2020. The improvement was mainly due to the Billion
66.4% increase in average Brent crude oil price to 20.0 97.0% 120.0%
USD67.92 per barrel in 9M2021 from USD40.82 per 16.0 80.0%
barrel during 9M2020. Total daily production average
for 9M2021 was 3.6% higher at 2,269k barrels of 12.0 40.0%
2.4% -4.8% 0.0%
equivalent (boe) per day (9M2020: 2,190K boe per 8.0
-6.9% -14.9% -21.2% 0.0%
day). -41.7% -42.3%
However, Petronas’ capital expenditure (capex) 4.0 -40.0%
dropped by 9.3% y-o-y to RM20.4 billion in 9M2021 0.0 -80.0%
(9M2020: RM22.5 billion) amid project delays and
rephasing of activities during the MCO.
At this stage, the capex incurred during 9M2021 worth
RM20.4 billion appears to be below Petronas’ annual RM billion Year-on-year growth (%) - RHS
capex target of RM40.0 billion to RM45.0 billion from
2021 to 2025. Source: Petronas
ECONOMIC RESEARCH Page 46OIL & GAS – DRILLING ACTIVITIES CONTINUE TO SEE A PICKUP
Velesto Energy Berhad-Average Asset
Utilisation Rate, %
100.0% 92.0%
86.0% 86.0%
80.0%
67.0%
60.0%
60.0% 53.0% 51.0%
38.0%
40.0%
28.0%
20.0%
0.0%
3Q2019 4Q2019 1Q2020 2Q2020 3Q2020 4Q2020 1Q2021 2Q2021 3Q2021
Source: Velesto Energy Berhad Source: Baker Hughes
Notwithstanding the slow spending on projects, we remain convinced that oil & gas contract rollouts will gather
momentum, particularly in selected segments in the value chain better positioned to benefit from projects
sanctioned by national oil companies. For instance, the floating production storage and offloading (FPSO)
subsector which saw a decimated number of operators during the previous downturn in 2015 to 2017.
The average asset utilisation rate of companies such as Velesto Energy Berhad has also been steadily increasing
from 28.0% in 1Q2021 to 51.0% in 3Q2021. In the same vein, number of global oil rigs inched higher to 1,504 rigs in
October (September: 1,448 rigs) compared to 1,016 rigs in the same period last year.
Therefore, it is clear that demand prospects for oil has been increasing in light of economies being reopened while
opportunities to venture into cleaner fuel such as Liquefied Natural Gas (LNG) is gaining traction. As such, we
maintain our positive stance on the oil & gas sector, barring any unforeseen circumstances coming from the
threat of the Omicron variant that could dampen oil demand.
At this juncture, we have maintained our year-end Brent crude oil price projection of USD72.27 per barrel for 2021
and USD68.37 per barrel for 2022 amid fears of a resurgence of Covid-19 cases. Even if the Omicron variant is not
proven to lead to severe symptoms, a normal growth scenario could see higher production by the Organization of
the Petroleum Exporting Countries (OPEC) together with countries such as the U.S. and Japan releasing their
national oil reserves to contain oil prices.
ECONOMIC RESEARCH Page 47TELECOMMUNICATIONS – 5G IS HERE TO STAY
Deployment of 5G infrastructure
Price of each gigabyte (GB) sold to telco
operators
Type Of Network Price Per GB
4G Around RM0.45 to RM0.55
5G Less than RM0.20
Source: The Vibes
Source: Ernst & Young report commissioned by DNB
Reuters on 11 November reported that none of Malaysia’s major mobile carriers have agreed to use
Digital Nasional Berhad (DNB)’s 5G network due to transparency and pricing issues.
In DNB’s defense, it said that negotiations on pricing would begin only after an applicable
reference access offer (RAO) document, which forms the basis for DNB’s entering into commercial
agreements with licensees seeking access to the 5G network.
Latest developments show that DNB will charge telco firms far less for 5G network than the cost
operators have incurred for 4G as quoted by the finance minister, Tengku Zafrul Abdul Aziz during
the parliamentary session on 25 November.
The finance minister cited that each telco firm will pay RM350.0 million to RM400.0 million a year to
DNB for 5G, compared with the RM1.0 billion that telcos invest as capital expenditure for 4G every
year. This can translate into savings of more than 50.0% and lead to lower reduced service prices
for their customers and users. The pricing is currently awaiting approval from the industry regulator
which will ensure that price set is fair and based on cost recovery, and not to make a profit.
ECONOMIC RESEARCH Page 48TELECOMMUNICATIONS – THE CASE FOR STRONGER INTERNET CONNECTIVITY IS STRONG AMID HIGHER NUMBER OF SUBSCRIBERS Source: Telekom Malaysia Source: Maxis We posit an opinion that a fair price for telco players to participate in the 5G network is essential to enhance the connectivity as the pandemic continues to linger and businesses still need to operate with more efficient technology. In fact, telco players continue to see an uptick in data usage in terms of numbers of subscribers. For instance, Telekom Malaysia’s number of Unifi customers jumped by 42.4% y-o-y to hit a record high of 2,347.0k subscribers in 3Q2021 from 1,648.0k subscribers in 3Q2020. Likewise, Maxis’ average data usage per user for both post-paid and pre-paid reached 25.0GB per month in 3Q2021 (2Q2021: 24.4GB per month), signifying the need of mobile data as flexible working arrangements remain in place for many organisations. All in all, we maintain our positive stance on the telecommunication sector as the adoption of 5G technologies could produce an incremental GDP impact across the Malaysian economy of RM 122.0 billion or 5.0% in 2030, compared to the baseline view of 2030 with no assumed 5G impact according to a study done by Ernst & Young. The possible threat coming from the Omicron should raise the urgency to deploy 5G technology as more people need to stay connected during the pandemic. Hence, we view the telecommunication sector to be somewhat immune from shocks of the pandemic and maintain our positive view for the sector. ECONOMIC RESEARCH Page 49
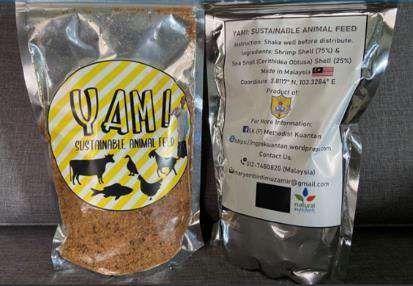
RUBBER GLOVES – NORMALISATION IN AVERAGE SELLING PRICES OF
RUBBER GLOVES
While ASPs are loftier relative to pre-pandemic
conditions, profitability per glove is approaching Average Selling Prices (ASPs) of Rubber
normality. Gloves, USD/1,000 Pieces
Based on a study done by Frost & Sullivan, ASPs of
80.0
rubber gloves are expected to decline to USD44.2 69.7
70.0
/1,000 pieces in 2022 after peaking at an estimated
level of USD69.7/1,000 pieces in 2021. 60.0
On further scrutiny, Top Glove’s ASPs were among 50.0 44.2
the earliest to see weakness, declining to the current 40.0 33.3
30.3
ASP of USD30/1,000 pieces from a peak of 30.0
26.9 24.6
21.0 20.7 21.1 21.6 21.0
USD120/1,000 pieces in 2Q2021.
20.0
The reason behind the normalisation of the ASPs of
rubber gloves is attributable to the drop in spot 10.0
orders as purchasers are no longer needing the 0.0
supplies urgently. 2015 2016 2017 2018 2019 2020 2021E 2022F 2023F 2024F 2025F
Another hurdle surrounding manufacturers of rubber Source: Frost & Sullivan
gloves comes in the form of restriction on glove Malaysia's Exports Growth of Rubber
imports by other countries. For example, the U.S.
Products, y-o-y%
Customs and Border Protection (CBP) has instructed
officers at all ports of entry in the U.S. to detain 250.0%
210.6%
disposable gloves produced in Malaysia by a group 200.0%
of companies collectively known as Smart Glove
150.0%
effective from 4 November.
The investigation by the U.S. CBP identified seven of 100.0%
the International Labour Organization’s (ILO)
50.0%
indicators of forced labour related to Smart Glove.
If such restrictions towards Malaysian rubber glove 0.0% -33.4%
companies were to be extended to many other 3.4%
-50.0%
companies, exports of rubber products, particularly
Oct-19
Dec-19
Jan-20
Oct-20
Dec-20
Jan-21
Oct-21
Nov-19
Feb-20
Apr-20
Aug-20
Sep-20
Nov-20
Feb-21
Apr-21
Aug-21
Sep-21
May-20
May-21
Mar-20
Jun-20
Jul-20
Mar-21
Jun-21
Jul-21
rubber gloves could dwindle further in the coming
months.
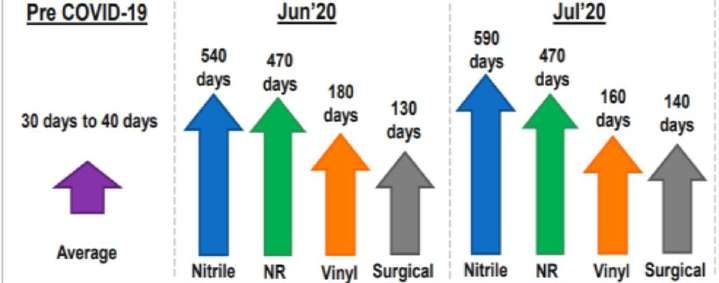
ECONOMIC RESEARCH Source: DOSM Page 50RUBBER GLOVES – THREAT FROM OMICRON COULD BE A CATALYST FOR
THE RUBBER GLOVE SECTOR
Notwithstanding this, the rubber glove sector may be in the spotlight again if scientists discover that
the Omicron variant is highly infectious and more dangerous compared to other variants.
When the pandemic outbreak first occurred and countries were rushing to get rubber glove
supplies, the lead time for all types of rubber gloves became longer than 100 days during June and
July last year compared to the pre-Covid-19 average of 30 days to 40 days.
Therefore, we cannot discount the possibility of this to happen again if the Omicron variant is proven
to cause severe symptoms. In addition, a possible spike in demand for rubber gloves due to the
Omicron variant could push the ASPs of rubber gloves higher.
As for now, the status of Omicron is uncertain and we maintain our neutral stance on the rubber
glove sector as our base case scenario stipulates that revenues of rubber gloves will continue to
drop in light of lower ASPs. While latest 3Q2021 financial results of rubber glove manufacturers show
that revenues were higher on a y-o-y basis, it was actually lower on q-o-q basis in light of lower ASPs
which have impacted sales.
Lead Time For Rubber Glove Production Quarterly Performance of Malaysian Rubber
According To Each Type Glove Makers
Revenue, y-o-y q-o-q
3Q2020 2Q2021 3Q2021
RM million change,% change, %
Hartalega 1.3 3.9 2.0 49.4% -48.5%
Supermax 1.4 1.9 1.5 7.6% -22.4%
Kossan 1.0 2.2 1.3 26.1% -41.8%
Source: Top Glove Source: Bursa Malaysia
Note: NR- Natural Rubber
ECONOMIC RESEARCH Page 51CONSTRUCTION – MORE TO CATCH UP
Construction output plummeted by 20.6% in 3Q2021 after expanding by a double-digit growth
of 40.3% previously, driven by limited operating capacities in light of containment measures to
curb the Covid-19 infections. However, construction activities showed some improvement
though still in a contractionary zone (9M2021: -2.6 vs. 9M2020: -21.3%) during the first nine
months of 2021.
On further scrutiny, three sub-sectors declined during 3Q2021 with Civil Engineering showing the
biggest drop (3Q2021: -36.1% vs. 2Q2021: 50.0%), followed by Residential Buildings (3Q2021: -
27.3% vs. 2Q2021: 16.3%) and Non-residential Buildings (3Q2021: -13.3% vs. 2Q2021: 34.8%).
These sub-sectors contributed about 93.8% out of total construction output last year.
Construction Output Growth, y-o-y% Percentage Share of Construction
60.0%
Sub-sectors in 2020
40.3%
40.0%
6.2%
Residentail
20.0% 25.1% Buildings
Non-Residential
Buildings
0.0%
42.3% Civil Engineering
-20.0% Special Trades
26.4%
-20.6% Activities
-40.0%
-44.5% Source: CEIC
-60.0%
3Q2018 1Q2019 3Q2019 1Q2020 3Q2020 1Q2021 3Q2021
Source: CEIC
ECONOMIC RESEARCH Page 52CONTSTRUCTION - HIGHER DEVELOPMENT EXPENDITURE
(DE) NEXT YEAR
A sizeable amount is allocated for DE
(2022F: RM75.6 billion vs. 2021E: RM 62.0
billion) to revive the economy that has
been hit by the pandemic. About 88.5% or
RM66.9 billion is distributed for 5,575
ongoing projects, while the balance is
slated for 1,180 new projects.
In terms of allocation by sector, the
Economic sector remains the largest
recipient at 53.2% in 2022 (2021E: 54.5%),
followed by Social (2022F: 30.0% vs. 2021E:
28.0%) and Security (2022F: 11.9% vs. 2021E:
11.8%).
Within the Economic sector, the
government would focus on Transport
Sources: MOF, CEIC
(2022F: RM15.5 billion vs. 2021E: RM13.0
billion) to construct, refurbish and maintain
Notwithstanding this, no new major infrastructure
key infrastructure, which includes existing
projects were mentioned under Budget 2022,
projects such as the Electrified Double
but rather small-mid sized projects were
Track Gemas-Johor Bahru, Rapid Transit
highlighted.
System Link, Pan Borneo Highway, as well
as the expansion of Kuantan Port in
All in all, we maintain our neutral call for the
Pahang and Sandakan Airport.
sector.
ECONOMIC RESEARCH Page 53CONSTRUCTION - PROJECTS WHICH ARE EXPECTED TO BE
IMPLEMENTED NEXT YEAR
Projects RM Billion
Rural Infrastructure* 2.5
Rural and inter-v illage roads 1.5
Water supply 0.4
Electricity supply 0.5
Street lightings 0.1
*RM1.5 billion is allocated for the development of rural
infrastructure in Sabah and Sarawak.
Development Projects for Recovery
Various infrastructure projects such as the construction of the
3.5
Pan
Borneo Highw ay and Central Spine Road
I nfrastructure Facilitation Fund 3.0 0.2
Small and medium projects for G1-G4 contractors 2.9
Inter-regional Development
Corridor dev elopment 0.7
Source: 2022 Budget Speech
In the absence of new major infrastructure projects next year, we believe the
government allocation on construction projects in 2022 will be mainly benefit the smaller
contractors rather than the main players.
ECONOMIC RESEARCH Page 54RESIDENTIAL PROPERTY – REMAIN NEUTRAL CALL
Property Transactions Property Unsold
134,829 transactions worth Residential property unsold
RM52.8 billion during 9M2021, improved in 3Q2021, declining by
growing by 3.0% y-o-y (9M2020: 59.8% y-o-y to 46,889 units (2Q2021:
130,877 transactions) in volume 119,109 units).
and 17.0% (RM45.1 billion) in Residential property overhang
value compared to the same dropped by 2.1% y-o-y to 30,290
period last year. units in 3Q2021 from 31,112 units in
the previous quarter.
Sales Performance House Price Index (HPI)
Sales performance for new Malaysian HPI declined by 0.7%
launches recorded a higher y-o-y in 3Q2021P* from a 1.0%
growth rate of 78.0% y-o-y to growth in the previous quarter.
reach 10,041 units during Average house price in
9M2021 from 5,641 units in the Malaysia softened from
same period last year. RM436,958 in 2Q2021 to
RM428,458 in 3Q2021P*.
Source: NAPIC P*= Preliminary
ECONOMIC RESEARCH Page 55RESIDENTIAL PROPERTY – AFFORDABILITY ISSUES
01 Affordability
Affordability remains a pressing issue for Based on our computation using Median
home buyers especially when the jobless Multiple (MM) income technique, which is 3
rate is still above its pre-pandemic level of times of annual salary, houses in Malaysia are
3.3% (September: 4.5% vs. August: 4.6%). beyond affordable (Refer table below).
House Price Median Household Affordable House
States Affordable?
(3Q2021P*) Income (2020) Price
Malaysia 428,458 5,209 187,524 No
Kuala Lumpur 731,910 9,093 327,348 No
Selangor 490,779 7,300 262,800 No
Johor 369,772 5,690 204,840 No
Pulau Pinang 430,818 5,474 197,064 No
Perak 236,597 3,759 135,324 No
Negeri Sembilan 276,997 4,478 161,208 No
M elaka 205,305 5,447 196,092 No
Kedah 251,339 3,829 137,844 No
Pahang 236,556 4,033 145,188 No
Terengganu 278,463 4,790 172,440 No
Kelantan 227,343 3,010 108,360 No
Perlis 213,458 4,043 145,548 No
Sabah 465,579 3,773 135,828 No
Saraw ak 479,146 3,831 137,916 No
Sources: NAPIC, DOSM, Bank Islam
P= Preliminary Average house prices are still high despite showing a gradual
decline in 3Q2021P at RM428,458 (2Q2021: RM436,958).
ECONOMIC RESEARCH Page 56You can also read