ECONOMIC CONDITIONS & EMPLOYMENT OUTLOOK FOR THE OMAHA MSA
←
→
Page content transcription
If your browser does not render page correctly, please read the page content below
APRIL 2022

 ECONOMIC CONDITIONS &
 EMPLOYMENT OUTLOOK FOR
 THE OMAHA MSA

 INTRODUCTION
 Inside This Report
This report is the second annual assessment of the
Omaha-Council Bluffs Metropolitan Statistical Area (MSA) i/ Report Highlights
economy and employment outlook. The MSA is comprised
of three Iowa counties (Harrison, Mills, and Pottawattamie) 1/ U.S. Overview
and four Nebraska counties (Douglas, Sarpy, Saunders and
Washington). Data was used from a variety of sources such
 3/ Omaha MSA
as the U.S. Bureau of Labor Statistics, the U.S. Bureau of Overview
Economic Analysis, and the Nebraska Department of
Revenue, among others. The report includes the current 6/ U.S. Macroeconomic
national economic picture, the current state of the Omaha Forecast
economy, a national economic forecast from 2022 to 2025,
and an Omaha employment outlook over the period 2022 8/ Omaha MSA
to 2025. Employment Outlook
UNO Student Authors: Brandon Bergfalk, Tyler 10/ Appendix: Omaha
Billings, Jarold McWilliams, Maxwell Rivers, MSA Employment
Bryant Robertson, Christina Wagner, Eric Outlook: Sector Detail
Werther, and Blake Zellmer
Advisor: Dr. Christopher S. Decker

Department of Economics
College of Business Administration
University of Nebraska at Omaha
APRIL 2022

 REPORT HIGHLIGHTS
After growing 5.0 percent in 2021, US Gross Domestic Product is forecast to
slow to 3.7 percent in 2022. Between 2022 and 2025, US GDP will average
about 2.0 percent per year.

After enjoying exceptionally low inflation for over a decade, the US economy
appears to have entered a “new normal” when it comes to price increases.
Labor shortages are pushing wage rates higher and supply chain disruptions
are proving to take longer than expected to rectify. As a result, inflation will
likely remain high by historical standards. Growth in the Consumer Price
Index is expected to grow 3.71 percent in 2022 and stay above 2.0 percent
through 2025.

As a result of this, interest rates are expected increase and remain on the
high side. After years at historically low levels, the ten-year bond yield is
expected to hover between 4.0 and 5.0 percent through 2025.

As the Omaha continues to recover from the 2020 COVID-19 recession, job
growth in the metro is expected to remain on a slow and steady trajectory.
Omaha nonfarm employment will to grow 1.1 percent per year on average
between 2022 and 2025. While an indication of a healthy economy, this
growth pattern does imply that the metro will not reach pre-COVID
employment levels until 2023.

Job growth will be spearheaded by gains in construction as there are several
large building projects planned in the next few years. Also, gains will occur
in leisure and hospitality, a sector absolutely devested by COVID, slowly
recovers, as the current, and especially large, number of job openings in that
sector slowly get filled.

Long-term employment challenges in durable goods, wholesale trade, and
information services are expected to continue through 2025.

Some evidence indicates that there is some down-side risk to the current
forecast. Inflationary concerns are present in the economy, driven primarily
by labor shortages, supply chain disruptions, and most recently, the war in
Ukraine. If inflation accelerates and continues to outpace wage growth, then
it is possible a recession could occur by late 2022 or early 2023. That said,
recent data on consumer spending and job formation continue to indicate
that there is still a significant amount of post-COVID pent-up demand to
support a growth outlook as the baseline forecast.

 i
APRIL 2022

 U.S. OVERVIEW
The national economy has enjoyed a healthy economic recovery following the COVID-19 global
pandemic, despite risks such as the Russia/Ukraine military conflict, the on-going challenges
with supply-chain disruptions, and significant labor shortages. The most recent data indicate
that the economy is experiencing strong post-COVID-19 recovery. Gross Domestic Product (GDP)
has grown steadily and consistent job creation has contributed to historically low
unemployment rates. The data however does suggest there is some inflationary pressure in the
economy as evidenced by a sharp increase in the consumer price index (CPI), wage growth, and
very high resignation rates that are reducing the available labor in the economy. There is a
notable burden on the Federal Reserve over the next 18 months to facilitate a "Soft Landing” by
attempting to curb inflation without causing a recession.

Figures 1a and 1b illustrate the growth pattern for the national economy from 2007 until the
start of the COVID-19 pandemic. GDP growth averaged 1.9 percent. However, by the second
quarter of 2020 GDP decreased by approximately 31.4 percent (annualized). Despite the sizeable
downturn, by the third quarter the economy began registering sustained growth. Fast forward
to the fourth quarter of 2021, GDP grew by approximately 7.0%, reaching $19.8 trillion, a historic
high.

Figure 1a: U.S. Real GDP ($millions) Figure 1b: U.S. Real GDP Growth (percent)
Source: U.S. Bureau of Economic Analysis Source: U.S. Bureau of Economic Analysis

Figures 2a and 2b show U.S. Nonfarm Employment growth prior to, and since, the height of the
COVID-19 pandemic (March 2020). After the historic 20.7 million decline in jobs in March 2020,
job additions have been steady. In the fourth quarter of 2021, the economy added 199,000 jobs.
Total jobs added since the shutdown currently stands at 18.8 million. While great headway has
been made, the economy still hasn’t recovered all the jobs lost in March 2020.

Figure 2a: U.S. Nonfarm Employment Change Figure 2b: U.S. Nonfarm Employment Change
Source: U.S. Bureau of Labor Statistics (1,000s) Source: U.S. Bureau of Labor Statistics (1,000s)

 1
APRIL 2022

The economy may struggle to add a substantial number of new jobs going forward. As shown in
Figures 3a and 3b, recent data suggest that the nation’s labor force is slowing relative to job
growth. Moreover, since the depths of the pandemic, the number of people quitting their jobs
has accelerated dramatically, reaching historic highs. Possible reasons for this phenomenon are
many, ranging from increases in early retirements, people returning to school, to avoiding
returning to jobs that don’t offer an attractive work-life balance.

Figure 3a: Job & Labor Force Growth Figure 3b: Resignations (1,000s) and Rates
Source: U.S. Bureau of Labor Statistics (1,000s) (percent).
 Source: U.S. Bureau of Labor Statistics

The increase in job openings, paired with a reluctance to return to the labor force, is
contributing to wage growth. When this is combined with continued world-wide supply chain
disruptions and escalation in energy prices, driven most recently by the war in Ukraine, overall
inflation is on the rise. Figures 4a and 4b illustrate these dynamics.

Figure 4a shows the relationship between inflation (as measured by growth in the overall
Consumer Price Index (CPI)) and the nation’s unemployment rate. For the 2008 to 2020 period,
the economy enjoyed stable prices and declining unemployment rates. Since the pandemic,
unemployment initially spiked and rapidly declined. At the same time, prices have increased.
Initially, this increase could be attributed to a healthy economic recovery. However, labor
shortages, supply chain issues, and international conflict have continued to fuel inflation.

Figure 4b illustrates the potential danger that current inflation rates pose to the economy. As
evidenced in the figure, since 2020 the rate of wage growth, is being outpaced by inflation
rates. The results is that the “real” purchasing power of consumers is declining. The could
significantly slow, or even stall, the economic recovery.

 Figure 4a: Inflation and Unemployment Figure 4b: Wage Growth and Inflation
 (percent) (percent)
 Source: U.S. Bureau of Labor Statistics Source: U.S. Bureau of Labor Statistics

 2
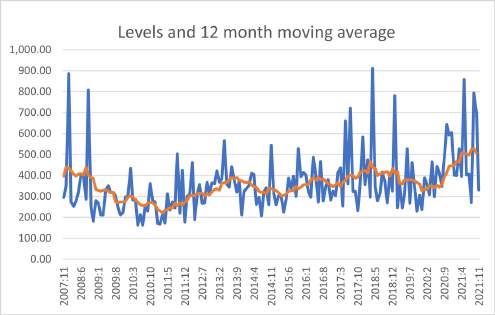
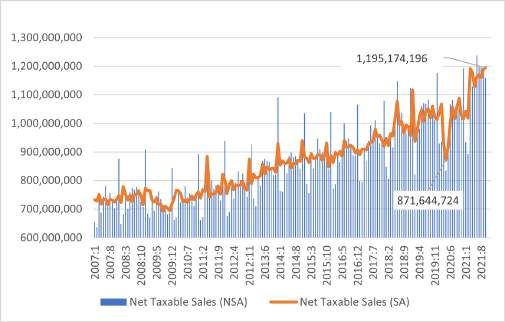
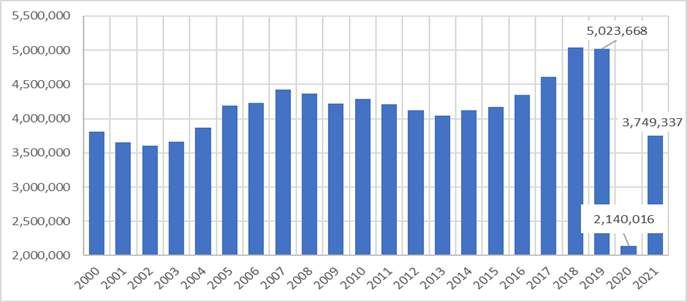
APRIL 2022

 OMAHA MSA OVERVIEW
Recent evidence illustrating the economic health of the Omaha MSA is provided below. The
overall picture is that the MSA is recovering very well from the recession caused by the COVID-19
pandemic. This is evidenced by growth in the metro’s housing market and retail sales data.

Figures 5a and 5b illustrate these trends. In Figure 5a we observe that, since the second quarter
of 2020, the 12-month moving average of the number of permits issued for new private housing
units has steadily increased to about 530 by the end of 2021.

Data on retail sales (Figure 5b) for Douglas and Sarpy counties, obtained from the Nebraska
Department of Revenue, also supports a healthy recovery. Focusing on the seasonally adjusted
series, we see that retail sales bottomed-out at $871 million in March 2020 then increased to a
$1.2 billion level by August 2021 (the latest data available at the time of this writing).

Figure 5a: New Housing Permits Figure 5b: Net Taxable Sales
Source: U.S. Census Bureau Source: Nebraska Department of Revenue

 A useful indicator of economic performance is air traffic at Eppley Airfield. An increase in
 economic activity typically correlates with an increase in business and personal travel. While
 data is not as high-frequency as other data series, we have seen total passenger counts increase
 substantially in 2021 when compared to 2020. In 2020, Eppley recorded 2.1 million total
 passengers. In 2021, that figure had increased to 3.8 million, a 75 percent jump (Figure 6)!

 Figure 6: Passengers at Omaha Eppley Airfield
 Source: Omaha Airport Authority

 3
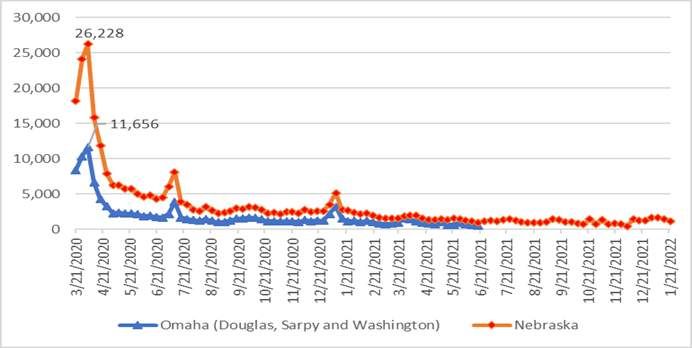
APRIL 2022

Another leading indicator, particularly of future employment growth, is weekly initial claims for
unemployment insurance. Higher (lower) values indicate less (more) hiring activity. In Figure 7,
we observe in Omaha initial claims reached a historic high of 11,656 claims in March of 2020.
Since then, claims have fallen dramatically, currently hovering under 500 claims for the MSA.

 Figure 7: Initial Weekly Claims for Unemployment Insurance
 Source: Nebraska Department of Labor

Based on the unemployment claims data, it is not surprising that both Omaha and Nebraska
have experienced significant job growth since the pandemic hit. Figures 8a and 8b show
seasonally adjusted total nonfarm employment and the corresponding seasonally adjusted
unemployment rates for both the state and the MSA.

Figure 8a highlights the job gains since the pandemic hit. After losing nearly all the jobs gained
since the previous recession in 2009, employment in the metro has rebounded dramatically
since the third quarter of 2020. While not yet at pre-COVID shutdown levels (510,200), the metro
has regained 42,000 jobs to reach 499,000.

Figure 8b shows the unemployment rate for the Omaha MSA and Nebraska. Both the metro
and the state have reached historic lows. Specifically, the state unemployment rate reached 2.3
percent in December 2021. Notably, in December 2021, the MSA’s unemployment rate was 1.6
percent, which is lower than the state; a condition that deviates from historical patterns.

Figure 8a: Nonfarm Employment (1000s), Figure 8b: Unemployment Rates
Omaha & Nebraska (percent)
Source: U.S. Bureau of Labor Statistics Source: U.S. Bureau of Labor Statistics

 4
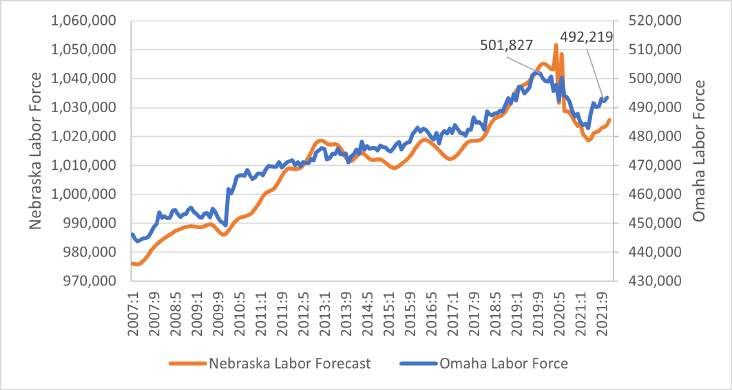
APRIL 2022

As suggested earlier, it may be difficult for both the metro and the state to exceed pre-COVID
shutdown employment levels soon. The challenge is apparent when looking at MSA’s and state
labor force figures. Figure 9 illustrates the (seasonally adjusted) labor force patterns for both
Nebraska and Omaha. Prior to the COVID-19 pandemic, the number of individuals in the labor
force reached 501,827. However, labor force participation in the metro started declining in late
2019 and did not begin to recover until 2021. Labor force participation has continued to
increase, and as of November 2021 includes 492,219 individuals; this is still below pre-pandemic
levels.
 Figure 9: Omaha & NE Labor Force
 Source: U.S. Bureau of Labor Statistics

 5
APRIL 2022

 U.S. MACROECONOMIC FORECAST
Table 1 provides an overview of our current US economic forecast from 2022 to 2025. While
there are new and increasing risks to economic growth due to inflation, current expectations
are that the US economy will still expand over the next four years. There appears to be sufficient
post-pandemic pent-up demand and recent and future actions by the US Federal Reserve (Fed)
to control inflation are expected.

Table 1: Macroeconomic Outlook ($ millions)
Source: Authors’ calculations based on data from U.S. Bureau of Economic Analysis, U.S. Bureau of Labor
Statistics and U.S. Federal Reserve
*Real 2012 Dollars (chain-weighted)

Following a strong 5.7 percent increase in GDP in 2021, growth is expected to continue, albeit at
a slower pace. GDP will grow 3.75 percent in 2022 and then gradually return to a long-term rate
of 2.0 percent by 2025, in line with the economy’s overall inflation-neutral economic potential
(Figure 10). Most of this growth is expected to come from consumer spending and exports,
particularly as other countries’ economies continue to recover from the pandemic-driven
recession. Some growth will come from investment spending as well. However, compared to
the surge of over 7.0 percent in 2021, investment growth is expected to slow as the Fed ratchets
up interest rates which will likely cool the housing market and curb business spending on new
plant and equipment.

 6
APRIL 2022

 Figure 10: U.S. GDP Growth (percent)
 Source: Authors’ calculations

Inflation is likely to be higher than it has been in recent years. However, it is expected to remain
steady over the next four years. This will largely be driven by a tighter labor market going
forward. Early retirements and slower overall population growth will hinder labor force growth
in the next four years, keeping wages higher than their historical average (see Figure 11).

 Figure 11: Inflation & Wage Growth (percent)
 Source: Authors’ calculations

 7
APRIL 2022

 OMAHA MSA EMPLOYMENT FORECAST
Table 2 presents a detailed Omaha MSA employment outlook for the period 2022 to 2025.
Detailed discussions of each sector are in this report’s Appendix. An overview of the outlook and
selected highlights are provided below.

Omaha’s total nonfarm employment is expected to grow 1.1 percent over the next four years,
reaching pre-COVID levels by late 2023 and clearing 516,000 jobs by 2025. Sources of growth are
expected to come form several sectors. Mining, Logging, and Construction is likely to grow at a
2.1 percent clip over the next few years as several major construction projects are expected to
begin in 2022. Hospitality and Leisure is expected to regain momentum following devastating
losses in 2020. Compared to historical growth rates, the relatively rapid 4.0 percent growth rate
is indicative of a sector that is sensitive to both state and national GDP growth and one that will
take some time to clime back to its pre-COVID levels.

Table 2: Omaha Employment MSA Outlook (1,000s)
Source: Authors’ calculations

 8
APRIL 2022

These growth areas are offsetting continued retrenchment in several sectors that have been
experiencing long-term employment declines. These sectors include Durable Goods, Wholesale
Trade, and Information, all of which have borne witness to employment declines mainly as a
result of technological innovations in production and information, as well as diffusion of
internet-based transactions.

Overall, then, the Omaha economy is expected to steadily add jobs over the 2022 to 2025
(Figures 12a and 12b).

However, there are risks to the forecast. For instance, the forecast assumes Omaha will regain
some labor force lost during the COVID-19 recession. Second, the forecast is based on overall
GDP growth nationally. Should a recession hit the US, perhaps due to uncontrolled inflation, or
reductions in trade due to international conflict, the Omaha economy will likely experience a
slowdown. However, the present state of the economy, as well as recent trends, suggest the
current outlook is the most likely.

Figure 12a: Nonfarm Employment (1,000s) Figure 12b: Nonfarm Employment Growth
 (Percent)

 9
APRIL 2022

 APPENDIX
THE OMAHA MSA EMPLOYMENT FORECAST:
 SECTOR DETAIL

Sector Page
 Mining, Logging, and Construction by Christina Wagner and Christopher Decker 11
 Durables Goods by Blake Zellmer 13
 Non-Durable Goods by Brandon Bergfalk 15
 Wholesale Trade by Christina Wagner and Christopher Decker 17
 Retail Trade by Jarold McWilliams 19
 Transportation, Warehousing, and Utilities by Maxwell Rivers 21
 Information by Tyler Billings 24
 Financial Activities by Christina Wagner 26
 Education and health Services by Eric Werther 28
 Leisure and Hospitality by Christina Wagner 30
 Professional and Business Services by Bryant Robertson 32
 Other Services by Class 34
 Government by Tyler Billings 36

 10
APRIL 2022

 MINING, LOGGING, AND CONSTRUCTION
 Christina Wagner and Christopher Decker

 Historical Patterns
 The Mining, Logging, and Construction sector comprises firms that are mining and drilling for oil,
 gas, coal, metals, and other natural resources, as well as those in the timber harvesting industry
 and firms in the construction of both commercial and residential structures. For Omaha, nearly
 all the activity in this sector is in construction. Therefore, the jobs tracked in this sector measure
 the number of contractors and construction workers in the MSA.

 The sector is very sensitive to business cycles generally. Construction employment dropped off
 substantially between 2008 and 2011, a consequence of the housing crisis of the “great
 recession.” Since 2011, however, jobs gains have been substantial. Between 2015 and 2019, the
 sector added nearly 5,000 jobs to the Omaha economy. COVID appears also to have had little
 impact on construction. Job formation dropped in 2020, but by less than one percent. In 2021,
 growth returned, albeit at a relatively slow pace.

 Forecast Model
 Several models were tested to see which one produced the most reliable and credible forecast
 for this sector. Root mean squared errors and mean error tests were performed on each model,
 and ex-ante (out of sample) forecasts were generated and evaluated. Based on the data, an
 exponential smoothing model provided the best fit and was selected as the basis of the forecast.
 The parameters for the level (L) and trend (T) equations that were found to best predict
 employment are given in the equations below:

 ( ) = 1.0* ( ) + 0.0*( ( −1)+ (t-1))
 T( ) = 0.3*(L(t)- ( −t)) + 0.7*( (t-1))

Figure: Mining, Logging, and Construction Table: Employment Outlook

 11
APRIL 2022

The Outlook

The above figure table show the forecast. While residential construction, having been reasonably
robust in Omaha in 2021, might slow in future years due to expected increases in mortgage
rates, a recent forecast from Dodge Data & Analytics (source available upon request) is calling for
new construction projects in Omaha to grow 13 percent annually between 2021 and 2023. there
are several new stadiums being constructed that will be completed at various times in 2023. As
Omaha continues to expand, the city seeks to modernize former industrial and rural areas in
addition to increasing walkability. Several sizeable projects are currently underway, totaling
more than $7.9 billion in spending, and span from downtown Omaha to West Omaha. Projects
include a new Mutual of Omaha tower, revitalization of the Omaha Riverfront area,

Implementing a downtown streetcar system, constructing various mixed-use developments,
turning the Crossroads area into an entertainment district, various renovations around UNMC,
and a $1.5 billion development in West Omaha that will include apartments, dining, and
shopping. Employment will continue to grow at a steady pace from 2022 through 2025,
hovering around 2% year over year. The forecast indicates employment will increase by
approximately 6% by the end of 2025. There are several sizeable construction projects in the
Omaha MSA, however growth will moderate compared to historical figures due to materials and
labor shortages. Nevertheless, it will be a major engine of job growth for the Omaha economy in
coming years.

 12
APRIL 2022

 DURABLE GOODS
Blake Zellmer

Historical Patterns
The Durable Goods sector is comprised mostly of manufacturing of durable goods. For Omaha this
is primarily farm equipment. Employment in this sector has been steadily declining, experiencing a
significant swing downward in 2009, dropping 12.1 percent due to the “great recession”. After
bouncing back 4.4% in 2013, employment has continued to decline steadily, with an average
decrease in employment of 1% per year since 2013.

Despite declines, there is evidence that equipment orders are steady and increasing. This,
combined with the steady employment declines in Omaha suggest that 1) manufacturing is
locating outside of the metro (there is evidence that the state employment declines are slower than
Omaha’s), and 2) manufacturing is becoming less labor-intensive as new technologies come online.

The Forecast Model
After testing several models to see which would provide the most reliable and credible forecast for
the Durable Goods sector, the Exponential Smoothing (ES) model provided the best result. For all
models, both root mean squared error and mean error tests were performed, as well as ex-ante
forecasts generated and evaluated. As shown in the forecast below, it predicts a continuation of a
steady and slow decline as has been seen in recent years. This is so because the ES model creates a
trend which closely follows the most recent observations.

The parameters for the level (L) and trend (T) equations for the ES model that were found to best
predict employment are given in the equations below:

 ( )=(1.0) ( ) + (0.0)( ( -1)+ (t-1))
 T( )=(0.22)(L(t)- ( -1)) + (0.78)( (t-1))

Figure: Durable Goods Table: Employment Outlook

 13
APRIL 2022

The Outlook
Above, the table on the right shows the forecast with exact values, the graph on the left is present
to better visualize those numbers and trends. As it stands, we expect that the Durable Goods sector
will decrease steadily around 0.61 percent for the next four years, dropping to roughly 10,720 jobs by
2025. This rate of decline is slower than averaged in years prior, but over the past decade however,
nothing suggests a jobs increase will happen for this sector. It was already on the decline prior to
the COVID-19 pandemic. However, declines should slow as orders for new equipment remain
healthy.

 14
APRIL 2022

 NONDURABLE GOODS
Brandon Bergfalk

Overview
 Nondurable goods are items we consume in a single use. As opposed to durable goods, which
 persist in their value over time, all the value of nondurables is received at once. Common
 examples are food, cigarettes, alcohol, toilet paper, and cosmetics. These goods are critical to
 our everyday lives and the consumption of them underwent notable turbulence during the
 COVID-19 pandemic.

Historical Patterns
Employment growth in the nondurables sector of Omaha, NE has been slow and steady for the last
two decades, interrupted briefly by the Global Financial Crisis (GFC) in 2008 and the pandemic in
2020. The sector grew by 8% from 1995 to 2008 and 11 percent from 2008 to 2021. Downward
movement during recessions is expected since nondurable goods are some of the more easily cut
out by consumers with less disposable income.

Forecast Model Selection
The downward spike in all employment during the COVID-19 pandemic makes fitting models to the
data a challenge. ES Holt-Winters and multivariate approaches gave promising diagnostic results, but
may be too optimistic and pessimistic, respectively.

 15
APRIL 2022

An autoregressive model returned the
smallest root mean squared errors (RMSE)
and offers the most moderate trend
coming out of the pandemic of all models
tested. The model’s use of the year
immediately prior to predict the current
year accounts for the upward trend in the
nondurables sector without disregarding
the recession brought on by the
pandemic.

Based on a comparison of these models, it
was determined the most reliable model
is the autoregressive model. Therefore, the
specific equation used to predict
employment for the years 2022-2025 was
calculated to be:

 y(t) = 0.133 + 1.001*y(t-1)

Forecast Outook
The forecast projects employment in the nondurables sector to grow by 0.7 percent per year
through 2025. This would see total nondurables jobs rise from 22,800 to 23,430, an addition of 630
jobs to the sector. Some growth is reasonable to expect as the economy continues to rebound from
the pandemic. The tempered prediction also accounts for concerns over continued supply chain
disruptions, possible shifts in labor force behaviors, and inflation cutting into disposable income
used to consume nondurable products.

 Figure and Table: The Forecast

 16
APRIL 2022

 WHOLESALE TRADE
Christina Wagner and Christopher Decker

Historical Patterns
Jobs in the Wholesale sector involve personnel that serve various roles that facilitate the transfer
of goods from manufacturer to retail establishments. These positions largely involve facilitating
sales between producer and retailer.

Wholesale trade in Omaha is mainly impacted by trends in Nebraska’s agriculture industries. The
sector has seen steady declines in employment since 2000, specifically, employment decreased
by 24 percent from 2000 to 2021. The downward trend is largely due to increased direct sales
occurring between the manufacturer and the end consumer. More direct transactions are made
possible by innovations in internet access and online sales platforms.

Moreover, improved methods for managing sales accounts with retailers has allowed for more
accounts to be managed by fewer wholesale agents. These scale economies have reduced
employment needs. While the overall employment levels have been trending downward, since
2012, number of workers employed in wholesaling has leveled off, hold steady about 16,700, with
only minor variations. That said, a strong agricultural sector led to a jump in sales and
employment in 2021, both in the state and the metro. This will likely not persist, however.

Forecast Model
Several models were assessed to see which one seemed to produce the most reliable and
credible forecast for this sector. Root mean squared errors and mean error tests were performed
on each model, and ex-ante (out of sample) forecasts were generated and evaluated. According
to this analysis, an autoregressive model of order 1 was selected which implies that wholesale
employment depends on last year’s wholesale employment value. In the equation as shown
below, yt is the employment level in “wholesale employment”:

 y(t) = 0.202 + 1.005*y(t-1).

 The Outlook

The above figure table show the forecast. Given long-term historical trends attributable to
improved communication and sales management technology, wholesale trade employment is
expected retrench from 2021 levels. Overall, employment will decrease from a 2021 high of
about 17,000 to a 2025 low of approximately 16, 600. This steady decline, of about 0.68 percent,
is expected to continue through 2025.

 17
APRIL 2022

Figure: Wholesale Trade Table: Employment Outlook

 18
APRIL 2022

 RETAIL
Jarold McWilliams

 The coverage of this report includes the Omaha metropolitan statistical area (MSA) retail sector.
Analysis of the Omaha retail sector includes a forecast of employment and gross domestic
product (GDP) in this sector. The retail sector consists of motor vehicle and parts dealers, food
and beverage stores, grocery stores, and general merchandise stores. Data is sourced from
either Bureau of Labor Statistics (BLS) or Bureau of Economic Analysis (BEA) survey data. The
forecast period is from 2021-2025 for GDP data and 2022-2025 for employment data. Forecasts
are conducted using authors' calculations based on common econometric forecasting methods.
Considering the strong economic recovery period both nationally and locally along with very
low unemployment locally, we expect GDP in the Omaha retail sector to continue healthy
growth. However, we expect the relatively stagnant long-term trend in retail employment to
continue. The following sections will explain our methodology and forecasting results in greater
detail.

Historical Patterns

From 1991 to 2001, Omaha retail sector employment grew from approximately 47,000
employees to 55,000 employees. However, following a decline starting in the early 2000s, retail
employment has leveled off to around 52,000 employees up to the present day. Omaha retail
sector GDP starts at around $2.6 billion in the early 2000s before rising to nearly $3 billion by
the mid-2000s ( Figure 1R). However, the Great Recession period caused retail GDP to fall back
to $2.6 billion from 2009-2012. From 2013 to the present day, there has been a clear growth
trend in retail value added, with GDP reaching $3.3 billion by 2019.

 Figure 1R: Omaha Retail GDP Forecast to 2025
 Source: US BEA and authors’ calculations

 19
APRIL 2022

Forecast Model
Using this historical data, we constructed forecasting models for Omaha retail employment and
GDP to predict future trends out to 2025. For the GDP forecast, we found a multivariate model
that incorporated our predictions for national GDP, a lag factor, and trend term to produce the
most accurate forecast. We believe the incorporation of predicted national GDP was an
important factor in increasing the accuracy of the forecast for the local Omaha economy.

For the employment forecast, we found that two similarly accurate models, one incorporating a
trend and the other a multivariate model, predicted different outcomes. While both models had
merit, the multivariate model was ultimately selected. it seemed to product the most viable
forecast given current expectations for the sector. The equation is:

 y(t) = 7.697 + .0802*y(t-1) - 0.111*trend + 0.000304*GDP(t).

The Outlook
The forecast period runs from 2021-2025 for GDP data and 2022-2025 for employment data.
From our GDP forecast, we expect relatively strong retail GDP growth throughout the forecast
period. Strong predicted national GDP growth contributes to the growth in our Omaha retail
GDP forecast. We expect Omaha retail economic growth to remain strong as long as the
national economy does. Our predicted results expect Omaha retail GDP to reach nearly $3.7
billion by 2025.

This sector has been challenged by COVID-19. it was hard hit by the pandemic and the
subsequent shut-down. Since 2021, jobs have been added. However, people have been hesitant
to return to retail jobs and online shopping continues to slow labor demand. That said, given
overall growth prospects for the economy and the sector (as evidenced by our GDP forecast for
retail), wages will likely increase and flexible hours will be increasingly tolerated by employers,
both of which should pull workers back in. Therefore, we expect modest growth through 2025
of about 0.30 percent per year.

 20
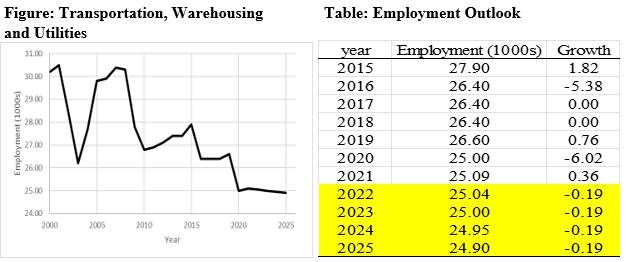
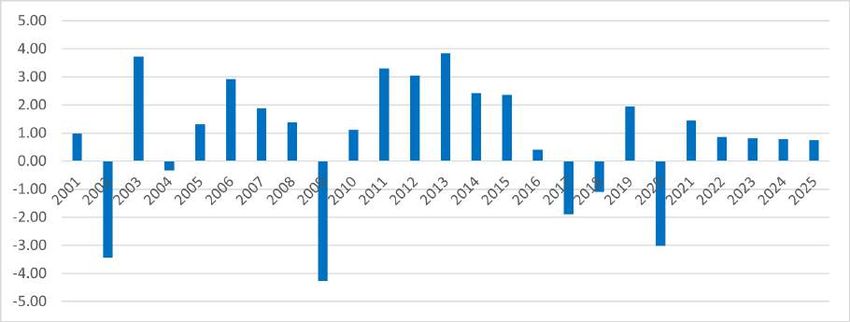
APRIL 2022

 TRANSPORTATION & UTILITIES SECTOR
Maxwell Rivers
The Transportation and Utilities economic sector includes engagements with wholesale & retail
merchandising/distribution, warehousing, and public utilities (i.e electric power, natural gas,
water, and sewage).

Historical Trends
The Transportation and Utilities sectors are an extremely vital part of every microeconomy. In
2000, the sector comprised 6.7 percent of Omaha, NE employment. Because such a large slice
of the sector is built on public utilities with inelastic demand and price-fixing, industry
employment as a percentage of total non-farm declined to 5.1 percent or $25.1 million in 2021
amid broad MSA GDP growth. However, this period of stagnancy was partially offset by the rise
eCommerce post-2010, which requires an elevated level of warehousing to sustain operations.
Amazon maintains two warehouses in the Omaha area. One in North Omaha was built in the
last 10 years and a new Chalco location was completed in 2020. In all, estimated marginal job
gain from the warehouses totaled more than 1,000 new jobs with competitive pay and
desirable benefits.

It is also important to note that employment declined -by 6.1 percent between year-end 2019
and year-end 2020 due to the COVID-19 Global Pandemic, which was greater than the overall
-4.2 percent decline in non-farm GDP for the area. Historical patterns are depicted in the figure
below.

Figure: Historical Patterns

 21
APRIL 2022

Forecast Model Selection
Several models were tested to see which one produced the most reliable and credible forecast
for this sector. Root mean squared errors and mean error (RMSE) tests were performed on each
model, and ex-ante (out of sample) forecasts were generated and evaluated. Based on the data,
an exponential smoothing model provided the best fit and was selected as the basis of the
forecast. The model had a low RSME of 0.96, and a smooth growth trend amid the global
economic rebound from the COVID-19 pandemic.

A trend model and a multivariate model were also considered due to their low RSME of 0.73
and 0.27, respectively. However, both exhibited a strong deviation from the 2015-2021 trend.
While the outlook for both models are possible, a more conservative outlook is more probably
given the economic headwinds and uncertainty surrounding the micro and macro markets.
Therefore, based on the data, an exponential smoothing model provided the best fit and was
selected as the basis of the forecast. The parameters for the level (L) and trend (T) equations that
were found to best predict employment are given in the equations below:

 22
APRIL 2022

The Outlook

Employment is forecast to decline by 0.19 percent per year. The growth trend is expected to
remain constant due to inelastic demand for public utility reductions in demand for truck
drivers and warehouse workers resulting from some degree of technological innovation and
labor force limitations.

There are some risks to the forecast, both positive and negative. Retail spending could drive an
increase in trucking and warehousing demand. Equally as likely, the decline in sector GDP could
accelerate due to i) The supply chain issues of 2021 are not fixed, ii) International & geopolitical
issues continue to blur the broad economic outlook, iii) Wage gains and consumer spending are
offset by inflationary factors or we experience a recession as a result of Federal Reserve efforts to
curb inflation, or iv) Another aggressive COVID variant prompts a return to stay-at-home orders.

 23
APRIL 2022

 INFORMATION
Tyler Billings

 The Computer and Information Technology sector is a high demand and quickly growing field. With
 projected growth of 13% over the next decade within the U.S., it is growing faster than the average for
 all other occupations. Additionally, with median wages over twice than all other occupation there is
 clear labor demand for workers with this skillset.

 Background and historical Trends

 The Information sector is a broad category of
 employment which covers any worker or
 establishment that is involved in the producing
 and distribution of information, providing the
 infrastructure to distribute the data, as well as
 those responsible for processing data. While this
 sector includes the publishing, motion picture,
 and sound recording industries, those are not the
 driving industries in Omaha’s information sector.
 Omaha’s primary source of information workers
 comes from its software engineers, system
 administrators, network engineers, and data
 center operators. These positions are existed
 thanks to Omaha’s FinTech companies, financial
 institutions, and numerous shared and private
 data centers. This is all added by Omaha’s unique
 location which puts it at the convergence of six
 national fiber optic networks. This demand for
 skilled labor is supported by Omaha’s numerous
 educational institutions such as UNO’s Peter
 Kiewit Institute, Creighton’s Institute of
 Information Technology, Metro Community
 College, and those retiring service members out
 of Offutt Air Force Base.

 As can be seen in the graph to the right, the
 sector has been in a decline since the tech
 bubble burst in the early 2000s. Although there
 was a leveling off in employment during the
 great recession and even an uptick between 2014
 and 2016 the sector continued its decline
 afterwards.

 Overall, we see an average decline of 1.3 percent
 on an annual basis for the past decade. Like
 many other industries, the information sector was
 severely affected by the COVID-19 pandemic
 where we saw a decrease of over 6 percent in
 2020.

 24
APRIL 2022

The Model

 Four different models were tested to determine which one possessed the greatest predictive ability for
 the Information sector. The primary tests for the models’ accuracy were the root mean squared errors
 and the mean error. Additionally, ex-ante (out-of-sample) forecasts were created and evaluated.
 According to this analysis, the Holt exponential smoothing model was selected. The parameters for the
 level (L) and trend (T) equations that were found to best predict employment are given in the equations
 below:

 The Outlook
 The above table shows the forecast for the upcoming four years, including 2022. Under the assumption
 that the Omaha economy will continue in the same trajectory as in the past, we expect that the
 information sector will continue its decline of 2% annually with a projected low of 8,900 jobs in 2025.
 The causes for this decrease can be for several reasons, such as the adoption of cloud technologies
 which allow for enterprises to run computer infrastructure remotely, allowing those services to
 preformed in another geographical region. Additionally, Omaha lacks a large enough tech workforce to
 benefit from the network effect, whereas you get larger groups of individuals in the tech sector they are
 able to learn and grow from each other and are more likely to spin off new tech companies as is seen so
 often in California. Without this network effect, there is little incentive for outside funding to support
 new businesses in this sector. While this is a dire outlook for Omaha’s workers and businesses who are
 heavily involved in the information sector, there is hope that the new data centers opening throughout
 the Metropolitan area will increase the number of tech workers in the upcoming few years. Otherwise, if
 this trend holds true then we may find ourselves with a feedback loop, where businesses look to other
 cities for information and tech workers and the local workers will have to migrate to where the jobs are
 located.

 25
APRIL 2022

 FINANCIAL ACTIVITIES
 Christina Wagner

 Historical Patterns
 The financial activities sector includes service industries related to finance, insurance, real
 estate, and rental leasing. The financial activities sector in Omaha is 70 percent larger than the
 national average and includes firms such as Blue Cross Blue Shield, PayPal, Mutual, First
 National Bank, Berkshire Hathaway, Bank of the West, Aetna, and many others.

 As shown in the graph below, overall growth has remained steady despite marginal decreases
 in employment in 2004 to 2005 and a sizeable decrease in 2009 during the Great Recession.
 Notably, from 2017 to 2019, overall employment in the sector grew by 5.2 percent. In 2020
 employment levels decreased by 1 percent, which indicates the financial activities sector fared
 relatively well throughout the pandemic. This is likely because the occupations in this sector are
 generally considered essential, and many of the jobs were easy to move to remote working.
 Furthermore, an increase in lending activity derived from historically low rates and an influx of
 requests for PPP loans increased the demand for labor within the sector. However, in 2021
 overall employment decreased by an additional 3 percent, which nearly took away all of the
 gains from 2017 to 2019. Considering labor decreased significantly in 2021 compared to 2020,
 the effects can be attributed to the national labor shortage.

 Figure: Financial Activities Employment 2000 to 2021

 t

The Forecast Model
A variety of models were tested including ES Holt, Linear Trend, Autoregressive, and Multivariate.
Each model was evaluated using root mean squared errors and mean error tests. Additionally,
an ex-ante forecast was generated for each model. The model that best fits the Financial
Activities Sector is the autoregressive model of order 1 (Ar 1).

 y = 0.101 + 0.98*y t-1
 t

 26
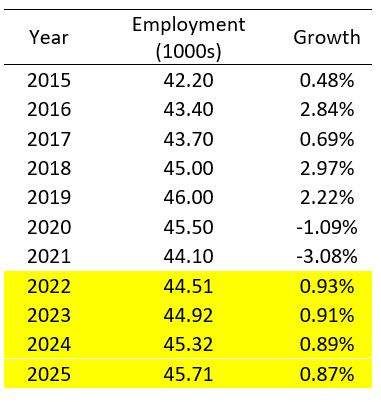
APRIL 2022

 The Outlook
 The figure and table below show the forecast through 2025. Since 2015, the growth rate in the
 sector has been relatively stable. The model predicts employment growth will continue to rise
 slowly over the next four years, never exceeding 1.0 percent. Additionally, the forecast does not
 predict a full recovery to pre-pandemic levels. Employment peaked in 2019 at 46,000 jobs,
 however by 2025 employment will be around 45,710 jobs for the sector.

 Figure: Financial Activities Employment Table: Financial Activities Outlook

The primary driver of the decrease in employment in the financial activities sector is the
absence of labor force participation. Additionally, as employees within the sector continue to
pursue remote work opportunities, the employment levels for one given geographic location
may tend to fluctuate less as the location will not determine the availability of the work
opportunity.

 27
APRIL 2022

 EDUCATION AND HEALTH SERVICES
Eric Werther

The Education and Health Services sector in Omaha covers several industries, including educational
services, health care and social services, ambulatory health care services, hospitals, and nursing and
residential care facilities.

Historical Patterns

Figure 1 shows the employment in the
 Figure 1
Education and Health Services sector in
 Source: BLS and author's calculations
the Omaha metropolitan area from 2000
through 2021. This sector is generally
driven by demographics. As the
population ages, there is increased
demand for medical services.
Additionally, increases in school-aged
populations necessitate more teachers.
The sector there is not subject to
business cycles the way others are. As a
result, it has maintained slow and stable
growth over the years. There have been
no notable spikes during this time, and
only a small decrease in 2020. On
average, between 2000 and 2021, sector
employment has grown 1.87 percent
annually.

Forecast Model

Several models were assessed to see which one seemed to produce the most reliable and credible
forecast for this sector. Root mean squared errors and mean error tests were performed on each
model, and ex-ante (out of sample) forecasts were generated and evaluated. The model selected was
an autoregressive model of order 1 (AR 1):
 y(t) = 1.52 + 0.998*y(t-1).

While some models predicted faster growth, given the challenges associated with labor force in both
education and health services, the sector is likely going to grow more slowly than historical rates
would suggest.

 28
APRIL 2022

The Outlook

Figure. Employment Table. Employmentt

The model predicts that, if Omaha’s economy continues to grow, that the Education and Health
Services sector will continue to grow by a rate of approximately 1.7 percent per year. This growth is
somewhat slower than historic trends would suggest. However, both health services and education
have experienced substantial challenges in filling vacant positions. The supply of available labor will
likely make it a bit more difficult to hire in the next few years. That said, as the economy continues
to recover from the pandemic, the sector can be expected to continue to grow and expand.

 29
APRIL 2022

 LEISURE AND HOSPITALITY
Christina Wagner

Historical Patterns

The Leisure and Hospitality sector includes a wide variety of service industries including
restaurants, lodging, recreation, event centers, theme parks, transportation and other tourism
related services. Omaha has a high level of restaurants and bars per capita and is home to
several major event centers such as Baxter Arena, CHI Health Center, and Ralston Arena.
Additionally, Omaha hosts several large events, such as the College World Series and the annual
Berkshire Hathaway Shareholders Meeting. Lastly, the Henry Doorly Zoo, which is consistently
ranked one of the best zoos in the US attracts 2 million guests each year.

As shown in the graph below, the leisure and hospitality industry is sensitive to recessions. In
2001 employment decreased by 2.67 percent, which is commensurate with the 9-11 terrorist
attacks and subsequent reduced travel. Additionally, the United States experienced a short
recession from March through November of that year. During the Great Recession, overall
employment in the sector decreased by approximately 4 percent from 2008 to 2010. However, it
only took two years for employment to fully recover, as observed by the employment levels in
2012. After the Great Recession, the Leisure and Hospitality sector increased rapidly, yielding 14%
growth from 2012 to 2019. However, in 2019 the gains were lost and employment returned to
2008 levels, observed as a decrease in employment by 16.73 percent. Fortunately, in 2021 the
sector reclaimed some of the lost gains as employment increased by 9.55 percent. This indicates
the sector is recovering from the COVID-19 pandemic. While the sector is far from pre-pandemic
levels, it is trending upward at a rapid pace.

Figure: Leisure and Hospitality Employment 2000 to 2021

 30
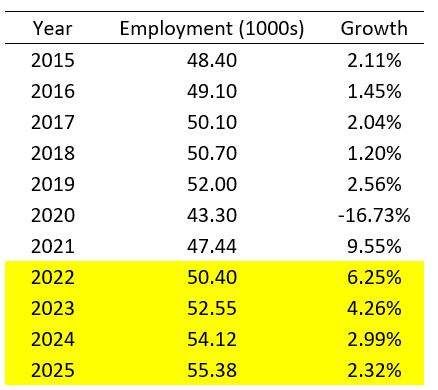
The Forecast Model
A variety of models were tested including ES Holt, Linear Trend, Autoregressive, and Multivariate.
Each model was evaluated using root mean squared errors and mean error tests. Additionally,
an ex-ante forecast was generated for each model. The model that best fits the Leisure and
Hospitality Sector is the Multivariate model.

 y = 6.84 + 1.005*y - 0.03*Trend + 0.0009*GDP
 t t-1 national

The Outlook
 In January and February 2022, Eppley Airfield reported an increase in the number of enplaned
 and deplaned passengers compared to the same months in 2021. January data noted an
 increase of 85.4 percent for enplaned passengers and 76.4 percent for deplaned passengers.
 Similarly, in February the number of enplaned passengers increased by 83.6 percent and
 deplaned passengers increased by 89.3 percent. Overall, there is a year-to-date net gain of 83.6
 percent. These numbers support the high level of predicted growth for 2022.

 Given anticipated growth in the Omaha economy, the sector will still observe growth as there
 are two new venues being constructed in metro: Steel House in downtown Omaha and Astro
 Theatre in LaVista. Steel House is scheduled to open mid-2023 and Astro Theater is scheduled
 to open January 2023. The venues will compare in size to Ralston Arena, which can seat 4,200
 patrons. Specifically, Steel House will be able to hold 1,500 to 3,000 guests and Astro Theatre
 will have a maximum capacity of 2,500 people indoors and 5,000 outdoors.

 The figure and table above show the forecast through 2025. In 2021, the leisure and hospitality
 sector began to recover from the losses during the pandemic, as COVID-19 restrictions
 decreased and major events such as the College World Series and the annual Berkshire
 Hathaway Shareholders meeting returned to Omaha. Employment will continue to increase at a
 rapid pace for the next two years and will recover to pre-pandemic levels by the end of 2023.
 Employment will continue to grow steadily after recovery, reaching just over 55,000 jobs in
 2025.

 Figure: Leisure and Hospitality Employment Table: Leisure and Hospitality Outlook

 31
APRIL 2022

 PROFESSIONAL SERVICES
Bryant Robertson
 30
 30
Historical Patterns
The Professional Services sector contains mostly jobs that would be considered “white collar” in
nature. This sector consists of lawyers, doctors, financial advisors, engineers, teachers, and
architects. When looking at the below figures, we can see that these professions tend to be
susceptible to fluctuations in the economy. This sector took large hits in the 2002 “dot com”
recession and again in the Great Recession of 2009, with employment growth rates of -3.44
percent and -4.27 percent respectively. These are the two largest drops in employment for
professional services over the last 20 years including the recession caused by COVID in 2020.

After 2009 the sector saw solid growth up until 2016 when there was a decrease in total
employment that picked up again in 2019. In 2020 we see another large decrease in total
employment of about 3 percent due to the closing of the economy for COVID-19. The
professional services sector seemed to be hit harder during the great recession, which can
probably be attributed to the fact that most of these jobs can be moved to work from home,
while sectors that were hit harder during COVID-19 were not. Growth for this sector picked up
once again during 2021 hitting 1.44 percent.

The Forecast Model
Figure : Total Employment Forecast Multiple models were tested to determine
Source: Authors’ Calculations which one could produce the most realistic
 and reasonable projections for the next five
 years for the “Professional Services” sector.
 After testing all models used using root
 mean squared errors and mean error tests,
 an ex-ante forecast was generated for each
 model and evaluated to determine which
 model would produce the most accurate
 projection. An autoregressive model with a
 lag of 1 (AR 1) was determined to be the
 most accurate and reasonable model and is
 what was used to produce the numbers
 below along with the equation produced by
 the model to create our projections.

 Projection Equation: y(t) = 3.44 + 0.961y(t-1)

 32
APRIL 2022

The Outlook
When looking at the above figures we can see how the model projects the years 2022, 2023,
2024, and 2025. The model predicts that the Professional Services sector in Omaha will see
steady growth through all four years. This growth will hover just below 1.00 percent, declining as
the years continue. With these growth rates, Omaha should see the sector reach pre-pandemic
levels by 2023 and continue to grow afterwards. We may even see a sharper increase in growth
once these years are realized as with previous recessions, negative growth rates were met with
relatively sharp increases in growth in the year or two following them.

Figure : Employment Growth Rates by Year
Source: Authors’ calculations

 33
APRIL 2022

 OTHER SERVICES
Class

Historical Patterns
The “Other Services” sector in Omaha comprises firms in a diverse set of industries which
include: Automotive repair and maintenance, computer repair, household repair and
maintenance, barber shops/salons, dry cleaning, pet care, and other personal care services as
well as business associations and labor union personnel. As shown in the graph below, the
sectors are generally insulated from major swings in the business cycle. Indeed, employment in
this sector grew 2.35 percent in 2009 and another 2.30 percent in 2010, arguably the most
difficult years of the so-called “great recession”.

Since 2010, employment in the sector has averaged 0.67 percent, which indicates a relatively
slow-growing sector. As was the case with most service industries across the nation, this sector
took a major hit from the COVID-19 shutdown in 2020, dropping nearly 5 percent from its 2019
peak of 18.60.Jobs in the sector bounced back in 2021 as it grew by 3.29 percent. Still,
employment in 2021 reached 18,280, still substantially below from its peak of 18,600 in 2019.
There is still room to grow depending on how the economy will fare.

Forecast Model

Several models were tested to see which one seemed to produce the most reliable and credible
forecast for the “Other Sectors”. Root mean squared errors and mean error tests were performed
on each model, and ex-ante (out of sample) forecasts were generated and evaluated. According
to this analysis, an autoregressive model of order 1 was selected which implies that other
services employment depends on last year’s other services employment value. In the equation as
shown below, yt is the employment level in “other services”:

 y(t) = 0.274 + 0.995*y(t-1).

The Outlook
The above figure table show the forecast. Under the assumption that the Omaha economy will
continue to grow steadily, we expect that other services employment will grow just under 1.0
percent per year for the next four years, reaching nearly 19,000 jobs by 2025. While this growth
rate is sharper than the previous decades which may be difficult to maintain if labor force
growth continues to perform poorly, nevertheless, there is still room to grow before reaching
pre-COVID job levels. Moreover, with supply chain challenges and the potential for higher
inflation, demand for repair and maintenance services will likely remain strong. Overall, these
growth rates imply that this sector will finally recover to its pre-COVID employment levels by
2023 and grow steadily thereafter.

 34
APRIL 2022

Figure: Other Services Table: Employment Outlook

 35
APRIL 2022

 GOVERNMENT
Tyler Billings

 In the Omaha metropolitan area, the government sector is the third largest industry by workforce in
 2021. The government sector is comprised of all three levels of government: Federal, State, and Local.
 As shown in the graph below we see that the government sector has been steadily growing over the
 years with a large increase during the first decade of the millennium. This is likely driven by an
 increase in military spending during the initial years of the Iraq and Afghanistan wars causing an
 increase in employment at Offutt Airforce Base, home of U.S. Strategic Command (STRATCOM).

 Historical Patterns
 For the decade starting in 2010, the sector
 experienced a slower, but more steady growth with
 an average of .39% annually. As was the case with
 most sectors, there was a sharp drop in employment
 in 2020 due to COVID-19 restrictions, dropping 2.54
 percent from its peak in 2019 and continued with
 another small drop of .14 percent in 2021.
 While we did see a drop in the government sector it
 is not likely due to a decrease in labor demand since
 government positions are less reliant on the business
 cycle and are instead dictated by federal and state
 funding, instead it was likely due to individuals
 leaving the workforce to care for children or taking
 an early retirement due to health concerns. It is likely
 that we will return to previous government
 employment levels, although not quickly as the
 hiring process can be longer than the private sector
 due to federal and state hiring processes and
 requirements.

 The Forecast Model
 Four different models were tested to determine
 which one possessed the greatest predictive ability
 for the Government sector. The primary tests for the
 models’ accuracy were the root mean squared errors
 and the mean error to evaluate ex-ante (out-for-
 sample) forecasts. Additionally, the forecasts for the
 next four years were evaluated against the overall
 Omaha and U.S. economic recovery. According to this
 analysis, an “autoregressive” model of order 1 (AR 1)
 was selected, implying that future employment in
 this sector is dependent on the previous year’s
 employment. Below is the forecasting model, where
 is the prediction and is the previous year’s
 employment level.

 36
APRIL 2022

The Outlook

 The above table shows the forecast for the upcoming four years, starting in 2022. Under the
 assumption that the Omaha economy will continue in the same trajectory as in the past, we expect
 that the government sector will continue its slow growth of between 0.6 and 0.7 percent annually,
 surpassing the previous peak of 66,900 in 2019. While this growth seems mild it is likely to maintain this
 steady growth thanks to the presence of STRATCOM, in fact there is strong potential for accelerated
 growth as seen in the early 2000s due to recent geopolitical instability which may cause an increase in
 funding to STRATCOM and Offutt Air Force Base.

 37
You can also read