Econometric analysis of the New Zealand Retail Grocery Sector
←
→
Page content transcription
If your browser does not render page correctly, please read the page content below
Econometric analysis of the New Zealand Retail
Grocery Sector
Report for the Commerce Commission | 15 July 2021
Econometric analysis of the New Zealand Retail Grocery Sector 2
 Final

Frontier Economics Pty Ltd is a member of the Frontier Economics network, and is
headquartered in Australia with a subsidiary company, Frontier Economics Pte Ltd in Singapore.
Our fellow network member, Frontier Economics Ltd, is headquartered in the United Kingdom.
The companies are independently owned, and legal commitments entered into by any one
company do not impose any obligations on other companies in the network. All views expressed
in this document are the views of Frontier Economics Pty Ltd.

Disclaimer

None of Frontier Economics Pty Ltd (including the directors and employees) make any
representation or warranty as to the accuracy or completeness of this report. Nor shall they have
any liability (whether arising from negligence or otherwise) for any representations (express or
implied) or information contained in, or for any omissions from, the report or any written or oral
communications transmitted in the course of the project.

Frontier Economics 2
Econometric analysis of the New Zealand Retail Grocery Sector 3
 Final

Contents
1 Executive Summary 6

2 Introduction 8

3 Relation between concentration and prices/margins 9
3.1 The raw data 9
3.2 Characteristics of stores in the analysis 11
3.3 Price data used in analysis 14
3.4 Price differences across regions 18
3.5 The key variables: markets, concentration and prices 20
3.6 The control variables 25
3.7 Approach to regression analysis 26
3.8 Regression results 27
3.9 Conclusions 32

4 Relation between entry/exit and prices 34
4.1 The data used in the entry/exit study 34
4.2 Approach to regression analysis 36
4.3 Regression results 37
4.4 Conclusions 38

A Cross section regression results 39

B Time series events and results 57
Tables
Table 1: Number of stores in analysis by banner and island 12

Table 2: Number of stores in analysis by banner and type of area 12

Table 3: Average revenue per store in analysis in 2019 ($‘000) 13

Table 4: Total revenue by banner in analysis ($ mill) 13

Table 5: Revenue share by banner in analysis 14

Table 6: Number of products sold by store: All products except alcohol and tobacco 16

Frontier Economics 3
Econometric analysis of the New Zealand Retail Grocery Sector 4
 Final

Table 7: Average price differences between each banner and [ ] 18
Table 8: Average price difference between banner in South Island and same banner in North Island
 18

Table 9: Regional price differences relative to Auckland 20
Table 10: Selected radius (minutes' drive time) for competition – Weighted share approach 28

Table 11: Selected radius (minutes' drive time) for characteristics – Weighted share approach 29

Table 12: Impact of market share of the major on prices of stores of banners within that major
group 30

Table 13: Selected radius (minutes' drive time) for competitor Proximity approach 31

Table 14: Selected radius (minutes' drive time) for characteristics – competitor Proximity approach
 31

Table 15: Impact of Proximity – full sample 32

Table 16: [ ] cross section results (full sample) 40

Table 17: [ ] cross section results (full sample) 41

Table 18: [ ] cross section results (full sample) 42

Table 19: [ ] cross section results (full sample) 43

Table 20: [ ] cross section results (full sample) 44

Table 21: [ ] cross section results (full sample) 45

Table 22: [ ] cross section results (urban sample) 46

Table 23: [ ] cross section results (urban sample) 47

Table 24: [ ] cross section results (urban sample) 48

Table 25: [ ] cross section results (urban sample) 49

Table 26: [ ] cross section results (urban sample) 50

Table 27: [ ] cross section results (urban sample) 51

Table 28: [ ] cross section results (rural sample) 52

Table 29: [ ] cross section results (rural sample) 53

Table 30: [ ] cross section results (rural sample) 54

Table 31: [ ] cross section results (rural sample) 55

Table 32: [ ] cross section results (rural sample) 56

Table 33: Events studied 57

Table 34: Time series regression results 59

Figures
Figure 1: Drive times to New World Pioneer 22

Figure 2: Distribution of price indices across stores for each banner 25

Frontier Economics 4
Econometric analysis of the New Zealand Retail Grocery Sector 5
 Final

Figure 3: [ ] 60
Figure 4: [ ] 61

Figure 5: [ ] 61

Frontier Economics 5
Econometric analysis of the New Zealand Retail Grocery Sector Final

1 Executive Summary
As part of its market study in the grocery sector of New Zealand, the Commerce Commission
commissioned Frontier Economics to undertake some econometric analysis to examine how the
structure of local grocery markets affects prices and margins in New Zealand. This report is the
result of that analysis.

Economic theory suggests that the structure of a market is likely to influence the prices and
margins in a market. Key elements of market structure are:

 • the number and size distribution of independent sellers, especially the degree of market
 concentration;

 • the height of barriers to entry, that is the ease with which new firms may enter and
 secure a viable market;

 • the extent to which the products of the industry are characterised by extreme product
 differentiation and sales promotion;

 • the character of “vertical relationships” with customers and with suppliers and the extent
 of vertical integration; and

 • the nature of any formal, stable and fundamental arrangements between firms which
 restrict their ability to function as independent entities.1

Economic theory yields a large range of propositions concerning the relation between elements
of market structure and prices/margins. However, our analysis consisted of two studies, each of
which focused on a particular issue.

The first study tested whether there is a relationship between concentration and prices in local
grocery markets. We conducted the test by comparing the way in which variations in
concentration across local grocery markets are related to variations in prices. We controlled for
various other factors that may influence variations in prices across markets.

We were provided with weekly store-level stock-keeping unit (SKU) data for 694 stores of the
major grocery retailers: Foodstuffs North Island, Foodstuffs South Island, and Woolworths NZ.
The stores were those from the following banner groups of Foodstuffs: New World, PAK’nSAVE
and Four Square; and it covered the following banner groups of Woolworths NZ: Countdown,
FreshChoice and SuperValue.

We define a separate market around each of the 694 stores in our sample and we use two
different methods to measure market concentration. The first measure is the share of revenue of
the group to which the focal store belongs, when these shares were weighted to account for the
distance of competitor stores to the focal store. The second measure is the proximity of the
closest store of each of the six banner groups in the study.

1
 Decision of the Australian Trade Practices Tribunal (1976) ATPR 40-012 at 17,246. These words were adopted by
 New Zealand courts from the earliest cases under the Commerce Act. See, for example, Auckland Regional
 Authority v Mutual Rental Cars Ltd & Ors (1988) 2 NZBLC at 103,061.

Frontier Economics 6
Econometric analysis of the New Zealand Retail Grocery Sector Final

We conduct separate tests for each of the banner groups. The results of the tests vary somewhat
depending on the measure of market concentration. In models with weighted revenue share as
the concentration variable, we find that increased concentration in local markets tends to be
associated with higher prices in the cases of Four Square, New World and SuperValue. In models
with Proximity to major banners as the concentration measure, we find that Four Square stores
tend to have lower prices when a FreshChoice or SuperValue store is nearby; and Countdown,
FreshChoice and SuperValue stores tend to have lower prices when a New World store is nearby.
Relationships between stores of other banners are less clear. We find that Proximity to stores of
non-competitor banners in the same group tends to increase prices for certain pairs of stores but
not for others. In particular, prices at Four Square stores tend to be higher if a PAK’nSAVE store is
nearby; and prices at SuperValue stores tend to be higher when a Countdown or FreshChoice
store is nearby.

The second study analysed the impact of the entry, exit or rebranded entry on the prices charged
by close competitor stores in the 12 months following the event. We used a sample of 32 events
of entry, exit or rebranding. These events had a good geographic spread with different
demographic characteristics, such as population density. We found that most of these events had
no economically-significant impact – where an economically-significant impact was defined as at
least 0.5% price change (increase or decrease). Of the 9 cases with an economically-significant
impact, two were positive (such as entry associated with a price increase) and seven were
negative. The absolute magnitude of the impact of every event on the prices of the close
competitor stores was less than 2.25%. We find that there is no systematic relationship between
the entry or exit of a store and the prices charged by close competitor stores in the 12 months
after entry.

Frontier Economics 7
Econometric analysis of the New Zealand Retail Grocery Sector Final

2 Introduction

On 17 November 2020, the Commerce Commission commenced a market study into the factors
that may affect competition for the supply or acquisition of groceries by retailers in New Zealand.
The study accords with Terms of Reference included in the Gazette Notice published by the
Minister, Hon Dr David Clark, Minister of Commerce and Consumer Affairs, pursuant to section
51(1) of the Commerce Act (1986).

As part of its market study, the Commerce Commission entered into a contract with Frontier
Economics in February 2021 to undertake an econometric analysis to examine how the structure
of local grocery markets affects prices and margins. This econometric analysis was designed to
feed into the Commission’s conclusions on the factors affecting competition in the supply or
acquisition of grocery products by retailers in New Zealand.

Frontier Economics began work on this project on 15 February 2021. The work was assisted by an
advisory group nominated by the Commerce Commission. Although we are grateful for the
advice we received, Frontier Economics takes full responsibility for the design and results of our
analysis.

The analysis attempts to answer two questions that arise when considering competition in local
grocery markets:

 1. What is the relationship between market concentration in local grocery markets and the
 prices or margins earnt by retail outlets that supply those markets?

 2. What is the impact on prices in local grocery markets of the entry and exit of new and
 rebranded supermarkets owned or serviced by Foodstuffs and Woolworths NZ?

This report presents the outcomes of our study in response to these two questions. Section 3
presents our study of the relationship between market concentration and prices/margins.
Section 4 presents our study of the relationship between entry/exit and prices.

Frontier Economics 8
Econometric analysis of the New Zealand Retail Grocery Sector Final

3 Relation between concentration
and prices/margins
The first study requested by the Commerce Commission was an econometric analysis to test
whether there is a relationship between concentration and price and/or margins in local grocery
markets.2 We responded to this request by proposing to compare the way in which variations in
concentration across local grocery markets is related to variations in prices. We refer to this
analysis as cross-section analysis because we examine variation across markets during a
particular period.

Although the first study focuses on the relationship between concentration and prices in local
grocery markets, grocery retailers compete in a range of ways. One of these is the location of the
store. However, there are many others, such as:

 • the size of the store

 • the availability of carparking

 • the products stocked in the store

 • the quality of service provided within the store.

Customers come to recognise that the banner group to which a store belongs is an indication of
many of these characteristics.

In order to test for a possible relationship between concentration and prices, we have to make
sure, as far as possible, that variation in prices is not attributed to concentration when it is
caused by other factors. For this reason, we needed to control as far as possible for variations in
prices that might be attributed to variations in these other aspects of competition.

3.1 The raw data

We chose the 12 months of 2019 as the period for our analysis. The 12-month period enabled us
to abstract from the effects of seasonality and weekly specials.3 The average price of each stock-
keeping unit (SKU) in each store over the year was calculated by dividing the revenue the store
received from the sale of the SKU by the number of units of that SKU that were sold.

In order to undertake the analysis, we required this data from each grocery store in each local
market in New Zealand. We were provided with data from stores of the major grocery retailers:
Foodstuffs North Island (FSNI), Foodstuffs South Island (FSSI) and Woolworths NZ (WW). The data
covered the following banner groups of Foodstuffs: New World, PAK’nSAVE and Four Square; and
it covered the following banner groups of Woolworth NZ: Countdown, FreshChoice and
SuperValue. We refer to the stores from these banner groups as Supermarkets.

2
 Commerce Commission, Request for Proposals, p 7.
3
 Using data from 2019 enabled us to avoid any distortions in relationships that may have been caused by the
 COVID-19 pandemic.

Frontier Economics 9
Econometric analysis of the New Zealand Retail Grocery Sector Final

The Commerce Commission provided us with the following data for each Supermarket in our six
banner groups:

 • the address and brand of each Supermarket;

 • the revenue, number of units sold and cost of goods sold for each stock-keeping unit
 (SKU) sold by each Supermarket for 2019;

 • the characteristics of each SKU, such as the barcode, article description, units of
 measurement, internal article numbers, internal department, and, for some
 Supermarkets, further descriptions, including product category and subcategory

 • store financial accounts; and

 • various store characteristics for each Supermarket, such as store size, opening hours,
 date of store opening, date of most-recent renovation, number of checkouts (self-service
 and assisted).

The Commerce Commission also provided us with a non-exhaustive list of grocery retailers other
than the Supermarkets, together with addresses. We use this information to see whether the
presence of these retailers in local markets affected the prices charged by the Supermarkets.

As we observed above, the Commerce Commission had requested an econometric analysis to
test whether there is a relationship between concentration and price and/or margins in local
grocery markets. Although the Commerce Commission provided us with store-level data of
financial accounts and cost of goods sold (COGS), we decided to confine our analysis to test
whether there is a relationship between concentration and price. We avoided the use of the
financial accounts data because the economics literature casts doubt on the utility of financial
accounts data for assessing economic profits. 4 We avoided the use of the COGS data because it
recorded the cost to individual stores, where these costs appeared to include the cost of
transport and corporate overheads. Because the allocation of these costs may have differed
between the majors, between banners within a major or between stores within a banner, we
decided to confine our analysis to differences in prices.

We chose to use the barcode as the unique product identifier, for each Supermarket banner. For
some banners this required adjustments of quantities so that the units of measurement were on
a consistent basis. This was accomplished using both units of measurement conversion tables
supplied by the banners, but also by comparisons of prices for the same product.

We wanted to ensure that the prices we were comparing were prices for products with the same
physical characteristics. For this reason, we excluded from our analysis the prices of:

 • fresh fruit that was not packaged and identified with a brand name;

 • fresh vegetables that were not packaged and identified with a brand name; and

 • fresh meat that was not packaged and identified with a brand name.

We did this by exporting the article descriptions of all products in the butchery and produce
departments, and manually examining the names. If a name indicated that the product was
clearly a branded item, we retained the product, otherwise the product was excluded.

4
 A seminal paper is Franklin M Fisher and John J McGowan, “On the Misuse of Accounting Rates of Return to infer
 Monopoly Profits,” American Economic Review, Vol 73 (1983) pp 82-97.

Frontier Economics 10
Econometric analysis of the New Zealand Retail Grocery Sector Final

We retained products with a 13-digit barcode; products with a barcode containing fewer than 13-
digits were often internally assigned by individual Supermarkets and so were less likely to be
comparable across Supermarkets.

For SuperValue/FreshChoice, we observed that, for the non-hosted data5, barcodes were often
associated with multiple article descriptions. Examination revealed that in many circumstances
the article descriptions were substantially different. Because the number of barcodes/articles
was large (150,000) manual checks were infeasible, and we instead retained the article that had
the highest revenue for each barcode.

We eliminated the products that were associated with recharge cards, gift cards, payphone cards,
donations/promotions and Christmas club cards. Further, we omitted products labelled as
department key (i.e. manually entered products). We also omitted products in the
florist/gardening department as the descriptions indicate that these may not be comparable
across stores. Finally, we omitted prescription pharmaceuticals and HealthPac payments.

We retained the department for each product so that Alcohol and Tobacco products could be
identified and removed at later stages of the analysis. We wished to focus our analysis on core
grocery products (not including prescription pharmaceuticals, alcohol and tobacco). This is
because we considered that if we were to test whether there is a relationship between
concentration and price in local grocery markets, we were more likely to discover such a
relationship in core grocery products than if a possible relationship in those products was
obscured by including prescription pharmaceuticals, alcohol and tobacco, where competition
with specialised retailers could potentially be more direct.

3.2 Characteristics of stores in the analysis

The cross-section study tested whether the prices charged by the Supermarkets in 2019 were
related to concentration in their respective local markets. We analysed the prices of 694
Supermarkets.

This section of the report presents data summarising the activities of the stores in our sample. As
observed above, we did not include certain products in our analysis. The data in this section
omits the products that we excluded, but it includes alcohol and tobacco.

Table 1 shows how the stores in our sample are distributed by banner and by Island. Table 2
shows how the stores are distributed by type of area according to Stats NZ. Four Square stores
are the most numerous, followed by Countdown and then New World.

We use the following abbreviations for the banners:

 • Countdown – CD

 • FreshChoice – FC

 • New World – NW

5 We understand that, because Woolworths NZ do not own any of the SuperValue or FreshChoice businesses,
Woolworths NZ only store SKU level data centrally (host-supported data) for approximately [ ] of the products sold at
SuperValue and FreshChoice. The other [ ] of the SKU level data for these stores is stored only by individual franchise
owners (non-host supported data). Non-host supported SKUs do not have unique article numbers.

Frontier Economics 11
Econometric analysis of the New Zealand Retail Grocery Sector Final

 • PAK’nSAVE – PnS

 • SuperValue – SV

 • Four Square – 4SQ

As can be seen in Table 1, the data has a good variety of banners and locations.

Table 1: Number of stores in analysis by banner and island

 Banner North Island South Island Total

 4SQ 175 64 239

 CD 144 38 182

 FC 13 18 31

 NW 101 43 144

 PnS 45 12 57

 SV 25 16 41

 Total 503 191 694

Source: Frontier Economics analysis of data provided by the Commerce Commission

Table 2: Number of stores in analysis by banner and type of area

 Large Major Medium Small Rural Rural
 Banner Total
 urban urban urban urban settlement other

 4SQ 46 35 17 77 58 6 239

 CD 32 97 25 28 0 0 182

 FC 2 13 4 12 0 0 31

 NW 23 56 20 45 0 0 144

 PnS 13 29 11 3 0 1 57

 SV 5 15 2 15 3 1 41

 Total 121 245 79 180 61 8 694

Source: Frontier Economics analysis of data provided by the Commerce Commission

Frontier Economics 12
Econometric analysis of the New Zealand Retail Grocery Sector Final

Table 3 shows the average revenue per store by banner. It indicates that the average Four
Square store is [ ], followed by SuperValue and FreshChoice. However, while
Four Square stores have [ ], and Table 4 and Table 5 indicate that,
[ ]. Table 5 shows that Four Square stores account for [ ]
of turnover of tobacco products, but only [ ] of revenue over all products. Tobacco products
account for almost [ ] of the revenue of Four Square stores, compared with [ ] for the group as
a whole.

Table 3: Average revenue per store in analysis in 2019 ($‘000)

 All products
 Alcohol Tobacco
 Banner except alcohol All products
 products products
 and tobacco

 4SQ [

 CD

 FC

 NW

 PnS

 SV ]

Source: Frontier Economics analysis of data provided by the Commerce Commission

Table 4: Total revenue by banner in analysis ($ mill)

 All products
 Alcohol Tobacco
 Banner except alcohol All products
 products products
 and tobacco

 4SQ [

 CD

 FC

 NW

 PnS

 SV ]

Source: Frontier Economics analysis of data provided by the Commerce Commission

Frontier Economics 13
Econometric analysis of the New Zealand Retail Grocery Sector Final

Table 5: Revenue share by banner in analysis

 All products
 Alcohol Tobacco
 Banner except alcohol All products
 products products
 and tobacco

 4SQ [

 CD

 FC

 NW

 PnS

 SV ]

Source: Frontier Economics analysis of data provided by the Commerce Commission

3.3 Price data used in analysis

As is common with large datasets of this kind, the prices calculated from the data we received
from the Commerce Commission required cleaning to eliminate prices that were clearly wrong.
Examples of wrong prices were those that were negative or very small. For example:

• There were 2 negative prices, 89 cases of prices less than 1 cent, and 352 prices less than 5
 cents.

• The product with EAN_barcode = [ ] was sold in 28 stores with the average price in
 2019 ranging from 1 cent to $9.995. While most stores had average prices above [ ], five
 stores had average prices of [ ] or less.

• The product “[ ]” with EAN_barcode = [ ], had total revenue for one store in
 2019 of 3 cents with the quantity sold = 3.22. The cost of goods sold was $8.39.

With over 8 million observations, it was not practical to examine all possible anomalies in the
revenues and quantities. Instead, we treated a percentage of the most extreme observations as
outliers and deleted them from the analysis.6

We implemented this approach as follows. For each product we calculated the median price for
the product across the stores in each banner. We used the median price rather than mean price
because of its reduced sensitivity to outliers. This provided us with a separate median price for
the product for each banner.

Next, we calculated, for each product, and each store selling the product, the ratio of the price for
that product to the median price of the product for the relevant banner. We then classified as

6
 This is a common approach to dealing with outliers in large datasets.

Frontier Economics 14
Econometric analysis of the New Zealand Retail Grocery Sector Final

outliers the 2% of prices that were furthest from their respective medians across all products and
banners. This resulted in our treating as an outlier any price that was more than 26.0% away
from its relevant median.

After cleaning the data, we were left with a large and rich dataset. There were 8,852,722
observations on revenues and quantities for store/product combinations. Of those, 662,579
observations were for alcohol or tobacco products. We are satisfied that we had a large, reliable
dataset for our econometric analysis.

Table 6 summarises the distribution of stores and products that were used in the cross-section
analysis. It shows, for each banner:

 • the number of stores (# Stores)

 • the mean number of products per store (Nproducts), together with the standard
 deviation, minimum number of products per store and maximum number of
 products per store

 • the mean number of products per store that were sold in only one store (Nproducts
 store only), together with standard deviation, minimum and maximum number of
 these products per store

 • the mean number of products per store that were sold only in the banner
 (Nproducts banner only), together with the standard deviation, minimum and
 maximum number of these products per store

 • the mean number of products per store that were sold only in the group
 (Foodstuffs or Woolworths NZ) to which the banner belonged (Nproducts group
 only), together with the standard deviation, minimum and maximum number of
 these products per store.

Frontier Economics 15
Econometric analysis of the New Zealand Retail Grocery Sector Final

Table 6: Number of products sold by store: All products except alcohol and tobacco

 4SQ # Products

 Variable # Stores Mean Std. Dev Min Max

 Nproducts 239 [

 Nproducts_store_only

 Nproducts_banner_only

 Nproducts_group_only ]

 CD # Products

 Variable # Stores Mean Std. Dev Min Max

 Nproducts 182 [

 Nproducts_store_only

 Nproducts_banner_only

 Nproducts_group_only ]

 FC # Products

 Variable # Stores Mean Std. Dev Min Max

 Nproducts 31 [

 Nproducts_store_only

 Nproducts_banner_only

 Nproducts_group_only ]

 NW # Products

 Variable # Stores Mean Std. Dev Min Max

 Nproducts 144 [

 Nproducts_store_only

 Nproducts_banner_only

 Nproducts_group_only ]

Frontier Economics 16
Econometric analysis of the New Zealand Retail Grocery Sector Final

 PnS # Products

 Variable # Stores Mean Std. Dev Min Max

 Nproducts 57 [

 Nproducts_store_only

 Nproducts_banner_only

 Nproducts_group_only ]

 SV # Products

 Variable # Stores Mean Std. Dev Min Max

 Nproducts 41 [

 Nproducts_store_only

 Nproducts_banner_only

 Nproducts_group_only ]
Source: Frontier Economics analysis of data provided by the Commerce Commission

The cross-section study tests whether there is a relationship between concentration and prices in
local grocery markets. It does this by testing whether differences in prices across stores are
related to differences in concentration in the local markets in which those stores are located. This
test will only make sense if there are material differences in prices across stores when these
differences cannot be explained simply by differences in obvious characteristics such as the
banner of the store. That is, the study would only make sense if there are material differences in
prices between banners and within banners that might be explained by differences in
concentration.

 Table 7 reports average differences in prices between the banners. Table 7 shows the average
price difference between each banner and the most-expensive banner, [ ]. It appears that
[ ] stores are substantially [ ] than other banners for all product categories, other
than tobacco. There are also substantial differences in average prices between some of the other
banners, with PAK’nSAVE materially the [ ] in all categories, other than tobacco. Indeed, for
tobacco products there are only very small price differences between the banners.

Frontier Economics 17
Econometric analysis of the New Zealand Retail Grocery Sector Final

Table 7: Average price differences between each banner and Four Square

 All products except
 Banner Alcohol products Tobacco products
 alcohol and tobacco

 [

 ]

Source: Frontier Economics analysis of data provided by the Commerce Commission

Table 8 provides estimates of the average price differences, within each banner, between stores
in the North Island and the South Island. We expected to find substantial differences in prices
between the North Island and the South Island because of differences in transport costs.
However, the table shows that for all banners except [ ], there are only small differences in
average prices between the North and South Islands. The table indicates that the prices in our
analysis for [ ] stores are, on average, [ ] in the South Island than in the North Island.

Table 8: Average price difference between banner in South Island and same banner in North Island

 All products except
 Banner Alcohol products Tobacco products
 alcohol and tobacco

 [

 ]

Source: Frontier Economics analysis of data provided by the Commerce Commission

3.4 Price differences across regions

After we had undertaken our core econometric work, the Commerce Commission’s advisory group
asked whether we would look more closely at differences in prices across regions (using Stats NZ

Frontier Economics 18
Econometric analysis of the New Zealand Retail Grocery Sector Final

regional council definitions). Table 9 presents the results of two different methods for considering
these inter-regional differences in prices.

The first method reflects inter-regional variation within banners. This is based on the banner-
specific price indices that we developed as part of our core econometric work. As we explain in
section 3.4.3 below, as part of that work we developed price indices for each banner group and
estimated a price index number for each store within the banner. In order to respond to the
request from the advisory group, we took the price indices developed for these regressions to find
price indices for each region. We obtained the regional indices from a regression containing all 694
Supermarkets as the sample with the price indices as the dependent variable, and dummy
variables for the banners and regions as explanatory variables. The first method provides
estimates of the average differences in prices across regions within banners.

The second method shows inter-regional variation in prices based on a national price index.
Although the first method shows inter-regional variation in prices within banners, it may be that
there are material differences in average prices across regions resulting from the concentration of
particular banners in certain regions. For example, Table 7 indicates that [ ] stores tend to be
the [ ] stores for products other than tobacco; and Table 2 indicates that rural areas tend
[ ]. This suggests that rural areas will tend to have more expensive groceries
than non-rural areas. This is picked up in our second method.

For the second method, we first obtained store price indices by comparing all stores to a base
store. We then calculated the store-revenue weighted average of the price indices of the stores in
each region. The weighting ensures that the results also reflect how much money people spend in
each store/banner in the region. It estimates the combined effect of different prices across regions
within banners, and the different availability of banners in each region.

The results of both methods are presented in Table 9 below. The differences in the results between
the two methods reflect differences in the availability of banners in different regions. The reason
the West Coast is most expensive is likely due to the fact that the region contains mostly [ ]
stores and no [ ] stores. The results from each method are presented in comparison with
prices in Auckland.

Frontier Economics 19
Econometric analysis of the New Zealand Retail Grocery Sector Final

Table 9: Regional price differences relative to Auckland

 Method 1 -banner-specific Method 2 -national
 Region
 indices index

 Auckland Region 0.0% 0.0%

 Bay of Plenty Region -0.6% 0.5%

 Canterbury Region -0.7% 1.7%

 Gisborne Region -1.1% 1.2%

 Hawke's Bay Region 1.5% 1.4%

 Manawatu-Whanganui Region 1.3% 2.1%

 Marlborough Region -0.5% 1.9%

 Nelson Region -0.7% 2.8%

 Northland Region -0.6% 3.0%

 Otago Region -1.3% 3.3%

 Southland Region -1.5% 3.1%

 Taranaki Region 1.3% 2.2%

 Tasman Region -1.6% 1.9%

 Waikato Region -0.4% 1.7%

 Wellington Region 1.1% 1.4%

 West Coast Region -1.9% 4.8%

Source: Data provided by the Commerce Commission

3.5 The key variables: markets, concentration and prices

Our econometric analysis proceeds by testing whether differences in prices across the 694 stores
for which we obtained pricing data are related to differences in concentration in the local
markets in which those stores are located. To undertake these tests, we have to define markets
and adopt or develop measures of concentration in those markets. We also have to develop
measures of the extent to which prices differ across the 694 stores for which we obtained pricing
data.

Frontier Economics 20
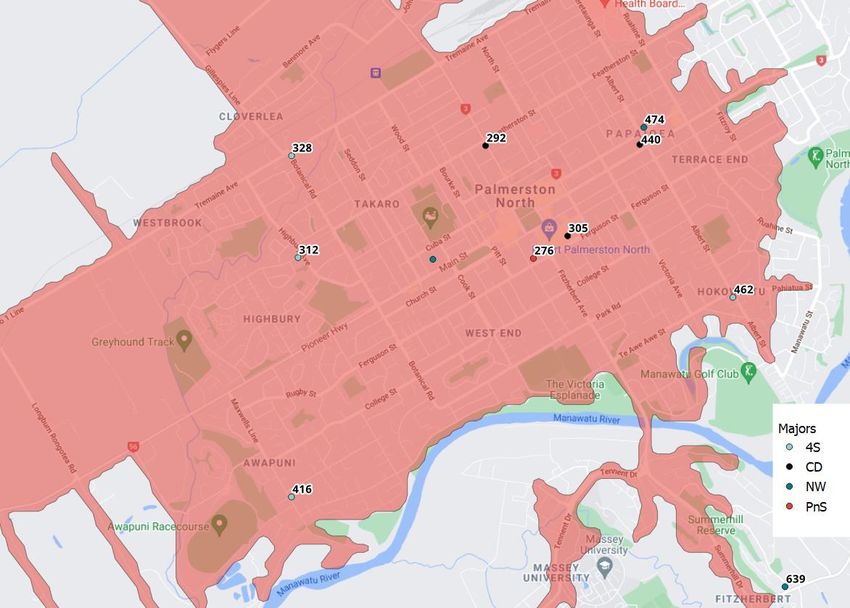
Econometric analysis of the New Zealand Retail Grocery Sector Final

When we test the relationship between concentration and prices, we have to be careful to control
for other possible influences on prices. In this section of the report, we outline the various
measures we use for the key variables. In the following section, we outline the various measures
we use for control variables.

3.5.1 Our approach to defining markets

We define a separate market around each of the 694 stores in our sample. We refer to the store
around which a market is defined as the focal store for that market. The market for such a focal
store will include all those stores which exercise a constraint on the prices, range or quality of
service of the focal store.

Our focal stores are the 694 stores for which we obtained pricing data. The cross-section study
was designed to test whether the prices charged by these stores were related to concentration in
their local markets. For this reason, a market needed to be defined for each of the 694 focal
stores.

The most-obvious competitors for a Supermarket are other Supermarkets; but competitors may
also include pharmacies, pet shops, liquor stores, general merchandise stores, butchers,
greengrocers and so on for individual product categories. The range of products stocked by other
stores within the market of a focal Supermarket may be termed the product dimension of its
market.

There is also a geographical dimension to the market of any focal store. The constraint of a
competitor is likely to be greatest for stores close to the focal store; and it decreases for stores
located further from the focal store. Stores that are so far away as to exert no material constraint
on the focal store should not be included in that store’s market.

We define the geographic scope of each market in terms of driving distance, that is, the time it
takes to drive from one location to another. We used the average drive time according to Google
Maps API as our measure of drive time. Thus, the geographic boundaries to the market for any
particular store are expressed in terms of an isochrone centered on the relevant focal store. 7

As an example, Figure 1 provides drive times (in seconds) between major Supermarkets and New
World Pioneer, the red area is the 10-minute isochrone.8 We define a Proximity measure as the
drive time between the focal store and the competitor store, expressed as a percentage of the
drive time of the isochrone. For example, if one were to consider a 10-minute (600 second) radius
of the spatial competition market, the closest New World would be 474 seconds away, so within
the market, with a Proximity of 21%. The closest Countdown, PAK’nSAVE and Four Square
Supermarkets are 292, 276, and 312 second away respectively, with proximities of 51%, 54% and
48%. There are no SuperValue or FreshChoice Supermarkets within 10-minutes, so these banners
receive Proximity scores of zero.

7
 Because the radii of the Google isochrones are specified in terms of drive time instead of distance, the physical
 size of the isochrones for local markets will vary by the type of area, with isochrones in rural areas likely to be
 considerably larger than isochrones in large urban centres.
8
 The isochrone is for illustrative purposes only; drive times using Google Maps API are used to derive Proximity.

Frontier Economics 21
Econometric analysis of the New Zealand Retail Grocery Sector Final

Figure 1: Drive times to New World Pioneer

Source: Frontier Economics, HERE, Google Maps

We consider four possible ‘radii’ for these isochrones; 5, 10, 15 and 20 minutes’ drive time. We
allowed the appropriate isochrone for any particular market to be decided by the data; that is,
the appropriate geographic boundaries to any particular market are those that best fit the
relationship between prices and concentration.

Analysis of competition is frequently presented as if the first step is to define the relevant
markets, followed by examining the structure of those markets (including market concentration)
and, finally, the impact of the structure of the markets on aspects of their performance (such as
prices) is analysed. Although this may be the way the analysis is presented, it is rarely undertaken
in this order.

The relationship between market definition and market power was considered by the High Court
of Australia in Queensland Wire Industries Pty Ltd v Broken Hill Pty Co. Ltd . In their joint
judgment, Mason C.J. and Wilson J. said:

 The analysis of a s.46 claim necessarily begins with a description of the market in which
 the defendant is thought to have a substantial degree of power. In identifying the
 relevant market, it must be borne in mind that the object is to discover the degree of the
 defendant's market power. Defining the market and evaluating the degree of power in

Frontier Economics 22
Econometric analysis of the New Zealand Retail Grocery Sector Final that market are part of the same process, and it is for the sake of simplicity of analysis that the two are separated.9 Consistent with this approach to market definition, we adopt markets in our econometric analysis that are themselves derived from that analysis. They are the markets that best fit the models that describe the relationship between concentration and prices. 3.5.2 Measuring concentration As we observed above, the constraint of a competitor is likely to be greatest for stores close to the focal store; and it decreases for stores located further from the focal store. For this reason, measures of market concentration in retail markets are frequently adapted to take account of the proximity of competitors to the focal store. We considered three alternative approaches to capturing the level of concentration in the local market. The first was the weighted share of the stores in the major grocery retailers (Foodstuffs, Woolworths NZ) to which the focal store belonged. For each of the considered radii (5, 10, 15- and 20-minutes’ drive time) we derived market shares of the major by first taking all member stores within the spatial market and deriving distance weighted revenue shares of each major. To derive distance weighted shares of each major, we summed the distance weighted shares of stores within each major (Foodstuffs or Woolworths NZ) within the drive time radius considered. We obtained the distance weighted revenue10 of each store by multiplying the revenue by the normalised Proximity of the Supermarket to the focal Supermarket. That is, a Supermarket at the centre of the spatial market would have revenue weighted by 100%, but the weighting would reduce to 0% at the boundary of the spatial market.11 12 The second approach we considered was the Herfindahl-Hirschman Index (HHI). We regarded this approach as less useful than the first for two reasons. In the first place, if one uses the HHI when there are only two major competitors, the HHI does not distinguish between a market in which the focal firm has the major share and a market where the focal firm has a relatively minor share. Secondly, the HHI (when applying distance weighted shares) is a function of the share of the major to which the focal Supermarket belongs in a duopoly. Our third approach to market concentration deals more-directly with the differentiation of stores by location. In this approach, we specify for each focal Supermarket a variable equal to the drive time to the closest Supermarket of each of the six banners in our analysis, and normalise the variable so that the normalised Proximity is equal to 1 if the competitor Supermarket is 0 seconds drive time from the focal store, and 0 if the competitor Supermarket is at the edge of the 9 Queensland Wire Industries Pty Ltd v Broken Hill Pty Co. Ltd [1989] HCA 6; para 187. (1989) 167 CLR 177. 10 Revenue was taken as the sum of revenue in the cross-sectional data. Our measures of market concentration could only include the stores for which we had revenue data, i.e. the Supermarkets used in the cross section analysis. We test for competition from other grocery retailers in our regressions. 11 More specifically, if a Supermarket is x seconds from the focal Supermarket, the weighting applied to the 5∗60− Supermarket’s revenue under a 5-minute radius is max(0, ). 5∗60 12 Similar approaches to shares, which may impact pricing through their impact on diversion ratios, have been applied by the competition regulators. For example, see CMA (2016), A report on the anticipated acquisition by Celesio AG of Sainsbury’s Pharmacy Business, Appendix I. Frontier Economics 23
Econometric analysis of the New Zealand Retail Grocery Sector Final isochrone or beyond in terms of drive time.13 Thus for each focal Supermarket, we can measure the proximity to the closest store from each of the six major banners with six variables between 0 (i.e. not in the market) and 1 (at the centre of the market). This includes the closest store from the same banner as the focal store. We refer to this measure as the Proximity measure of market concentration; it measures how close in geographic space the closest store from each of the major banners is to the focal store.14 We investigated these measures for each of the four different radii (5, 10, 15 and 20 minutes). We also investigated some variations of the Proximity measure. In the first we include, in addition to the Proximity to the six major banners, the Proximity to the closest other supermarkets,15 the closest international supermarkets, the closest butcher and the closest bulk food store. In the second variation we include the Proximity of the closest store to each of the above, and also the Proximity to the closest “The Warehouse” retail store, the closest “Chemist Warehouse” retail store and the closest convenience store. These models were typically not preferred over the model featuring Proximity to only the major banners. In the third variation, we use both the six major proximity variables, but also include the proximity to the second closest store of each banner. In the end, we rejected these variations because they did not fit the data as well as that using only the Proximity to the closest of each of the six major banners. 3.5.3 Measuring differences in prices We estimate separate models for each banner group. The dependent variable in each regression model is the store price index, an index that allows comparisons of prices across stores in each banner. To derive this price index, we first estimate a fixed effects regression model for each banner separately, in which the logarithm of the price of each product and store is the dependent variable in the regression model, and product and store fixed effects are included as the sole explanatory variables. The store level fixed effects coefficients are saved as the price indices.16 Because we estimate separate models for each banner and test the relationship between concentration and prices with each model, we require that prices vary across stores within banners. The extent of this variation can be observed in the distribution of the price index for each store as derived above.17 The distribution of these price indices is represented in Figure 2 below. The median price index for each banner is set to zero. The shaded box shows the range of stores between the 25th percentile and the 75th percentile; the vertical lines show the distance between the maximum and minimum stores for each banner; and the dots represent outlier stores. Figure 2 below shows that [ ] shows considerable variation in pricing across stores. However, the stores within each of the other banners typically lie within [ ] per cent of each other, with the exception of several outliers.18 13 More specifically, if a pair of Supermarkets are x seconds apart, the Proximity under a 5-minute radius is 5∗60− max(0, ). 5∗60 14 If no such store is in the defined market, it is given a score of zero. 15 By ‘fringe supermarkets’, we mean general grocery stores other than the Supermarkets. 16 We considered using the prices of products in the cross section regression, however this proved to place greater emphasis on stores that had a higher number of products sold during the sample period. 17 Each banner is set to have a median (banner specific) price index of zero. 18 Such as [ ]. Frontier Economics 24
Econometric analysis of the New Zealand Retail Grocery Sector Final

Figure 2: Distribution of price indices across stores for each banner

[ ]

Source: Frontier Economics analysis of data provided by the Commerce Commission

3.6 The control variables

We test whether differences in prices across the 694 stores for which we obtained price data are
related to differences in concentration in the local markets in which those stores are located.
When undertaking this testing, we have to ensure, as far as possible, that we control for other
factors that may be influencing differences in the prices of the focal stores.

3.6.1 Banner group

Perhaps the most-obvious variable that might explain differences in prices across stores is the
banner group to which the store belongs. As we observed in section 3.3 above, there are
substantial differences in average prices between banners, with average prices for groceries
(other than alcohol and tobacco) in the cheapest banner being some [ ] below the prices for
these products in the most-expensive banner.

We control for differences in prices across banner groups by testing the relationship between
concentration and prices separately each of the six banners.

3.6.2 Area type

We anticipated that there may be substantial differences in the cost of supplying urban
compared with rural areas, and that these differences in cost of supply may lead to differences in
prices. Stats NZ classifies areas into the following types: Large urban, Major urban, Medium
urban, Small urban, Rural settlement or Rural other area.19 We control for the Area Type in which
the focal store is located in order to control for possible differences between urban and rural
areas in the cost of supply. For the purpose of the regressions, we amalgamate areas into two
categories (Urban, Rural).

3.6.3 Demographic variables

Differences in demographic characteristics across regions may affect demand for grocery
products and so affect prices. We obtained data on the following demographic variables from the
2018 census data at the SA1 level from Stats NZ:

• Population (usual resident population)
• Median income
• Median age

 .

Frontier Economics 25
Econometric analysis of the New Zealand Retail Grocery Sector Final

• Proportion of population identifying as Maori
• Proportion of population identifying as foreign born
• Proportion of population reporting a highest qualification of Bachelor’s degree/level 7 and
 above.20

For local characteristics, we constructed isochrones centered at each focal Supermarket using
drive times of either 5, 10, 15 or 20 minutes. 21 We then applied these isochrone shapes to 2018
census data at the SA1 level provided by Stats NZ. 22 By calculating the overlap between the
Supermarket isochrones and the SA1 areas we were able to derive the demographic
characteristics of the local market to be used as control variables.

3.7 Approach to regression analysis

The cross-section analysis was carried out for each of the six major banners separately. As
observed above, we removed all alcohol and tobacco products because we are primarily
interested in core grocery products. Prior to estimating the regression models, we also removed
price outliers identified using the approach described in section 3.3.

Our regression analysis is performed separately for each banner. We also present results for
each banner using only urban stores within each banner and then using only rural stores within
each banner.23,24,25

The model specification has the store price index as the dependent variable in the regression
model, and the measures of concentration as the main variable(s) of interest on the right hand
side – six variables for the closest majors, or a single weighted revenue share variable. 26 The
models also have variables controlling for the area type27 and local market demographic
characteristics (population, income, age, Maori proportion, foreign proportion and graduate

20
 Available from https://www.stats.govt.nz/information-releases/statistical-area-1-dataset-for-2018-census-
 updated-march-2020
21
 Friday 25 June 2021, 5pm. The service used, HERE API accessed via QGIS, did not have an option for ‘average’
 traffic conditions.
22
 Available from https://www.stats.govt.nz/information-releases/statistical-area-1-dataset-for-2018-census-
 updated-march-2020
23
 We define Urban as Medium Urban Area and above.
24
 Due to sample size, we are unable to perform all regression specifications on all banner*urban/rural
 subsamples.
25
 We still retain area type dummy variables for these regressions, though in some cases there is only a single area
 type in the sample.
26
 In the economic analysis of prices, it is common practice to specify prices as the logarithms of the prices. The
 impacts of the explanatory variables on prices can then be interpreted as percentage impacts, or, depending on
 the specification of the explanatory variables, as elasticities.
27
 For this we use six dummy variables indicating if the supermarket is in a Large urban, Major urban, Medium
 urban, Small urban, Rural settlement or Rural other area.

Frontier Economics 26
Econometric analysis of the New Zealand Retail Grocery Sector Final

proportion), which could affect costs or demand in the local market. Finally, we include the log of
the store size.28

To determine which spatial markets are most applicable, we first estimate regression models that
include only the area type and demographic variables.29 This allows us to choose the most
appropriate isochrone for demographic variables (5, 10, 15, or 20 minutes’ drive time, traffic
enabled or not) by choosing the drive time that yields the best model fit. We select the best-fitting
models using the Bayesian Information Criterion (BIC), which involves picking the model with the
lowest BIC value.30,31

We next add the various alternatives for the competition variables. For each of the five
competition variables (weighted share, Proximity to majors, and the three expanded competitor
Proximity specifications) we select the appropriate radius for competition variables (5, 10, 15 or
20 minutes’ drive time). We again use the BIC criterion to select the best-fitting competition
radius for each specification.

We then revisit the appropriate radius for calculating the market demographic characteristics for
the best model for each of the four approaches to capturing competition in local markets.

We note that the competition measures may be endogenous – entry into local markets may be
induced by profitable market conditions. To account for endogeneity, we adopt an instrumental
variables (IV) approach for the weighted group shares model specification. As instrumental
variables, we use the six demographic variables, the six area type dummy variables, and the
unweighted share of each group within a 20-minute radius. The use share (calculated without any
distance weights) within a 20-minute radius serves as the key instrument; it is highly correlated
with the weighted share yet not impacted by local market conditions to the same extent.

We explored implementing the instrumental variables approach for the Proximity specifications,
but we were unable to obtain suitable instrumental variables. We considered the number of
stores of each banner within a 20-minute radius, analogous to the weighted share IV approach,
but this proved to be a weak instrument. As a consequence, we use OLS to estimate the models
with the Proximity specification; and we note the potential for endogeneity.

3.8 Regression results

We report the results for the IV approach for the specification with weighted share as a measure
of concentration; and we report the OLS results for the various Proximity specifications for the
concentration measure.

28
 Several stores did not supply this information, presumably because they were closed as at 2021. We also note
 that the size of some Four Square stores appears to be rounded to the nearest 100 square meters.
29
 Since the radii of the isochrones are specified in terms of drive time instead of distance, the physical size of the
 isochrones for local markets will vary by the type of area, with isochrones in rural areas likely to be considerably
 larger than isochrones in large urban centres.
30
 Given the large number of observations relative to the number of variables, this is essentially equivalent to
 selecting the model with the highest R-squared value.
31
 We apply robust standard errors.

Frontier Economics 27
Econometric analysis of the New Zealand Retail Grocery Sector Final

3.8.1 Weighted own group share

We first present the results for the specification that uses the weighted spatial market share of
own group as the measure of competition.

Table 10 and Table 11 below present the radii used to derive the weighted market share and the
demographic characteristics relevant to the local market. It should be noted that the two radii are
obtained from different sources and may not be directly comparable: the former is average drive
time according to Google Maps API, and the latter is drive time (either with traffic or no traffic)
according to HERE API. Further, any apparent inconsistencies between the two radii may be due
to differences in how each element enters the pricing equation: it is plausible that characteristics
of potential customers within small geographic area are relevant, though competitors outside
that area may still pose a constraint on pricing.

It is interesting that we often observe that the stores in rural areas have smaller radii than the
stores of the same banner in urban areas. This may be a consequence of using drive time – the
radii in terms of kilometres may be substantially larger in rural areas due to lower traffic and
higher road speeds. Further, it is possible that the drive time is overstated if people tend to visit
supermarkets during times of lower traffic relative to that assumed by Google Maps API for the
‘average drive time’.

Table 10: Selected radius (minutes’ drive time) for competition – Weighted share approach

 All Urban Rural

 Four Square 20 20 10

 New World 20 20 15

 PAK’nSAVE 20 20 n/a

 Countdown 15 5 10

 FreshChoice 20 20 15

 SuperValue 15 15 15

Source: Frontier Economics analysis of data provided by the Commerce Commission, Google Maps data, HERE data

Frontier Economics 28
Econometric analysis of the New Zealand Retail Grocery Sector Final

Table 11: Selected radius (minutes’ drive time) for characteristics – Weighted share approach

 All Urban Rural

 Four Square 20 20 (no traffic) 20

 New World 10 (no traffic) 10 (no traffic) 5

 PAK’nSAVE 20 20 n/a

 Countdown 5 10 10 (no traffic)

 FreshChoice 10 (no traffic) 15 (no traffic) 20

 SuperValue 20 10 10 (no traffic)

Source: Frontier Economics analysis of data provided by the Commerce Commission, Google Maps data, HERE data

Table 12 presents the estimates for the impact of the distance-weighted own-group share on
prices. The table shows that the impact is typically positive and significant. The estimated impacts
of the weighted own-share ranges from 1.5% to 3.2% when examining the full samples.
Countdown is an exception: it exhibits no significant response to the weighted own-share.

The impact of concentration can differ substantially when comparing the full samples to the
urban and rural samples; however, it again tends to be positive and, with some statistically
significant results. While FreshChoice and SuperValue exhibit negative impacts of concentration
in the urban subsamples, it should be noted that these results are significant only at the 10%
level, and also arise from small datasets: 19 and 22 observations respectively.

The coefficients imply that, as the weighted own-share increases from 0% to 100%, a focal
supermarket increases prices by between 1.5 to 3.2%. 32

32
 PAK’nSAVE (rural) had insufficient observations to perform the regression.

Frontier Economics 29
You can also read