Earthquake Occurrences of the Major Tectonic Terranes for the Arabian Shield and Their Seismic Hazard Implications
←
→
Page content transcription
If your browser does not render page correctly, please read the page content below
ORIGINAL RESEARCH
                                                                                                                                              published: 21 March 2022
                                                                                                                                        doi: 10.3389/feart.2022.851737

                                            Earthquake Occurrences of the Major
                                            Tectonic Terranes for the Arabian
                                            Shield and Their Seismic Hazard
                                            Implications
                                            Sherif M. Ali 1,2* and Kamal Abdelrahman 3
                                            1
                                              National Research Institute of Astronomy and Geophysics (NRIAG), Cairo, Egypt, 2Preparatory Commission for the
                                            Comprehensive Nuclear-Test-Ban Treaty Organization (CTBTO), International Data Centre (IDC), Vienna, Austria, 3Department of
                                            Geology and Geophysics, College of Science, King Saud University, Riyadh, Saudi Arabia

                                            The Arabian Shield, which contains a group of diverse terranes accreted during the Late
                                            Proterozoic, has experienced considerable historical and recent earthquake activities.
                                            From north to south, the Midyan terrane, Tabuk-Neom area, Hijaz terrane, Jeddah terrane,
                                            and Asir terrane make up the western section of the Arabian shield. In order to determine
                         Edited by:         the earthquake occurrences and earthquake recurrence characteristics in the study area,
               Ahmed M. Eldosouky,
               Suez University, Egypt
                                            an earthquake dataset containing 2,991 seismic events recorded between 1941 and 2019
                        Reviewed by:
                                            with magnitudes of 1.0 and 6.2 and depths between 0 and 50 km was examined. The data
                      Melouah Oualid,       were compiled by combining phase readings and information, such as origin times,
        University of Ouargla, Algeria
                                            hypocenter parameters, and magnitudes reported by the International Seismological
      Franck Eitel Kemgang Ghomsi,
    National Institute of Cartography,      Centre. The maximum likelihood method has been applied to calculate the
                            Cameroon        Gutenberg–Richter recurrence parameters (a- and b-values) and magnitudes of
                        Erdinc Oksum,
 Süleyman Demirel University, Turkey
                                            completeness (Mc). The range of b-values is 0.53–1.04, which indicates that the study
                         Mostafa Toni,      region experienced different stress level accumulations that cause earthquakes with
            Helwan University, Egypt
                                            different magnitudes. The Hijaz terrane is characterized by a high b-value (1.04 ± 0.34),
                *Correspondence:
                                            which indicates a relatively low stress regime that resulted from the earthquakes stress
                       Sherif M. Ali
     sherifmohamed.ali@hotmail.com          release. The Midyan terrane is characterized by a low b-value (0.53 ± 0.10), which could be
                                            indicative of a relatively higher stress regime associated with a dominantly extensional
                    Specialty section:      stress. Mc values were found to be 1.4 in Midyan and Jeddah terranes. The lower value of
         This article was submitted to
              Solid Earth Geophysics,       Mc at Midyan terrane demonstrates appropriate station distribution and high earthquake
               a section of the journal     rates. However, at Jeddah terrane, the seismic activities are poorly detected that probably
            Frontiers in Earth Science
                                            lead to the small value of Mc. Higher Mc are evident in Hijaz terrane (Mc = 2.3) and Tabuk-
         Received: 10 January 2022
        Accepted: 08 February 2022
                                            Neom (Mc = 2.4), where the station distribution is very poor. The maximum expected
         Published: 21 March 2022           magnitudes (Mmax) are found to be 6.0 for Midyan terrane, 5.4 for Tabuk-Neom, 4.7 for
                              Citation:     Hijaz terrane, 4.8 for Jeddah terrane, and 7.7 for Asir terrane. The average recurrence intervals
   Ali SM and Abdelrahman K (2022)          of earthquakes with the Mmax are ~7, ~20, ~6, ~120, and ~200 years for each seismic terrain,
Earthquake Occurrences of the Major
    Tectonic Terranes for the Arabian
              Shield and Their Seismic      Abbreviations: NRIAG, National Research Institute of Astronomy and Geophysics; CTBTO, Preparatory Commission for the
                   Hazard Implications.     Comprehensive Nuclear-Test-Ban Treaty Organization; IDC, International Data Centre; ISC, The International Seismological
          Front. Earth Sci. 10:851737.      Centre; Mc, magnitudes of completeness; Mmax, the maximum expected magnitudes; G–R, the Gutenberg–Richter rela-
      doi: 10.3389/feart.2022.851737        tionship; FMD, frequency–magnitude distributions.

Frontiers in Earth Science | www.frontiersin.org                                   1                                          March 2022 | Volume 10 | Article 851737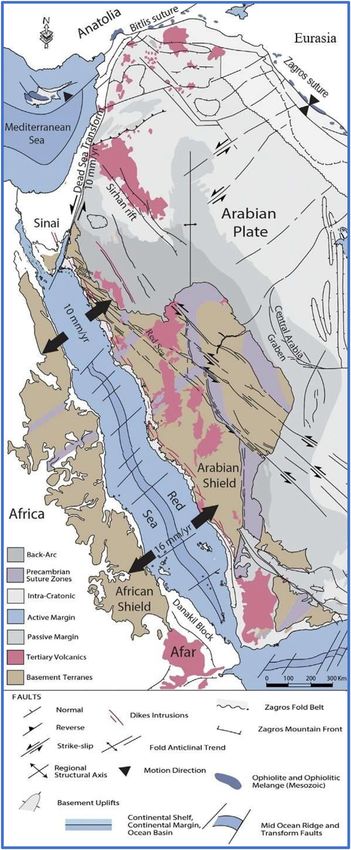
Ali and Abdelrahman                                                                                                          Earthquake Occurrences at Arabian Shield

                                            respectively. The probability of occurrence and returned periods of different magnitudes in
                                            each region indicate that regions related to the Najd strike-slip fault system are the regions for
                                            large probable earthquake occurrences.
                                            Keywords: seismicity, magnitude of completeness (Mc), b-value, the International Seismological Centre (ISC),
                                            seismic hazard, Arabian Shield

1 INTRODUCTION                                                                         southern Turkey in the north through Syria and the Dead Sea to
                                                                                       the Gulf of Aqaba. A rise to the Turkish–Iranian Plateau due to
The Arabian Plate, bounded by relatively active tectonic regions is                    the collision between the Eurasian Plate and the Arabian Plate has
characterized by dominant earthquake activities (Girdler, 1991;                        led to convergent boundaries, which border the Arabian Plate
Al-Haddad et al., 1994; Ghebreab, 1998; Stern and Johnson, 2010;                       from the east and the north, while at the west (the Red Sea) and
Al-Amri, 2013; Youssef, 2015). The Dead Sea transform fault                            the south (Gulf of Aden), divergent margins originated as a result
bounds the Arabian Plate on the northwest and extends from                             of sea floor spreading and rifting (Figure 1).

  FIGURE 1 | The Arabian Plate, showing outcrops of Neoproterozoic and older rocks in the Arabian Shield and Oman, Cenozoic basalt associated with the opening
  of the Red Sea, and the plate boundaries—extensional in the south and west, convergent in the north and northeast, and transcurrent in the northwest and southeast
  (https://sgs.org.sa/en/ topics/landforms-of-saudi-arabia/).

Frontiers in Earth Science | www.frontiersin.org                                   2                                          March 2022 | Volume 10 | Article 851737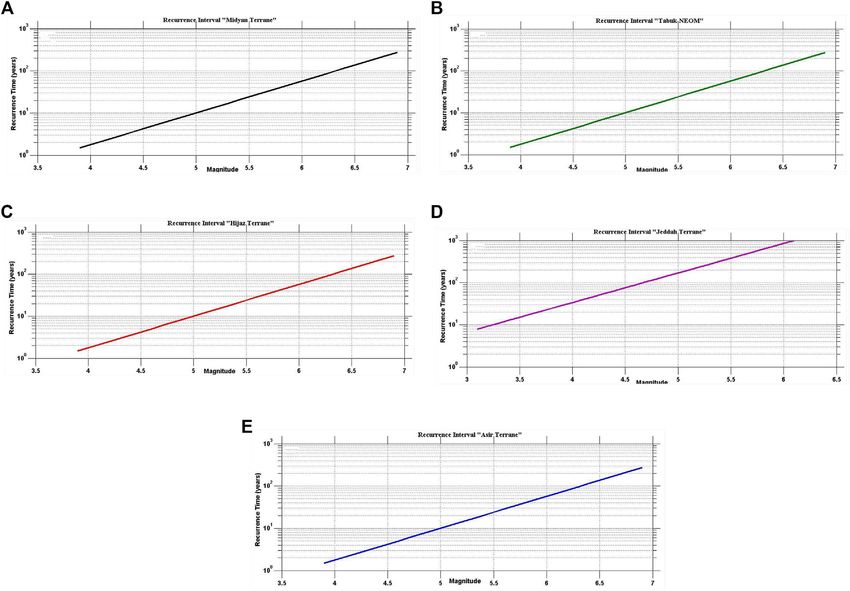
Ali and Abdelrahman                                                                                                        Earthquake Occurrences at Arabian Shield

  FIGURE 2 | Geologic map of the Arabian Shield showing the major geologic terranes and their boundaries, Najd fault system, and sedimentary basins (modified
  after Al-Amri et al., 2004) and the seismic activity from 1980 to 2019 using the International Seismological Centre catalog (ISC, 2021).

   In the past, the Arabian shield experienced considerable                          1985). It is a stable craton, which comprises a crystalline basement,
earthquake records (Ambraseys and Adams, 1988; Ambraseys                             predominantly metavolcanic, metasedimentary, and plutonic rocks of
and Melville, 1988, 1989). However, it has incomplete pre-                           Precambrian continental crust of about 40–45 km thick (Davidson
instrumental earthquakes activities due to sparse population,                        et al., 1994; Genna et al., 2002). Its slightly arched surface is a
which reveal the prominent tectonic activities in the Cenozoic.                      peneplain sloping very gently toward the north, northeast, and east.
During the last century, several moderate-sized to large                                The accumulation of oceanic island arcs along suture zones
earthquakes shock the area and the adjacent territories. Two                         defined by ophiolites forms the Arabian shield (Stoeser and
large magnitude earthquakes were recorded on January 11, 1941                        Camp, 1985). The accretion produces tectonostratigraphic
and November 22, 1995 with magnitudes of MS = 6.5 and                                terranes, which are divided by significant suture zones
MW = 7.3, respectively (Ambraseys et al., 1994; Klinger et al.,                      oriented north and northeast, and lined by serpentinite
1999). The seismic sources are divided into three types including                    ultramafic rocks (tectonic slices and ophiolites) or major NW
active geological faults, area source zones, and smoothed                            trending faults (Figure 2). The Midyan terrane, the Tabuk-Neom
seismicity. The active fault is the dominant, especially when                        area, the Hijaz terrane, the Jeddah terrane, and the Asir terrane
the magnitude and focal mechanism are well recognized.                               formed the western half of the Arabian Shield, from north to
   The Arabian Shield, a prehistoric land mass with a trapezoidal                    south (Johnson, 1998; Stern and Johnson, 2010). These terranes
shape is surrounded by Phanerozoic sediments and separated from                      are separated by major suture zones, namely, Yanbu, Bi’r Umq,
the Red Sea by tight coastal plain of Cenozoic sediments (Kroner,                    Afif, Nabitah, and Al Amar suture zones.

Frontiers in Earth Science | www.frontiersin.org                                 3                                          March 2022 | Volume 10 | Article 851737
Ali and Abdelrahman Earthquake Occurrences at Arabian Shield
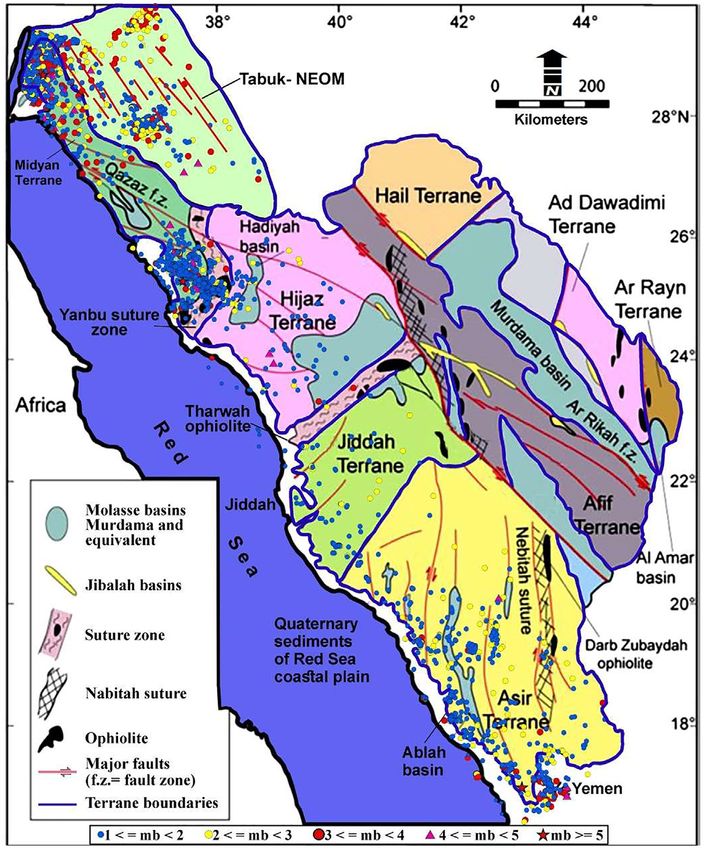
FIGURE 3 | the range of 4.5–4.7 mm/year (e.g., ArRajehi et al., 2010).
Counterclockwise rotation of Arabia relative to Eurasia was reported after
Reilinger et al. (2006) in the range of 20–30 mm/year, leading to left lateral
strike slip (East Anatolian Fault) along the northern boundary of the Arabian
Plate with GPS slip rates in the range of 17–24 mm/year from east to west
Turkey. The slip rates increase eastward along the Zagros mountain belts from
18 to 25 mm/year (Walpersdorf et al., 2006).
Aldaajani et al., 2021 stated that, at the northern boundary of
the Arabian Plate, the boundary forces seem to have changed
from compression to strike-slip style, due to the oblique collision
between Anatolian and Arabian plates, which led to lateral escape
tectonics of the Anatolian Plate (Figure 3) (Reilinger et al., 2006).
This may have occurred simultaneously with the crustal
extension in the Red Sea. Following the collision of Arabia
and Eurasia and the Red Sea initiation, the strength contrast
between Afro-Arabia continent and the oceanic lithosphere of the
Mediterranean may have initiated movement along the Dead Sea
Transform soon after a dike intrusion event along the western
margin of the Arabian Plate (ArRajehi et al., 2010). This
ultimately resulted in the development of the Sinai microplate
(Beydoun, 1999).
The purpose of this study is to characterize the seismic
activities related to these main terrains in the Arabian Shield.
Furthermore, the study aims to indicate the dominant tectonic
regimes of the studied regions and identify their related faulting
types as well as characterize the earthquake rate changes and the
risk of higher magnitude earthquakes related to each terrane, and
obtain some seismicity parameters [a- and b-values and
magnitude of completeness (Mc)]and seismic hazard
parameters (earthquake recurrence and maximum expected
magnitude) to be able to perform actions for seismic risk
reduction in the studied region.
2 TECTONIC ENVIRONMENTS
Saudi Arabia occupies the majority of the Arabian plate that was
formed between 25 and 30 million years ago. Because of rifting
along the northeastern African continent’s boundary, the Red
Sea, and the Gulf of Aden opening, the rocks that make up the
Arabian Peninsula, Jordan, Syria, Iraq, and westernmost Iran are
found to split up from the African continent. Although the plate
is a relatively new tectonic unit, it combines materials that have
formed over a long period of geologic time. These rocks comprise
a 45-km-thick layer of continental crust. Because of Mesozoic and
Cenozoic uplift, Precambrian rocks are exposed toward
southwest of the plate. In other places, the Precambrian rocks
are obscured by a low-dipping succession of Phanerozoic
deposits, which can be more than 10-km thick in the Arabian
FIGURE 3 | Geological and tectonic elements map of the Arabian Plate
Gulf (Johnson, 1998). Precambrian shields typically have
and surrounding regions modified after Sharland et al. (2001). Geodetic sufficiently thick and cold lithosphere that mantle earthquakes
observations estimate extensional rates along the Red Sea between 7 and could occur. Their exceedingly low strain rates, including those
15 mm/year from north to south, and between 15 and 19 mm/year from within Arabia, cause mantle earthquakes to be particularly rare
west to east, left lateral slip rates along the southern Dead Sea Transform in
beneath shields (Frohlich et al., 2015). Volcano-seismicity, with
(Continued )
mantle and lower-crustal earthquakes likely caused by early-stage
Frontiers in Earth Science | www.frontiersin.org 4 March 2022 | Volume 10 | Article 851737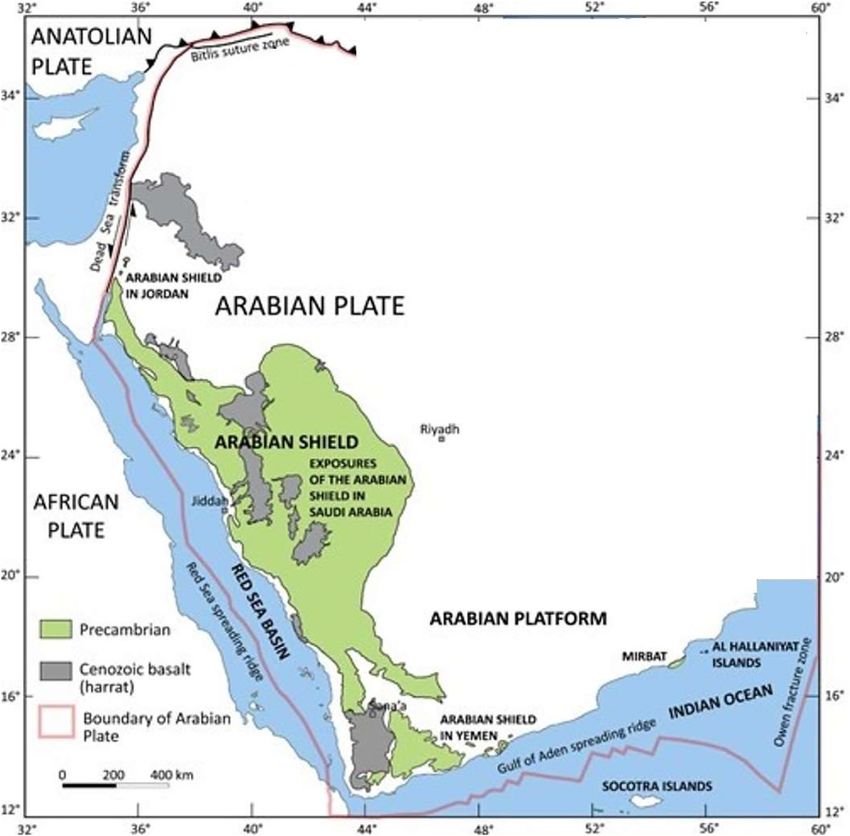
Ali and Abdelrahman                                                                                              Earthquake Occurrences at Arabian Shield

pooling and mixing of asthenospheric melt at the base of or
within the lower-crust, are also rare in cratons, including Arabia,
given their low heat flow (Prieto et al., 2017).
    Tectonically, the movement of the Arabian plate northeast
away from Egypt and Sudan is accompanied by compression and
strike-slip displacement along the Zagros and Bitlis zones, and by
strike-slip faulting along the Dead Sea transform. The northern
part of the Arabian plate moves northwest toward the Eurasian
plate with a rate of 20 ± 3 mm/year (Johnson, 1998; Jamali et al.,
2006). The tectonic pattern of the western Arabia is congenital
from the basement tectonics of ancient Nubian–Arabian shield,
which received its main structural imprint during late
Precambrian orogenic stages. The most important tectonic
features are the NW-SE strike faults parallel to the extension
of the Red Sea, Gulf of Suez rift, Aqaba fault trend, Najd faults
system, NE-SW, and E-W (Tethyan trend) that affect the north
and the NW Red Sea region.
    The Najd strike-slip fault system is the Arabian shield’s most
notable structural feature. It extends in a zone >1,200 km in
length and >300 km wide over the north-eastern Arabian Shield.
This faults trend NW-SE with strike lengths >500 km, small
sinistral displacements 240 km. The Najd system’s shear zones
separate the western and eastern geologic terranes. From the
NE coast of the Red Sea to the SE shield area, where the fault
system is hidden beneath Mesozoic sedimentary strata, at least
four major NW-SE trending left-lateral wrench zones of Najd
intersect the shield. On the Najd system, cumulative Precambrian
left-slip fault is estimated to be around 240 km (Brown, 1970).
The Arabian Shield is made up of metamorphosed rocks that are
overlain by a thick succession of Phanerozoic sedimentary rocks            FIGURE 4 | Focal mechanism solutions of the 122 earthquakes in the
to the east, north, and south, and the Red Sea to the west. The            Arabian Shield and its surrounding regions during the period from 1977 to
shield’s rocks are mostly Cenozoic basaltic volcanic lava fields,           2021. Normal faulting solutions (in red). Strike-slip solutions (in blue) and
                                                                           thrusting solutions (in green). Size of focal sphere is proportional to
known as Harrat (an active volcanic field located along the
                                                                           magnitude.
western edge of the Arabian Shield, east of the Red Sea rift
margin, beneath which earthquakes occurred within the
lithospheric mantle), whereas those to the west of it are
Cenozoic rocks from the Red Sea basin. The Red Sea and Gulf               Peninsula’s extreme southwest. On January 11, 1941, near the
of Aden basins and phanerozoic rocks are typically slightly               modern Saudi Arabia–Yemen border, one of the greatest
deformed and impacted by block faulting and open folds. The               occurrences of magnitude Ms = 6.5 happened. It resulted in
western and southern edges of the Arabian Plate were uplifted             the deaths of several hundreds of people and the destruction
and partly surrounded by subaerial flood basalt during the                 of 1,700 buildings, 300 of which were destroyed, and 400 were
previous 25 million years, culminating in the development of              severely damaged (Ambraseys et al., 1994). On January 23, 2014,
the Red Sea Cliff and Harrat (Davidson et al., 1994).                     an earthquake sequence was recorded around 50 km northeast of
                                                                          Jizan city, with the greatest occurrence having a local magnitude
                                                                          of Ml = 5.1 (El-Hadidy et al., 2015; Youssef, 2015). The
3 SEISMICITY OF THE ARABIAN SHIELD                                        earthquake fault plane solution indicates mainly a strike-slip
                                                                          northeast–southwest faulting mechanism, which, together with
The Arabian Plate has a clustered seismicity along the Dead Sea           the aftershock distribution, matches the known NE-SW faults.
transform fault, the Red Sea rifting, Zagros fold and thrust belt,           The northwestern Arabian Shield is characterized by strong
Makran subduction zone and Biltis thrust. Along the Red Sea               historical earthquakes (Ambraseys and Melville, 1989; El-Isa and
rifting, the Gulf of Aden and Gulf of Aqaba, seismic activity is          Al Shanti, 1989); the largest earthquake took place in AD 1068
largely controlled and confined. It is concentrated near the axial         with an intensity ~IX. It caused nearly 20,000 deaths and huge
trough of the Red Sea (Al-Malki and Al-Amri, 2013).                       damages in Tabuk City, the Sinai Peninsula, and near the Dead
    The spreading of the Red Sea floor and volcanism are linked to         Sea (Ambraseys and Melville, 1989; El-Isa and Al Shanti, 1989).
the distribution of earthquakes in the western half of the Arabian        Many recent moderate-to-large earthquakes are located in the
Shield. Several moderate-sized earthquakes struck the Arabian             study area, including a series of earthquakes in June 2004, about

Frontiers in Earth Science | www.frontiersin.org                      5                                           March 2022 | Volume 10 | Article 851737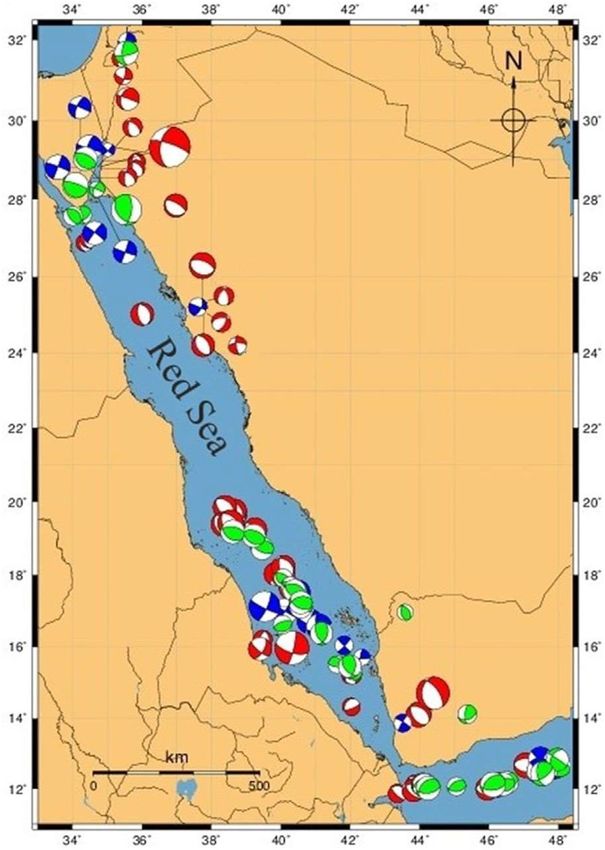
Ali and Abdelrahman                                                                                                      Earthquake Occurrences at Arabian Shield

TABLE 1 | Number of earthquakes, magnitude, and depth ranges; seismicity and seismic hazard parameters for the studied regions in the Arabian Shield.

Regions                    Total                No.           Depth          Max mag              a-value           b-value               Mc              Mmax
                            no.              of events        range
                         of events            M ≥ 1.0          (km)

Midyan terrane            16,483               1,521          0–51               5.5               3.73            0.53 ± 0.10         1.4 ± 0.35          6.0
Tabuk-NEOM                 1,012                899           0–35               4.9               4.35            0.76 ± 0.13         2.4 ± 0.48          5.4
Hijaz terrane               103                  55           0–59               4.2               3.88            1.04 ± 0.34         2.3 ± 0.56          4.7
Jeddah terrane              114                  68           0–19               4.3               2.70            0.70 ± 0.19         1.4 ± 0.38          4.8
Asir terrane                716                 448           0–57               6.2               3.72            0.83 ± 0.23         1.6 ± 0.44          6.7

60 km southwest of Tabuk. The largest earthquake in this series
took place on June 22, 2004 with a magnitude of Ml = 5.2. On
August 27, 2009, an earthquake with a magnitude of Ml = 5.1
took place about 45 km north of Badr City. On May 19, 2009, the
area was hit by an earthquake swarm in Harrat Lunayir with
magnitudes of Ml = 5.4 for the main event, which was felt in Al
Madinah (Youssef, 2015; Zahran et al., 2016).

4 FOCAL MECHANISM SOLUTIONS
Several approaches are used to understand the earthquake
phenomena. One such approach is the focal mechanism solutions
(FMS). The main purposes of focal mechanism analysis are to
identify seismic faults from seismological observations and to
study the type of displacement and the relative motion between
the different plates’ boundaries. The focal mechanism solutions,
together with the distribution of seismic activity are very useful
indicators for the seismotectonic setting, the earthquake generating
processes, and the stress regime of a certain region. Determination of
the focal mechanism solutions provides extensive information about
the sense of fault movements and the state of stress in the
lithosphere. In this study the most recently compiled focal                            FIGURE 5 | Flowchart of the International Seismological Centre (ISC)
mechanism dataset given for the Arabian Shield and surrounding                         database processing. Ave, average (mean); Med, median; Sdev, standard
regions are considered. Focal mechanism data were mainly obtained                      deviation. Mw is equivalent moment magnitude. See Appendix A for the
                                                                                       institute codes.
from the International Seismological Centre (ISC) catalog for the
region from 12° to 32°N latitudes and between 34° and 48°E
longitudes). The final compiled focal mechanisms catalog is
comprised of a total number of 122 solutions spanning the time
period from 1977 to 2021. These solutions, which are presented in                   relationship between their frequency of occurrences and
Figure 4, demonstrate a majority of normal faulting mechanism.                      magnitude distributions (FMD) can be given by the following
Some scarcely strike-slip and thrust faulting mechanism solutions                   equation:
are also noticed. The normal mechanism with centroid depths at                                                log N(M)  a − b M                               (1)
12–19 km, a strike-slip mechanism with centroid depths at
10–22 km and a thrust mechanism with centroid depths at                             where the cumulative number of earthquakes N(M) is computed
10–25. The focal mechanism solutions show a dominant                                for all magnitudes M and greater. The a and b parameters are the
extensional regime with almost horizontal NE-SW trending.                           seismicity constants that are indications for the seismic activity
                                                                                    level and the slope of the FMD, respectively.
                                                                                       The a-value is the seismic activity rate that illustrates the above
5 ANALYSIS OF SEISMICITY PARAMETERS                                                 equation when it cuts across at M = 0. This variable parameter
                                                                                    changes with the changes of seismic activity, the time, and term of
5.1 Gutenberg–Richter relationship                                                  observation, the earthquake magnitude, and the stress regime of
The Gutenberg–Richter (G–R) relationship is the common                              the region under study (Gutenberg and Richter, 1944). With the
recurrence relationship, which describes the seismicity of a                        increasing earthquake magnitudes in a region, the slope of its
seismic region. Once the earthquakes take place, the                                frequencies is determined by the b-value. It can also present the

Frontiers in Earth Science | www.frontiersin.org                                6                                         March 2022 | Volume 10 | Article 851737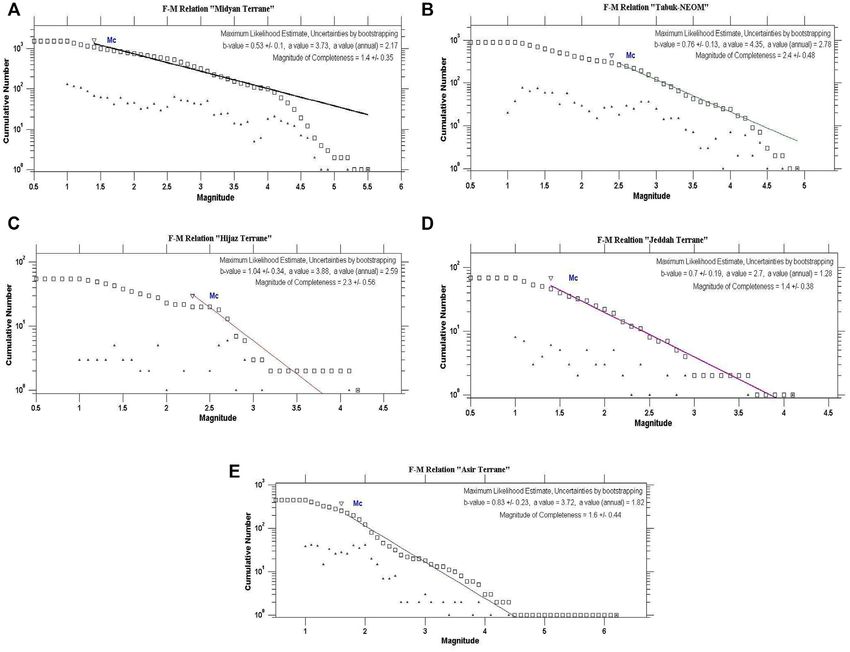
Ali and Abdelrahman                                                                                                            Earthquake Occurrences at Arabian Shield

  FIGURE 6 | The statistical analysis results of the Arabian Shield region using the whole dataset. (A) The evolutions among the levels of seismic activities, (B) the
  magnitude–frequency relationship, Mc is the cutoff magnitude (triangles and squares show earthquake numbers and the cumulative earthquakes for each magnitude
  value, respectively), (C) the magnitude histogram, (D) the depth distributions, and (E) the time histogram.

proportion of the earthquake sizes in numbers. The b-value is                           decreasing the Mc values lead to take a huge number of bogus
changing by the stress and strain distribution as well as the type of                   data (Mignan and Woessner, 2012). The completeness magnitude
the rock. It is close to unity for most tectonically active regions                     is a basic requirement for modeling the seismicity in a region. The
(Schorlemmer et al., 2005). Areas with low heterogeneities                              maximum curvature technique, the most reliable method to
(reduced geological complexity or crack density) and low                                estimate Mc, is utilized to locate the maximum curvature
thermal gradients are characterized by low b-values, while                              point that refers to the magnitude of completeness by
high heterogeneous regions, which are characterized by low                              computing the first derivative maximum value of the slope of
velocity of deformation and less stress and strain, are the areas                       earthquake curve (Wiemer and Wyss, 2000).
of higher b-values (Mogi, 1962; Manakou and Tsapanos, 2000).                                There are various other methods to determine the magnitude
The correlation between b-values and the faulting mechanisms                            of completeness. Some of these methods are the Mc by b−value
has been inferred from some previous studies, which relates                             stability, median-based analysis of the segment slope, and
normal faults to b-values ~1.1, strike-slip faults to b-values                          goodness-of-fit test. Although, the maximum curvature
~0.9, and thrust faults to b-value ~0.7 (Schorlemmer et al., 2005).                     technique is easily applicable, Mc can be misjudged for the
                                                                                        gradually curved FMDs. Consequently, utilizing other methods
5.2 Magnitude of completeness                                                           provide more reasonable estimates for Mc (Michael, 2014). When
The magnitude of completeness (Mc) is defined as the lowest                              using more homogeneous local dataset, the maximum curvature
magnitude above which most of earthquakes are detected in                               technique gives more reasonable values for Mc (Mignan et al.,
space–time volume (Wiemer and Wyss, 2000; Ali and                                       2011; Hafiez and Toni, 2020). The maximum curvature method
Shanker, 2017; Hafiez and Toni, 2020; Ali and Akkoyunlu,                                 requires less events compared with other methods, where
2022). The accurate estimation of Mc is crucial, where                                  uncertainties are also applicable by applying the Monte Carlo
increasing the values of Mc lead to take insufficient data and                           approach of the bootstrap technique (Efron, 1979). When the

Frontiers in Earth Science | www.frontiersin.org                                    7                                           March 2022 | Volume 10 | Article 851737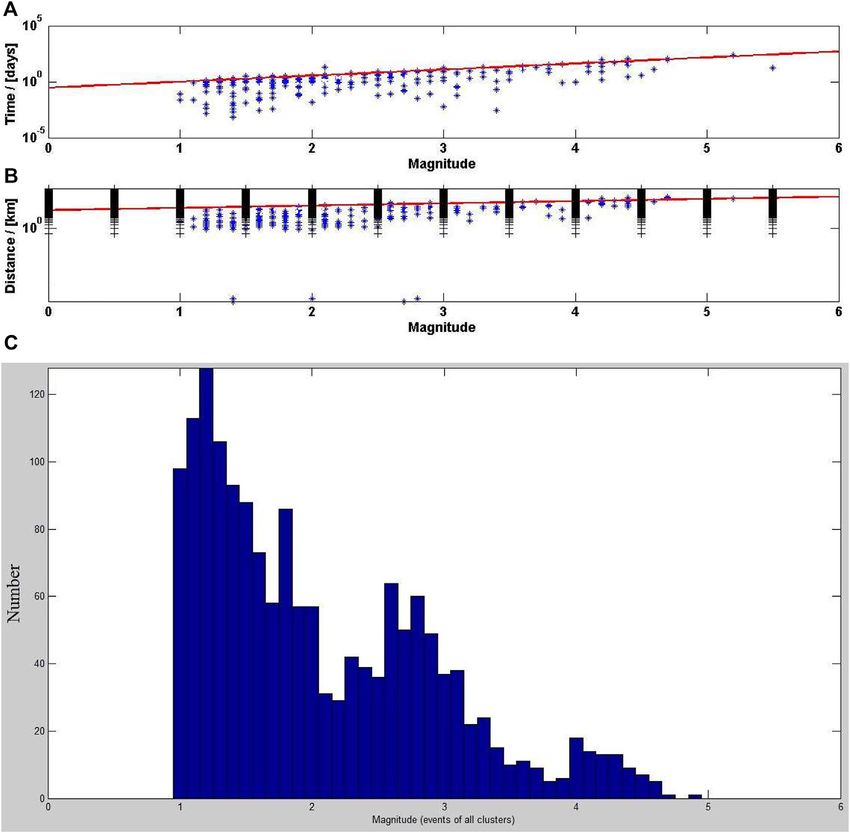
Ali and Abdelrahman                                                                                                        Earthquake Occurrences at Arabian Shield

  FIGURE 7 | Distribution of events through (A) time and (B) latitude for foreshock, mainshock, and aftershock sequences. (C) The magnitude histogram of the
  declustered catalog.

number of events is small, it leads to higher uncertainty values,                    California Seismic Hazard Maps (Petersen et al., 1996), and in
and when the sample size is large enough (≥150 events), it allows                    fault lengths and global earthquakes (Leonard et al., 2001). This
a better estimation for Mc.                                                          method is defined by the following equation:

5.3 Seismic hazard parameters                                                                                  P (M)  1 − e−N(M)pT                            (2)
The assessment of the previous earthquake distribution and their
                                                                                     where P (M) is the probability that at least one earthquake will
magnitudes in a seismotectonic region, as well as the calculation
                                                                                     take place within certain periods (T), M is computed by Eq. 1.
of the seismicity parameters, is the main stride to estimate the
                                                                                     According to the Poisson model, the recurrence interval (Q) is
earthquake probability. The a- and b-values in the
                                                                                     given by the following equation:
Gutenberg–Richter FMD can be employed to foresee the
probability of future earthquakes of various magnitudes and                                                         Q  1N(M)                                 (3)
recurrence intervals (Mogi, 1962; Scholz, 1968).
    The earthquake probability of magnitude M (in any period T)                         The relationship between the magnitude and reputed length
is calculated by the Poisson model, a base model to calculate the                    (L) is employed for computations of the maximum expected
probabilistic seismic hazard that have been used in the maps of                      earthquake magnitudes. The most likely magnitude for a certain
the National Earthquake Hazard (Frankel, 1995), in the                               maximum rupture is estimated by (L), which is not the maximum

Frontiers in Earth Science | www.frontiersin.org                                 8                                          March 2022 | Volume 10 | Article 851737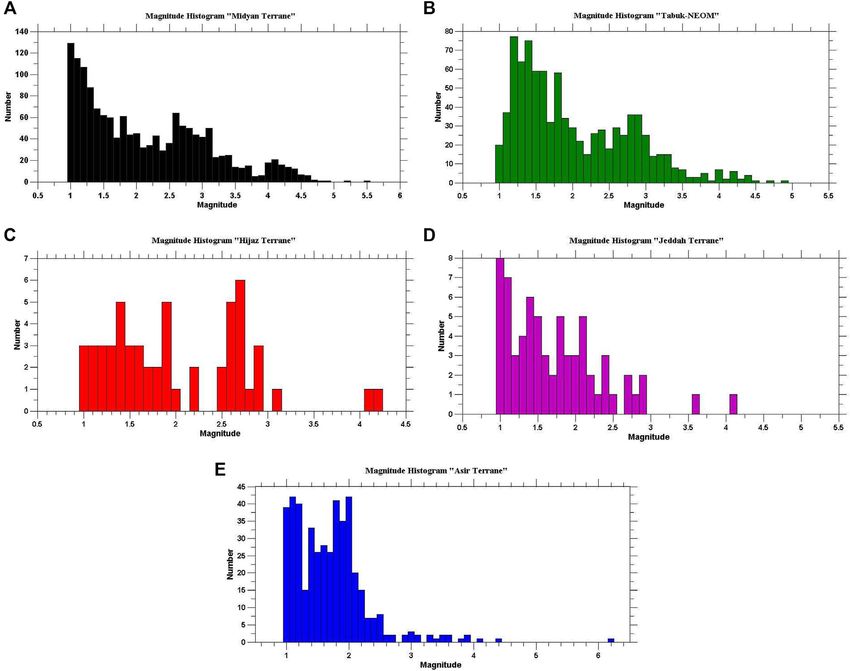
Ali and Abdelrahman                                                                                                      Earthquake Occurrences at Arabian Shield

  FIGURE 8 | (A–E) Frequency–magnitude relations of the studied seismic regions calculated by the maximum curvature technique. Mc is the cut-off magnitude
  (squares and triangles show the cumulative earthquakes for each magnitude value, as well as the earthquake numbers, respectively).

magnitude, but rather the magnitude that could be anticipated to                     catalog has longer time span, the hazard parameters are well
overtake in half of the earthquakes correlated with that rupture                     estimated (Rydelek and Sacks 1989; Wiemer and Wyss 2000;
length.                                                                              Woessner and Wiemer, 2005; Ali, 2016).
                                                                                         The initial earthquake catalog in the current study is compiled
                          M  5.08 + 1.16plog(L)                           (4)
                                                                                     for the Arabian shield. It initially comprises 3,750 local
   It is possible to use the regression models to estimate the                       earthquakes recorded during the period from 1941 to 2019
expected magnitude. Wells and Coppersmith (1994) used the                            with magnitudes range from 1 to 6.2 and focal depths range
documented and published historical and recent reports to take                       from 0 to 50 km. This catalog is utilized to characterize seismicity
out relations between the rupture length and average surface                         of the study area. It is compiled by combining phase readings and
displacement. The maximum expected magnitude (Mmax) was                              information retrieved from regional seismological agencies and
obtained by adding 0.5 units to the maximum observed                                 reported by the International Seismological Centre (ISC) online
magnitude (Kijko, 2004) (Table 1).                                                   bulletin available at (http://earthquake.isc.ac.uk/). In examining
                                                                                     the earthquake catalog completeness, the earthquake dataset used
                                                                                     in the seismicity studies should use similar magnitude scales. The
6 SEISMICITY CATALOG                                                                 most recorded events in the study area have been reported by ISC
                                                                                     in “ml” magnitude scale. Only few events are reported by other
The earthquake catalog is one of the most important outputs of                       different magnitude scales, such as Md, mb, and/or Ms, which
seismology. It presents a broad dataset in earthquake events,                        have been removed from our study for consistency. Therefore, a
which comprises the seismicity analysis in space–time volume,                        homogenous earthquake data catalog has been prepared using
seismotectonic, and seismic hazard assessment (SHA). When the                        only one magnitude type “ml” (Table 1).

Frontiers in Earth Science | www.frontiersin.org                                 9                                        March 2022 | Volume 10 | Article 851737
Ali and Abdelrahman                                                                                                  Earthquake Occurrences at Arabian Shield

  FIGURE 9 | (A–E) Magnitude histograms for the studied regions as represented by the color legend.

    The ISC bulletin is one of the main sources of data for regional                ISC considers that one of them is primary and assigns to it the
and global imaging of the Earth’s tectonics and structure, and                      PRIME flag. A hypocenter determined by the ISC always has the
seismic hazard research work. The most important feature of the                     PRIME flag. The parameters reported by the ISC are preferred
ISC bulletin is that all events with sufficient data are manually                    first. If there is no information from the ISC, the availability of the
checked and relocated by experienced analysts. Therefore, the                       hypocenter parameters from the European-Mediterranean
latest earthquake information in the database is 2 years behind in                  Seismological Centre (EMSC or CSEM) is searched (see
real-time. It also presents the event parameters reported by the                    Appendix A for the institute abbreviations). The priority of
contributor agencies and centers. The ISC finished rebuilding the                    both institutes is high because they use all available data in the
entire database in 2020 by utilizing a new location algorithm                       study area.
(Bondár and Storchak, 2011) with the ak135 seismic velocity
model (Kennett et al., 1995). Furthermore, previously unavailable
hypocenter and station phase readings from the temporary and                        7 METHODS AND DATA ANALYSIS
permanent networks are used to the rebuild bulletin (Storchak
et al., 2017; International Seismological Centre, 2021). Therefore,                 The ZMAP software package (Wiemer, 2001) available at http://
the latest, most recent, and revised international dataset is used in               www.earthquake.ethz.ch/ software/zmap has been utilized to
this study. The earthquake parameters in the bulletin are in the                    perform the statistical analyses on the compiled data set. It
IASPEI Seismic Format (available at: http://www.isc.ac.uk/                          includes a set of tools operated by a graphical user interface
standards/isf/). The overall data processing is given in the                        (GUI) and intended to help scientist in their analyses of catalog
flowchart in Figure 5. Because the bulletin may contain                              data. ZMAP is primarily a tool used to evaluate the quality of
multiple hypocenters from multiple agencies for an event, the                       catalogs and to address assumptions. It was first published in

Frontiers in Earth Science | www.frontiersin.org                               10                                     March 2022 | Volume 10 | Article 851737
Ali and Abdelrahman Earthquake Occurrences at Arabian Shield
FIGURE 10 | (A–E) Depth histograms for the studied regions as represented by the color legend.
1994 then became well known over the last few years. It includes seismic activities, i.e., the cumulative number of earthquakes
important features for the catalog quality assessment, such as plotted against time, are shown in Figure 6A. This evolution
artifacts, completeness, and contamination of explosion as well as indicates the sudden increase in the cumulative seismicity
interactive data exploration, stress tensor inversions, mapping curves of the Arabian Shield in 2004 and 2018. The a- and
transients in seismicity (b-values and rate changes) and fractal b- values, which may exhibit some differences based on the
dimension analysis. The code of ZMAP is an open source, written tectonic characteristics of the investigation area, were calculated
in Matlab by the Mathworks, which is a widely used software for the Arbian Shield using the magnitude–frequency
language in the natural sciences. The ongoing renovation process relationship (Figure 6B). The obtained a- and b-values were
of Zmap tools, which started as simple graphical retrofits, has 4.53 and 0.64, respectively. The estimated magnitude of
evolved to leverage modern MATLAB’s new graphics system, completeness for the whole catalog of the Arabian shield was
improved object-oriented capabilities, updated toolboxes, and has Mc = 2.4. The magnitude histogram (Figure 6C) shows that the
resulted in a version of ZMAP that provides vastly improved average magnitudes are between 1 and 3.4. The depth
usability, speed, and reliability. Nearly every aspect of the ZMAP distribution (Figure 6D) shows that the depths of the vast
has been modified and is now compatible with MATLAB R2018a majority of events in the catalog are between 0 and 15 km.
and later. The user interfaces have been modified to provide The seismic activities between 40 and50 km have also been
consistency and a high degree of interactivity. reported. The predominant depths are about 0–10 km. The time
The statistical analyses have been performed on the whole histogram (Figure 6E) displays the increase of seismic activity
dataset of the Arabian Shield as a one region before subdividing in 2004 and 2018–2019. There are very low activities that have
it into terranes (Figure 6). The evolutions among the levels of been noticed in the period between 2013 and 2017.
Frontiers in Earth Science | www.frontiersin.org 11 March 2022 | Volume 10 | Article 851737Ali and Abdelrahman Earthquake Occurrences at Arabian Shield
FIGURE 11 | (A–E) Time histograms for the studied regions as represented by the color legend.
In order to ensure a time-independent Poissonian (Gardner and Knopoff, 1974), which is based on a
distribution of seismicity, the earthquakes that occurred in windowing algorithm originally conceived for Southern
clusters, such as foreshocks/aftershocks sequences and California, but later adopted/modified to be used across the
swarms, are aimed to be identified and then removed from world (Uhrhammer, 1986; Stiphout et al., 2012). This method
the catalog. This process called the declustering process, in takes into consideration the tectonic context and related
which earthquake clusters are usually defined by their seismicity present in the region (active shallow, stable, and
proximity in time and space. Several approaches can be interface/inslab subduction) in order to decluster the catalog.
used for the declustering process (e.g., stochastic, The distribution of events through time and latitude showing
deterministic = linking, and windowing methods). The the foreshock, mainshock, aftershock sequences after applying
windowing methods, such as the Gardner and Knopoff the declustering for the subduction region are presented in
(1974) and Reasenberg (1985) are capable of identifying in Figure 7, together with window sizes (distance and time)
a straightforward way the foreshock/mainshock/aftershock with respect to the magnitude used by declustering methods.
sequences, simply by applying the windows forward and The declustering found a total of 759 (20.24%) clustered events
backward in time from the mainshock. These methods do out of 3,750. The map window now displays the declustered
not distinguish between different generation of aftershocks catalog containing 2,991 events as blue dots. The individual
(i.e., first generation resulting from the mainshock and those clusters are displayed as magenta pluses (Figure 7). The
associated to previous aftershocks), and it is assumed that all magnitude histogram of the declustered catalog is shown in
dependent events would occur within the window. Also, they Figure 7C. It shows a noteworthy difference from the
assumed a circular spatial window searching not full consistent magnitude histogram distributed by the data of the whole
with fault extension for larger magnitude earthquakes. We catalog (Figure 6C), which highlights the importance of the
then used the most widely applied deterministic approach declustering process.
Frontiers in Earth Science | www.frontiersin.org 12 March 2022 | Volume 10 | Article 851737Ali and Abdelrahman Earthquake Occurrences at Arabian Shield
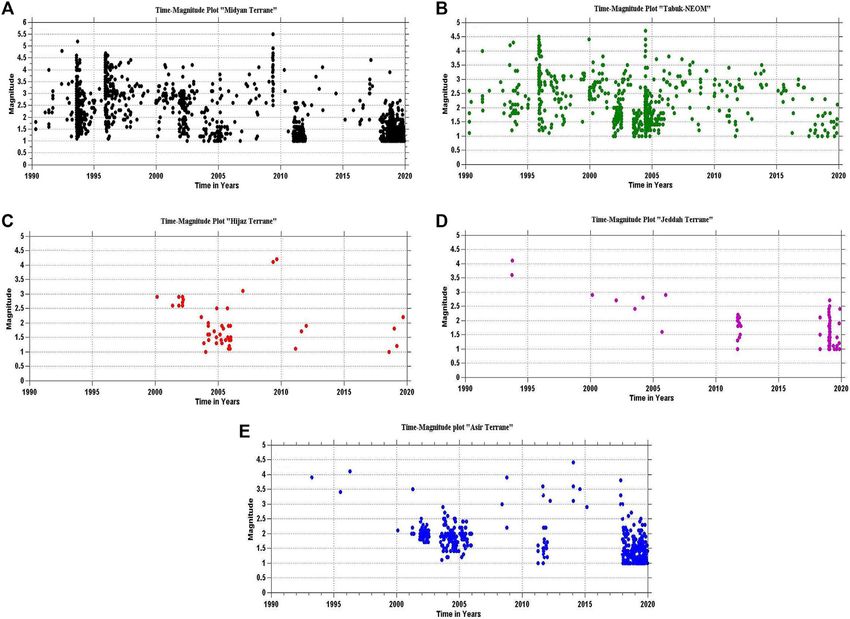
FIGURE 12 | (A–E) Time–magnitude distributions for the studied regions as represented by the color legend.
8 RESULTS investigated areas, the highest b-values are detected in the
Hijaz terrane (b = 1.04), while the lowest b-values were
The Arabian Shield has been subdivided into five regions (The recorded in the Midyan terrane (b = 0.53). A reliable estimate
Midyan terrane, the Tabuk-Neom area, the Hijaz terrane, the of Mc is to define the point of the maximum curvature as the Mc
Jeddah terrane, and the Asir terrane). The purpose of this study is by computing the maximum value of the first derivative of the
to characterize the seismic activities related to these main terrains frequency–magnitude curve. In practice, this matches the
in the Arabian Shield. Furthermore, to indicate the dominant magnitude bin with the highest frequency of events in the
tectonic regimes of the studied regions and identify their related noncumulative frequency–magnitude distribution (triangle
faulting types as well as characterize the earthquake rate changes symbols in Figure 8). Using the maximum curvature, which
and the risk of higher magnitude earthquakes related to each simply computes the maximum value of the first derivative of the
terrane and obtain some seismicity parameters [a- and b-values FMD curve, the higher Mc values of 2.3 and 2.4 are obtained at
and magnitude of completeness (Mc)] and seismic hazard the Hijaz terrane and Tabuk-Neom, respectively, while the lower
parameters (earthquake recurrence and maximum expected values of Mc are of 1.4 for Midyan and Jeddah terranes. The
magnitude) to be able to perform actions for seismic risk obtained Mc values for all studied regions are given in Table 1.
reduction in the studied region. The magnitude histograms illustrated in Figure 9 shows that
For this purpose, we estimated the parameters from the Midyan, Tabuk, and Asir Terranes have the higher seismicity at
deviation of the earthquake frequency–magnitude distribution the study area with average magnitudes of 1.0–4.1 at Midyan,
from the Gutenberg–Richter law in each region (Figure 8). The a- 1.0–3.3 at Tabuk, and 1.0–2.2 at Asir Terranes. The depth
and b-values, which may exhibit some differences based on the distributions (Figure 10) show that most earthquakes in the
tectonic characteristics of the investigation areas, were calculated catalog occurred in shallow depths. The predominant depth
for each source region along with the magnitude–frequency ranges between 0 and 15 km. Hijaz and Jeddah Terranes show
relationship (Figure 8 and Table 1). Among all the lower depth distributions. The yearly seismic rate histograms
Frontiers in Earth Science | www.frontiersin.org 13 March 2022 | Volume 10 | Article 851737Ali and Abdelrahman Earthquake Occurrences at Arabian Shield FIGURE 13 | (A–E) Annual probabilities of the earthquake activities in various levels of magnitude for the studied regions as represented by the color legend. (Figure 11) display the higher seismic activity periods in 1993, to be 6.0 for Midyan terrane, 5.4 for Tabuk-Neom, 4.7 for Hijaz terrane, 1995, 2001–2002, 2011, and 2017–2019 (Midyan), in 2005 4.8 for Jeddah terrane, and 7.7 for Asir terrane. The average recurrence (Tabuk), between 2002 and 2006 (Hijaz), in 2011 and between intervals of earthquakes with the Mmax are ~7, ~20, ~6, ~120, and 2019 and 2020 (Jeddah), and between 2001 and2006 and 2017 ~200 years for each seismic terrane, respectively. and 2020 (Asir). The Magnitude rate distribution of the earthquakes (Figure 12) reveals an important increase in the number of large magnitude earthquakes in the period between 9 DISCUSSION AND CONCLUSION 1993 and2009 in Midyan terrain, in 1996 and 2004 in Tabuk. Two events above magnitude 4.0 unlike the normal moderate activity In the context of tectonic plate movements, complex structural with magnitudes below 3.0 are recorded in Hijaz terrane. The patterns within the Arabian Plate related to the collision between same for the Jeddah terrane, where most of the seismicity are Arabian and Eurasian plates have been interpreted. The slowing below 3.0, except in 1994, where two events with magnitudes of the convergence or the onset of collision between Arabia and above 3.5 are reported. A random slight increase in magnitude is Eurasia, as well as the change in Africa–Eurasia motion may be observed at Asir terrane from time to time. reflected by a stepping of the locus of extension from the The probability of occurrence of earthquakes of various magnitudes spreading axis to off axis dikes and temporarily correlated in certain time intervals is of the highest rate in Midyan terrane and with the onset of volcanism within the western Arabian lowest in Jeddah terrane (Figure 13), while the returned periods were margin (Aldaajani et al., 2021). found to be higher in Jeddah terrane and lowest in Midyan terrane Several geophysical studies indicate that the Arabian Shield is (Figure 14). The maximum expected magnitudes (Mmax) are found an active seismic region (Al-Noury and Ali, 1986; Al-Haddad Frontiers in Earth Science | www.frontiersin.org 14 March 2022 | Volume 10 | Article 851737
Ali and Abdelrahman                                                                                                 Earthquake Occurrences at Arabian Shield

  FIGURE 14 | (A–E) The recurrence interval for all earthquake magnitudes as represented by the color legend.

et al., 1994; Al-Amri, 2013; Youssef, 2015). The rapid economic                         In order to determine the earthquake occurrences and
expansion in the region has resulted in industrial development                       earthquake recurrence characteristics in the study area, an
and intensive urbanization, with large engineering structures and                    initial earthquake dataset containing 3,750 seismic events
projects already constructed, under construction, or being                           recorded between 1941 and 2019 with magnitudes of 1.0 and
planned, such as dams for irrigation and power, desalination                         6.2 and depths between 0 and 50 km was examined. The statistical
plants, and nuclear power plants.                                                    analyses have been performed on the whole dataset and the
   The most recently compiled focal mechanism solutions of                           results demonstrate the sudden increase in the cumulative
122 earthquakes with 3.7 ≤ ml ≤ 7.1 and depth ranges between                         seismicity curves of the Arabian Shield in 2004 and 2018. The
0 and 30 km demonstrate a dominant normal faulting                                   obtained a- and b-values were 4.53 and 0.64, respectively. The
mechanism with a minor component of strike-slip motion                               estimated magnitude of completeness was Mc = 2.4. The average
and the two nodal planes trending NW-SE. This type of                                magnitudes were estimated between 1 and 3.4. The predominant
mechanism presents the tectonic movement of the region                               depths are about 0–10 km, and seismic activities in depths
and the NW-SE trend is consistent with the common                                    between 40 and 50 km with exceedingly low strain rates were
trending faults. The dominantly extensional tectonic regime                          also noticed. These activities could be within the lithospheric
with nearly horizontal NE-SW trending delineates the                                 mantle where Volcanic fields in the mantle and lower-crustal
influence of NE extension in the Red Sea. This stress system                          zones are located. An increase of seismic activity in 2004 and
reactivated the preexisting lineaments of the Najd fault system,                     2018–2019 was displayed, and very low activities were noticed in
which was active during the Precambrian, and was reactivated                         the period between2013 and 2017.
several times during the geological history of the region (Agar,                        In the current study all inadequate data of the catalog, as well
1987; Stern, 1994). The above results get on well with the                           as the aftershocks have been taken off, and each earthquake
geological observations (Roobol, 2007) that exhibit that the                         cluster has been replaced by an equivalent event using the
Red Sea passive margin is undergoing extension by rotational                         declustering technique represented by Gardner and Knopoff
normal faulting dipping both toward and away from the Red                            (1974). Finally, a declustered earthquake catalog includes 2,991
Sea that cause thinning of the Arabian Shield.                                       earthquakes has been used to characterize the seismicity of the

Frontiers in Earth Science | www.frontiersin.org                                15                                   March 2022 | Volume 10 | Article 851737
Ali and Abdelrahman                                                                                                           Earthquake Occurrences at Arabian Shield

study area. Keeping in view the prevalent tectonics and the                             and Tabuk-Neom are with higher values, where the station
geological, geophysical, and seismological data, the study area                         distribution is very poor.
is represented by five zones (terranes) include Midyan terrane,                             The probability of occurrence and return periods for
Tabuk-Neom, Hijaz terrane, Jeddah terrane and Asir terrane.                             earthquakes of various magnitudes in each terrane indicate
    The distributions of spatial magnitudes along the study area                        that the regions related to the Najd strike-slip fault system are
denote higher seismic activity records at the northwestern part of                      probably the regions for large earthquake occurrences.
Arabian Shield, especially at Midyan and Tabuk-Neom with                                   The results of the current study demonstrate the influence of
average magnitudes of 1.0–4.1 and 1.0–3.3, respectively, as                             tectonic activities, geodynamic processes, thickness of the
well as at the southeastern Saudi Arabia at Asir terrane with                           crust, the active volcanic field in the lithospheric mantle,
an average magnitude of 1.0–2.2. Low seismic activities have been                       and the multiple directions of the faults and their densities
observed at Hijaz and Jeddah terranes. The temporal migrations                          and stresses on the locations and depths of the seismic activities
of seismicity along the depth axis indicate that the seismic activity                   in each terrane of the Arabian Shield. These results are
of the study area is concentrated in the upper crust zone in a                          consistent with the previous studies that have been done in
shallow depth between 0 and 15 km.                                                      the study area and surrounding regions, such as Al-Amri et al.,
    In the current study, the maximum likelihood technique was                          2004; El-Hadidy et al., 2015; Zahran et al., 2016; Alzahrani
applied to specify the seismicity of the areas under study and to                       et al., 2022.
calculate their associated seismicity parameters [Gutenberg–Richter
(GR) recurrence parameters (a- and b-values) and the Magnitudes
of completeness (Mc)]. Compared with the least-square regression                        DATA AVAILABILITY STATEMENT
method, this method gives more reasonable results (Aki, 1965). The
ZMAP software has been used to compute Mc, a- and b-values. The                         The original contributions presented in the study are included in
results showed that the a-values varied between 2.70 and 4.35, and                      the article/Supplementary Material. Further inquiries can be
the b-values varied between 0.50 and 1.04.                                              directed to the corresponding author.
    The variations of the defined a- and b- values through the
study regions not only reflect the geodynamic processes such
as seafloor spreading and continental rift but also assess the                           AUTHOR CONTRIBUTIONS
seismic hazard that threatens the megaprojects in the regions
such as the Red Sea Development and Neom. The highest                                   SA gathered, retrieved, processed, analyzed, and interpreted the
b-value was determined in the Hijaz terrane (b = 1.04), which                           data, created and edited the figures, and was a contributor in
suggests that it is associated with a decreased risk of higher                          writing and editing the manuscript. KA brought the idea of the
magnitude earthquakes. The lowest b-value was estimated in                              research, gathered the structure, tectonic, and seismicity of the
the Midyan terrane (b = 0.53) that indicates the higher risk of                         study area, plotted the study region map, and was a contributor in
larger magnitude earthquakes. Since b-value is inversely                                writing and editing the manuscript. All authors read and
related to stress (Woessner and Wiemer, 2005), so the                                   approved the final version of the manuscript.
Hijaz terrane is associated with low stress regime. This
indicates the faults of this source zone are capable to
generate numerous smaller magnitude earthquakes of short                                FUNDING
return periods, which agrees with the estimated maximum
magnitude of ml = 4.7. In contrast, the Midyan terrane                                  This study was financed by the Researchers Supporting Project
indicates high stress regime that may have high hazard of                               number (RSP-2021/351), King Saud University, Riyadh, Saudi
large magnitude earthquakes of large return periods, which is                           Arabia. Funds are received for open access publication fees.
confirmed by the estimated maximum magnitude of ml = 6.0.
The higher Mc values of 2.3 and 2.4 are obtained at the Hijaz
terrane and Tabuk-Neom, respectively, while the lower values                            ACKNOWLEDGMENTS
of Mc are of 1.4 for Midyan and Jeddah terranes. The lower
value of Mc at the Midyan terrane demonstrates appropriate                              Sincere thanks and gratitude to the Researchers Supporting
station distribution and high earthquake rates. However, at                             Project number (RSP-2021/351), King Saud University,
the Jeddah terrane the seismic activities are poorly detected                           Riyadh, Saudi Arabia, for funding this research article. The
(with only 68 events over magnitude 1.0) that probably leads                            authors are grateful to the reviewers and the handling editor for
to the small value of Mc. Mc thresholds in the Hijaz terrane                            their constructive comments and suggestions.

                                                                                        Aki, K. (1965). Maximum Likelihood Estimates of B in the Formula Log N=a-
REFERENCES                                                                                 bM and its Confidence Limits. Bull. Earthq. Res. Inst. Univ. Tokyo 43,
                                                                                           237–239.
Agar, R. A. (1987). The Najd Fault System Revisited; a Two-Way Strike-Slip              Al-Amri, A. M., Punsslan, B. T., Khalil, A., and Uy, E. A. (2004). Seismic hazard
  Orogen in the Saudi Arabian Shield. J. Struct. Geology. 9, 41–48. doi:10.1016/           Assessment of Western Saudi Arabia and the Red Sea Region. Japan: IISEE,
  0191-8141(87)90042-3                                                                     95–112.

Frontiers in Earth Science | www.frontiersin.org                                   16                                          March 2022 | Volume 10 | Article 851737
Ali and Abdelrahman Earthquake Occurrences at Arabian Shield
Al-Amri, A. M. (2013). “Seismotectonics and Seismogenic Source Zones of the Frankel, A. (1995). Mapping Seismic hazard in the Central and Eastern
Arabian Platform,” in Lithosphere Dynamics and Sedimentary Basins: The United States. Seismol. Res. Lett. 66 (4), 8–21. doi:10.1785/gssrl.66.4.8
Arabian Plate and Analogues. Editors K. Al Hosani, F. Roure, R. Ellison, Frohlich, C., Gan, W., and Herrmann, R. B. (2015). Two Deep Earthquakes in
and S. Lokier (Springer Frontiers in Earth Sciences), 295–316. doi:10.1007/978- Wyoming. Seismol. Res. Lett. 86, 810–818. doi:10.1785/0220140197
3-642-30609-9-1510.1007/978-3-642-30609-9_15 Gardner, J. K., and Knopoff, L. (1974). Is the Sequence of Earthquakes in Southern
Al-Haddad, M., Siddiqi, G. H., Al-Zaid, R., Arafah, A., Necioglu, A., and California, with Aftershocks Removed, Poissonian? Bull. Seismol. Soc. Am. 64
Turkelli, N. (1994). A Basis for Evaluation of Seismic hazard and Design (5), 1363–1367. doi:10.1785/bssa0640051363
Criteria for Saudi Arabia. Earthquake Spectra 10, 231–258. doi:10.1193/1. Genna, A., Nehlig, P., Le Goff, E., Guerrot, C., and Shanti, M. (2002). Proterozoic
1585773 Tectonism of the Arabian Shield. Precambr. Res. 117, 21–40. doi:10.1016/s0301-
Al-Malki, M. A., and Al-Amri, A. M. (2013). “Seismic Zones Regionalization and 9268(02)00061-x
hazard Assessment of SW Arabian Shield and Southern Red Sea Region,” in Ghebreab, W. (1998). Tectonics of the Red Sea Region Reassessed. Earth Sci. Rev.
Lithosphere Dynamics and Sedimentary Basins: The Arabian Plate and 45, 1–44. doi:10.1016/S0012-8252(98)00036-1
Analogues (Springer), 317–331. doi:10.1007/978-3-642-30609-9_16 Girdler, R. W. (1991). The Afro-Arabian Rift System-An Overview. Tectonophysics
Al-Noury, S., and Ali, S. (1986). Seismic Risk Analysis of Western Arabia. Eng. 197, 139–153. doi:10.1016/0040-1951(91)90038-t
Geology. 23, 95–108. doi:10.1016/0013-7952(86)90032-3 Gutenberg, R., and Richter, C. F. (1944). Earthquake Magnitude, Intensity, Energy,
Aldaajani, T. Z., Almalki, K. A., and Betts, P. G. (2021). Plume versus Slab-Pull: and Acceleration. Bull. Seismol Soc. Am. 32, 163–191.
Example from the Arabian Plate. Front. Earth Sci. 9, 494. doi:10.3389/feart. Hafiez, H. E. A., and Toni, M. (2020). Magnitude of Completeness for the Northern
2021.700550 Stations of the Egyptian National Seismological Network. Arab J. Geosci. 13
Ali, S. M., and Akkoyunlu, M. F. (2022). Statistical Analysis of Earthquake Catalogs (12), 458–461. doi:10.1007/s12517-020-05461-0
for Seismic hazard Studies Around the Karliova Triple Junction (Eastern International Seismological Centre (ISC) (2021). On-line Bulletin. Available at:
Turkey). J. Afr. Earth Sci. 186, 104436. doi:10.1016/j.jafrearsci.2021.104436 http://www.isc.ac.uk/iscbulletin/search/catalogue/. doi:10.31905/D808B830
Ali, S. M., and Shanker, D. (2017). Study of Seismicity in the NW Himalaya and Jamali, F., Aghda, S. M. F., and Aliyari, A. (2006). Evaluation of Seismic Sources for
Adjoining Regions Using IMS Network. J. Seismol. 21, 317–334. doi:10.1007/ hazard Assessment in the Fujairah Emirate (UAE). London, UK: The Geological
s10950-016-9603-7 Society of London. IAEG2006, 305 (1–6).
Ali, S. M. (2016). Statistical Analysis of Seismicity in Egypt and its Surroundings. Johnson, P. R. (1998). Tectonic Map of Saudi Arabia and Adjacent areasMinistry of
Arab J. Geosci. 9, 52. doi:10.1007/s12517-015-2079-x Petroleum and Mineral Resources. Jiddah, Saudi Arabia: Deputy Ministry for
Alzahrani, H., Abdelrahman, K., Qaysi, S., and Baras, M. (2022). Seismicity of the Mineral Resources. Technical Report USGS TR-98-3 (IR 948).
Neom Megaproject Area, Northwestern Saudi Arabia. J. King Saud Univ. - Sci. Kennett, B. L. N., Engdahl, E. R., and Buland, R. (1995). Constraints on Seismic
34, 101659. doi:10.1016/j.jksus.2021.101659 Velocities in the Earth from Traveltimes. Geophys. J. Int. 122, 108–124. doi:10.
Ambraseys, N. N., and Adams, R. D. (1988). The Seismicity of Saudi Arabia and 1111/j.1365-246x.1995.tb03540.x
Adjacent Areas: Part B. ICST/ KACST Project. ESEE Rep. no. 88/11. London: Kijko, A. (2004). Estimation of the Maximum Earthquake Magnitude, M max. Pure
Dept. of Civil Engineering, Imperial College of Science and Technology. Appl. Geophys. 161, 1655–1681. doi:10.1007/s00024-004-2531-4
Ambraseys, N. N., Melville, C. P., and Adams, R. D. (1994). The Seismicity of Egypt, Klinger, Y., Rivera, L., Haessler, H., and Maurin, J.-C. (1999). Active Faulting in the
Arabia and the Red Sea: A Historical Review. Cambridge: Cambridge University Gulf of Aqaba: New Knowledge from the Mw 7.3 Earthquake of 22 November
Press. 1995. Bull. Seismol Soc. Am. 89, 1025–1036. doi:10.1785/bssa0890041025
Ambraseys, N. N., and Melville, C. P. (1989). Evidence for Intraplate Earthquakes Kröner, A. (1985). Ophiolites and the Evolution of Tectonic Boundaries in the Late
in Northwestern Arabia. Bull. Seism Soc. Am. 79, 1279–1281. Proterozoic Arabian-Nubian Shield of Northeast Africa and Arabia. Precambr.
Ambraseys, N. N., and Melville, C. P. (1988). The Seismicity of Saudi Arabia and Res. 27, 277–300. doi:10.1016/0301-9268(85)90016-6
Adjacent Areas: Part A. ICST/ KACST Project. ESEE Rep. no. 88/11. London: Leonard, T., Papasouliotis, O., and Main, I. G. (2001). A Poisson Model for
Dept. of Civil Engineering, Imperial College of Science and Technology. Identifying Characteristic Size Effects in Frequency Data: Application to
ArRajehi, A., McClusky, S., Reilinger, R., Daoud, M., Alchalbi, A., Ergintav, S., et al. Frequency-Size Distributions for Global Earthquakes, "starquakes", and Fault
(2010). Geodetic Constraints on Present-Day Motion of the Arabian Plate: Lengths. J. Geophys. Res. 106 (B7), 13473–13484. doi:10.1029/2000jb900429
Implications for Red Sea and Gulf of Aden Rifting. Tectonics 29 (3), TC3011 Manakou, M. V., and Tsapanos, T. M. (2000). Seismicity and Seismic hazard
(1–10). doi:10.1029/2009tc002482 Parameters Evaluation in the Island of Crete and the Surrounding Area Inferred
Beydoun, Z. R. (1999). Evolution and Development of the Levant (Dead Sea Rift) from Mixed Data Files. Tectonophysics 321, 157–178. doi:10.1016/s0040-
Transform System: A Historical-Chronological Review of a Structural 1951(00)00075-5
Controversy. Geol. Soc. Lond. Spec. Publ. 164 (1), 239–255. doi:10.1144/gsl. Michael, A. J. (2014). How Complete Is the ISC-GEM Global Earthquake Catalog?
sp.1999.164.01.12 Bull. Seismol. Soc. Am. 104, 1829–1837. doi:10.1785/0120130227
Bondár, I., and Storchak, D. (2011). Improved Location Procedures at the Mignan, A., Werner, M. J., Wiemer, S., Chen, C. C., and Wu, Y. M. (2011). Bayesian
International Seismological Centre. Geophys. J. Int. 186, 1220–1244. doi:10. Estimation of the Spatially Varying Completeness Magnitude of Earthquake
1111/j.1365-246X.2011.05107.x Catalogs. Bull. Seismol. Soc. Am. 101, 1371–1385. doi:10.1785/0120100223
Brown, G. F. (1970). A Discussion on the Structure and Evolution of the Red Sea Mignan, A., and Woessner, J. (2012). Estimating the Magnitude of Completeness for
and the Nature of the Red Sea, Gulf of Aden and Ethiopia Rift junction - Eastern Earthquake Catalogs. Community Online Resource for Statistical Seismicity
Margin of the Red Sea and the Coastal Structures in Saudi Arabia. Phil. Trans. R. Analysis. ETH Zurich: Swiss Seismological Service, 45. Available at: http://www.
Soc. Lond. A. 267, 75–87. doi:10.1098/rsta.1970.0024 corssa.org. doi:10.5078/corssa-00180805
Davidson, I., Al-Kadasi, M., Al-Kihrbash, A., Baker, J., Blakey, S., Bosence, D., et al. Mogi, K. (1962). Magnitude–frequency Relationship for Elastic Shocks
(1994). Structural Evolution of the southeastern Red Sea Margin, Republic of Accompanying Fractures of Various Materials and Some Related Problems
Yemen. Geol. Soc. Am. Bull. 106, 1474–1493. in Earthquakes. Bull. Earthq Res. Inst. Univ. Tokyo 40, 831–883.
Efron, B. (1979). Bootstrap Methods: Another Look at the Jackknife. Ann. Statist. 7, Petersen, M. D., Bryant, W. A., Cramer, C. H., Cao, T., Reichle, N. S., Frankel, A. D.,
1–26. doi:10.1214/aos/1176344552 et al. (1996). Probabilistic Seismic hazard Assessment for the State of California.
El-Hadidy, S. Y., Zahran, H. M., El-Hadidy, M., and Sami, M. (2015). “Seismicity Open-File Report 96–08, USGS Open File Report 96–706. California, USA:
and Seismotectonic Settings of Western Saudi Arabia with Special Emphasis of California Dept. of Conservation Division of Mines and Geology. doi:10.3133/
5.1 Baish-Jizan Earthquake 2014,” in Workshop on Imaging and Active ofr96706
Tectonics of the Red Sea Region, Kingdom of Saudi Arabia, March 10-13, Prieto, G. A., Froment, B., Yu, C., Poli, P., and Abercrombie, R. (2017). Earthquake
2015 (King Abdulaziz University of Science and Technology KAUST). Rupture below the Brittle-Ductile Transition in continental Lithospheric
El-Isa, Z. H., and Shanti, A. A. (1989). Seismicity and Tectonics of the Red Sea and Mantle. Sci. Adv. 3, e1602642. doi:10.1126/sciadv.1602642
Western Arabia. Geophys. J. 97, 449–457. doi:10.1111/j.1365-246x.1989. Reasenberg, P. (1985). Second-order Moment of central California Seismicity,
tb00515.x 1969-1982. J. Geophys. Res. 90, 5479–5495. doi:10.1029/jb090ib07p05479
Frontiers in Earth Science | www.frontiersin.org 17 March 2022 | Volume 10 | Article 851737You can also read