Dynamic of the vegetation and climatic variables in Dimbokro Department, Central Côte d'Ivoire
←
→
Page content transcription
If your browser does not render page correctly, please read the page content below

Science de la vie, de la terre et agronomie                                 REV. RAMRES - VOL.09 NUM.02 2021** ISSN 2424-7235

Dynamic of the vegetation and climatic variables in Dimbokro Department, Central Côte d'Ivoire

                     Rita Massa Biagne1*, Anthelme Gnagbo2 and François N’Guessan Kouame3
Abstract
The combined effects of both temperature increasing and human activities intensification in the tropics have a direct consequence as the
perturbation on the natural vegetation cover. In order to better understand this process, the present study was undertaken in Dimbokro
Department through a mapping and analysis of the spatial and temporal evolution of land cover types based on 29 years period (1988-2017)
satellite images (Landsat 4 TM and Landsat 8 OLI/TIRS). A diachronic analysis of satellite data and a supervised classification using OLI
5/6/4 colorful compositions allowed a better discrimination of the land use types. The forests of plateaus, the riparian forests and the nude
soils or localities decreased in area, while the shrubby savannas, the forests plantations and the fallows or crops lands increased in area.
The overall accuracies for the classified images were 96.76% (1988) and 97.70% (2017), while the Kappa coefficients were estimated at
0.96 (1988) and 0.97 (2017). The riparian forests and the nude soils or localities were the land use types that have lost the most area with
respective rates of change of -30.36% and -47.45%.
Key words: West Africa, satellite images, temperature, spatio-temporal evolution, land uses.

Résumé
The combined effects of both temperature increasing and human activities intensification in the tropics have a direct consequence
as the perturbation on the natural vegetation cover. In order to better understand this process, the present study was undertaken
in Dimbokro Department through a mapping and analysis of the spatial and temporal evolution of land cover types based on 29
years period (1988-2017) satellite images (Landsat 4 TM and Landsat 8 OLI/TIRS). A diachronic analysis of satellite data and a
supervised classification using OLI 5/6/4 colorful compositions allowed a better discrimination of the land use types. The forests of
plateaus, the riparian forests and the nude soils or localities decreased in area, while the shrubby savannas, the forests plantations and
the fallows or crops lands increased in area. The overall accuracies for the classified images were 96.76% (1988) and 97.70% (2017),
while the Kappa coefficients were estimated at 0.96 (1988) and 0.97 (2017). The riparian forests and the nude soils or localities were
the land use types that have lost the most area with respective rates of change of -30.36% and -47.45%.
Key words: West Africa, satellite images, temperature, spatio-temporal evolution, land uses.

1. Centre d’Excellence Africain sur le Changement Climatique, la            3. UFR des Sciences de la Nature, Pôle de Recherche Environnement et
Biodiversité et l’Agriculture Durable, Université Félix Houphouët-Boigny,   Développement Durable, Biodiversité et Ecologie végétale, Université
01 BP V34 Abidjan 01, Côte d’Ivoire. Email: biagnemassarita@gmail.com       Nangui Abrogoua, 31 BP 165 Abidjan 31, Côte d’Ivoire. Email:
2. UFR Agroforesterie, Université Jean Lorougnon-Guedé, BP 150 Daloa        fnkouame3@gmail.com
and Centre Suisse de Recherches Scientifiques, Direction de la Recherche    *Author for correspondence: Rita Massa BIAGNE. Phone (+225) 48332641.
et du Développement, 01 BP 1303 Abidjan 01, Côte d'Ivoire. Email:           Email: biagnemassarita@gmail.com
agnagbo@gmail.com

1. INTRODUCTION                                                             geographical coordinates and climatic factors (Parmentier et
Archaeological researches showed that prehistoric man                       al. 2007, 2011). This study aims to assess the remaining forest
already exploited his environment (Eggert 1993). But during                 cover in the Department of Dimbokro in order to ensure
the recent decades, the natural vegetation is disappearing very             better protection However, the different types of biotopes
quickly (Spichiger et al. 2000) under a high human pressure                 found in the Department of Dimbokro are undergoing a
in the Tropics (Bamba et al. 2008; Ouédraogo et al. 2009).                  modification of the vegetation cover in time and space as a
Various human activities including agriculture and forest                   result of anthropic pressures. This manuscript describes the
logging that involve heavy machineries and chemical products,               evolution of the land use types between 1988 and 2017 as a
hunting, water flows, bush fire, vegetation clearance for cities            response to the local temperature increasing and the human
and non-timber forest products (Kouamé 2016) led to a deep                  pressure in Dimbokro which is one of the hottest areas of
modification of the natural environment. Consecutively there                Côte d’Ivoire (Brou et al. 2005). The objective of this study
is the current decreasing of natural vegetation area (Kouamé                is to characterize the spatio-temporal dynamics of land use
and Zoro Bi 2010) and impoverishment of the original flora                  types in Dimbokro from 1988 to 2017, given that temperature
and the soil fertility (Guillaumet et al. 1971). Unfortunately, in          increasing in this forest-savanna contact zone can strongly
most tropical countries, and especially in Africa, the derived              alter the dynamics of forests and other ecosystems in many
savannas occupy very large areas nowadays. Some authors                     ways (Mortsch 2006). We therefore hypothesised that land
including Spichiger et al. (2000) attribute the replacement of              use types would show different responses to human activities
tropical rainforest by the derived savannas to climate change.              and temperature variation in Dimbokro Department.
These two phenomena seem to be interconnected since
massive deforestation in the Tropics also affects the regional
climate (Parmentier et al. 2007). The natural distribution of
vegetation main types in the Tropical Africa follows both
                                                                                                                                          81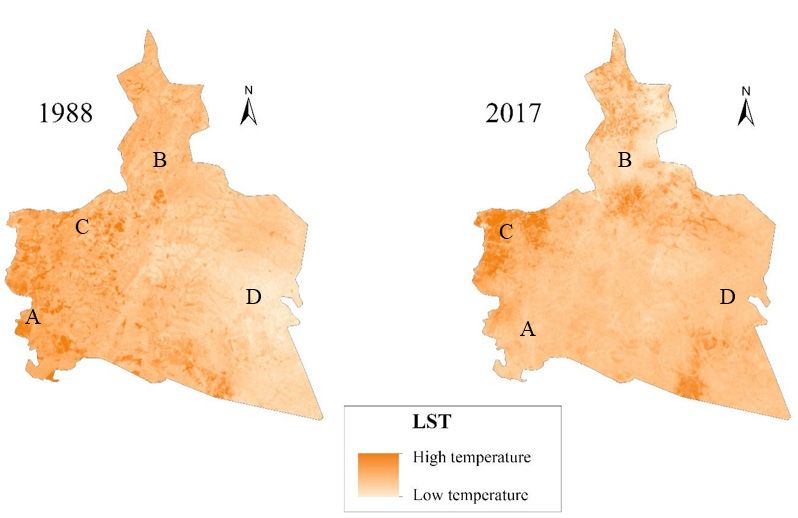
REV. RAMRES - VOL.09 NUM.02. 2021** ISSN 2424-7235 Science de la vie, de la terre et agronomie
2. Materials and methods
afrique/cote-d-ivoire/lacs/dimbokro-58625
Table I. Monthly temperatures and rainfall in Dimbokro Department from 1982 to 2012. Source : fr.climate-data.org/
Precipitations (mm)
Maximal temperature (°C)
Minimal temperature (°C)
Mean temperature (°C)
Climatic factors/Months
2.1. Study zone
The Department of Dimbokro is located in the centre-eastern
part of Côte d'Ivoire (Figure 1). Dimbokro town is the main
city of the N'Zi Administrative Region which is bordered in
the North by Bocanda area, in the South by Tiémélékro area,
in the East by Bongouanou area and in the West by Toumodi
and Yamoussoukro areas (Figure 1). Its geographical area
extends between 6°37' and 6°47' North latitude and between
4°38' and 4°45' West longitude and covers an area of 161.9
km² (Figure 1).
11
33.7
20.4
27
January
50
35.4
22.7
29
February
111
34.9
23.2
29
March
130
34.4
23.3
28.8
April
150
33.5
23.1
28.3
May
188 104 71
31.6 30.2 29.9
22.5 22 21.9
27 26.1 25.9
June July August
Weiss M., Jacob F. and Duveiller G., (2020). Remote sensing for agricultural
applications: A meta-review. Remote Sensing of Environment, 236, 111-122.
Zhu X.X., Tuia D., Mou L., Xia G.-S., Zhang L., Xu F. and Fraundorfer F., (2017).
Deep learning in remote sensing: A comprehensive review and list of resources.
IEEE Geoscience and Remote Sensing Magazine, 5(4), 8-36.
132
30.9
22.1
26.5
September
Figure 1. Location and presentation of the Dimbokro Department.
The relief is not very rugged and shows an overall monotony
with low hills (Avenard 1971). The soils are mostly ferralitic
116
31.8
22.3
27
October
(Perraud 1971). The hydrographic network is composed of the
N'Zi, Agnéby, Comoé rivers and their tributaries (Guillaumet
et al. 1971). Annual minimum and maximum temperatures
changed respectively from 23 and 32.5 in 1979 to 23.2 and
52
32.7
22.3
27.5
November
34.8 in 2019. The monthly temperatures over these 40 last
years showed 20.4-23.3 °C minimal temperature, 29.9-35.4
°C maximum temperature and 25.9-29 °C mean temperature
(Table I). The monthly rainfall for the same period varied from
20
32.1
21
26.5
December
11 to 200 mm (Table I), while the sunshine mean duration
was set between 3 and 7 hours per day.
2.2. Methods for mapping the current land cover
on the processing of Landsat data (2017 and eventually 1988)
The mapping process included three main successive phases and was supplemented by the ad hoc acquisition of data
which consisted of the classification of satellite images, the from other satellites (SPOT, IKONOS, Quickbird, etc.) from
validation of this classification and the characterization of recent archives when Landsat data were unavailable or of
land cover dynamics. poor quality. The shape files of the administrative boundaries,
Two Landsat satellite images (TM of 24 December 1988 hydrographic network as well as communication roads were
and OLI/TIR of 14 January 2017) covering scene 196/055 downloaded online from https://www.openstreetmap.org
were downloaded from the http:earthexplorer.usgs.gov website.
website. All the images were taken during the dry season to Four field trips using a GPS were necessary to validate the
avoid the clouds and a comparison of images from different classification. The vegetation cover changes during these
seasons which could lead to non-comparable results (Noyola- 29 years were raised up following the requirement of 10
Medrano et al. 2008; Kpedenou et al. 2016). The WGS 84 years minimum to better perceive changes in the vegetation
system with the UTM 30 North projection for georeferencing (Lambert 2012).
the images were used. The mapping methodology was based
82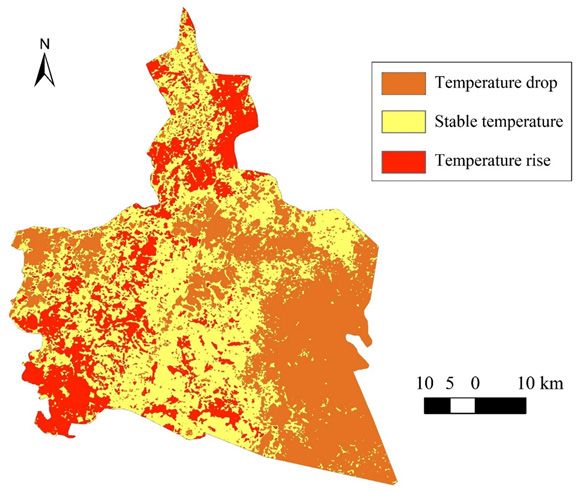
Science de la vie, de la terre et agronomie                         REV. RAMRES - VOL.09 NUM.02 2021** ISSN 2424-7235

                                                                    (Denis 2013) calculated through the following formula:
2.3. Digital image processing by calculating spectral                NDVI = (PIR-Red) / (PIR+Red)                    Equation (5)
    indices
                                                                    where PIR: near-infrared canal et R: red canal.
The process of images digital classification involved the
                                                                    2.3.3. Detecting change by Normalized Difference floor gloss Index
choice of the colorful compositions and of the classification
algorithm. The unsupervised classification was maintained           As the previous indices, the Normalized Difference floor gloss
when it corresponded to the field observations. After the           Index (NDBI) of Crist and Cicone (1984) was calculated to
classification validation, a 3x3 median filter reduced the intra-   detect changes in the area covered by the floor between 1988
class heterogeneity by deleting isolated pixels. The variations     and 2017. This index uses the infrared (PIR) and mid-infrared
of land cover types along time were analysed using ArcGIS           (MIR) canals to highlight the settlements.
9.2 and Envi 5 software following Schlaepfer (2002). The
                                                                    NDBI = (MIR−PIR) / (MIR+PIR)                       Equation (6)
Kappa coefficient which establishes a relationship between
a map and the ground reality was calculated and a confusion         The positive values (light colors) of this index correspond
matrix showing the error levels in the allocation of pixels         to the presence of nude soils, and the negative values (dark
between the different classes (Godard 2005) was analysed.           colors) indicate a vegetation.
2.3.1. Detection of change by the Ground Surface Temperature
The Ground Surface Temperature (GST) was calculated to              2.3.4. Colorful compositions
detect the rates of change at the ground surface between 1988       The colorful compositions was achieved by combining
and 2017. This temperature was obtained by Planck's law             information from three spectral bands of a satellite sensor and
conversion of luminance in the thermal infrared, which was          displaying it simultaneously in the three primary colors (red,
then corrected for emissivity effects using the Temperature         green and blue). These colorful compositions was created in
Independent Spectral Indices of Emissivity (TISIE) model            order to obtain a good visualization of the different types of
(Li and Becker 1993; Wan and Li 1997). GTS is regulated by          plant formations. Thus, the creation of colorful compositions
vegetation and is determined from the relationship between          was exported into a Geographic Information System database
the gloss temperature and the surface emissivity (Williams          type for the preparation of field sites to be visited and for the
and Smith 1990; Prata et al. 1995).                                 characterization of land use types.
                                                                    2.3.5. Validation of the classification
  GTS = TB/ (1 + (λ TB/ ρ) lnε                   Equation (1)
                                                                    The validation of the satellite images consisted into the
 TB = K2 / (ln(K1/ Lλ + 1))                     Equation (2)        comparison of the image classes resulting from the different
with :                                                              spectral signatures of the satellite images to the field data. The
  ρ = h × c / σ (1.438 × 10⁻² m K)               Equation (3)       different land use types in the study area were georeferenced
                                                                    during a week field trip through 43 local points. These
                                                                    georeferenced local points were digitized with ArcGIS 9.2
Where GTS: ground surface temperature (in Kelvin converted          software to be compared to the classes from the Landsat images
into degree Celsius), TB: gloss temperature (in Kelvin); K1         preprocessing as well like in numerous remote sensing studies
and K2: constants applied for Landsat OLI/TIRS, Lλ: spectral        (Zhu et al. 2017, Ma et al. 2019, Wang and Gamon 2019, Cheng
radiance at sensor aperture, λ: wavelength of emitted radiation     et al. 2020, Weiss et al. 2020). A supervised classification was
(11.5 μm), σ: Stefan Boltzmann constant (1.38 × 10⁻²³J K-1),        carried out by comparing the training points from the image
h: Planck constant (6.26 × 10⁻³⁴ J s), c: speed of light (2.998     to the control points from the field. The produced map is
× 108 m / s), and ε: emissivity.                                    accompanied by a Kappa coefficient and a confusion matrix.
                                                                    The Kappa coefficient establishes a relationship between the
GTS is the using the fraction of Plant Cover (CV) described
                                                                    produced map and the field reality. The higher coefficient means
by Valor and Caselles (1996) and calculated as follows:
                                                                    the map is much closed to the truth on the field (De Raadt et
CV = (NDVI – NDVImin)² / (NDVImax – NDVImin)²                       al. 2019, Foody 2020). The confusion matrix shows the levels
                                                                    of error in the allocation of pixels between the different classes
                                                                    (Godard 2005, Ruuska et al. 2018).
                                                Equation (4)
                                                                    2.3.6. Spatial and temporal analysis of the land use types
where NDVI was Normalized Difference Vegetation Index
                                                                    The combination of spatial and temporal components in
2.3.2. Detection of change by the NDVI                              remote sensing consisted in determining the rate of land cover
                                                                    change calculated between 1988 and 2017, and generating
The rate of change in vegetation cover was calculated using the
                                                                    the change map for the evolution of land cover types. In order
NDVI, which characterizes the leaf biomass of the vegetation
                                                                    to facilitate and synthesize the analysis of the global evolution
cover over time (Vancutsem et al. 2006) between the Near
                                                                    of land use, seven land use units as riparian forests, forests
Infrared and the Red canals. Denis (2013) set the NDVI
                                                                    of plateau, plantations forest, woody savannas, shrubby
values for satellite images at close to 0 for open water surface,
                                                                    savannas, fallow or crops lands and nude soils or localities
at 0.1-0.2 for nude soil and at 0.5-0.8 for dense vegetation.
                                                                    were monitored from 1988 and 2017 photos. A transition
The NDVI is directly related to the photosynthetic activity of
                                                                    matrix between 1988 and 2017 let to detect the slightest
plants and therefore to the energy absorption capacity of the
                                                                    changes as an increase, a decrease or a stability in the land use
canopy; it becomes an indicator of plants chlorophyll biomass
                                                                    types. A positive change in land cover corresponds to a gain
                                                                                                                               83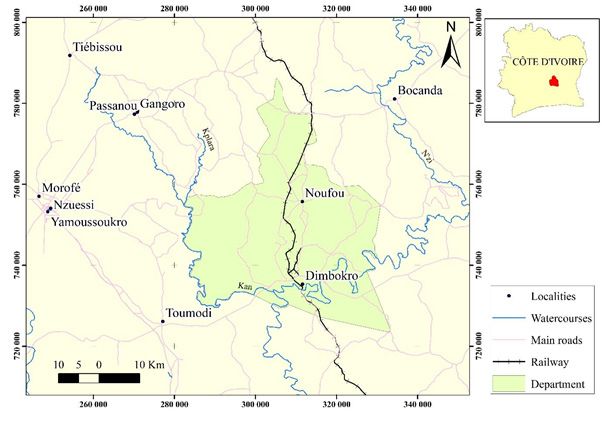
REV. RAMRES - VOL.09 NUM.02. 2021** ISSN 2424-7235                     Science de la vie, de la terre et agronomie

in land cover, while the negative change corresponds to a loss
of coverage. Thus, to find the rate of change in temperature,
chlorophyll activity, water surfaces and vegetation cover, a
subtraction was made between progression and regression for
each index. Finally, the rate of change (Tc) in land cover was
calculated between 1988 and 2017 as described by Toyi et al.
(2013) using the following formula:

  Tc = (A2 – A1/A1) x 100                         Equation (7)

where A1 and A2 were the initial and final area of the land use
type, respectively.
3. RESULTS                                                         Figure 4. Temperature evolution between 1988 and 2017 in
                                                                   Dimbokro Department
3.1. types of land use in dimbokro county
3.1.1. ground surface temperature
                                                                   3.1.2. Vegetation index by normalized difference or Tucker index
the dark red coloration on the gst image corresponding to the
higher temperature surface moved from the south-western part       The highest chlorophyll activity in 1988 was recorded in the
of the study area (figure 2 zone a) in 1988 to the north-western   Eastern zone (Figure 5 zone D), while the lowest chlorophyll
(figure 2 zone c) in 2017. the orange-yellowish coloration         activity was reported in Western zone (Figure 5 zone A).
expressing lower temperature moved from the south-eastern          In 2017, the Eastern zone showed the highest chlorophyll
of the dimbokro department (figure 2 zone d) in 1988 to the        activity (Figure 5 zone D), while the lowest chlorophyll
northern (figure 2 zone c) in 2017.                                activity was extended from the Western to the Central and
                                                                   Northern zones (Figure 5 zones A, B, C). In terms of the
the evolution of the temperature in dimbokro department            chlorophyll level evolution from 1988 to 2017 in Dimbokro
between 1988 and 2017 (figures 3 & 4) showed a rise in             Department, the overall tendency was a stability on 82 %
temperature in both the south-western and northern zones. the      of the Department (Figures 6 & 7). The 8% change was a
eastern-north and western zones showed a drop in temperature,      decrease of the chlorophyll level on 85.11 km² mainly in the
while the centre of dimbokro department expressed mainly a         Western zone and an increase on 214.41 km² mainly in both
stable temperature between 1988 and 2017 (figures 3 & 4).          Eastern-north and Eastern-south zones (Figures 6 & 7).

                                                                   3.1.3. Normalized Difference Soil Brilliance Index
                                                                   The evolution of the NDBI from 1988 to 2017 showed the
                                                                   highest values in the Eastern zone, while the lowest values
                                                                   were found in the Western zone (Figures 8 & 9). But there
                                                                   was a slight decrease of the NDBI in the Northern, Central
                                                                   and Eastern zones during that period. In terms of the NDBI
                                                                   change spectrum between 1988 and 2017, the Department
                                                                   experienced 37.73% of change, which was a loss of 613.92
                                                                   km² and an extension of 6.38 km² (Figures 8 & 9).

  Figure 2. Evolution of the ground surface temperature
  between 1988 and 2017 in Dimbokro Department

                                                                   Figure 5. Evolution of the chlorophyll activity between 1988
                                                                   and 2017 in Dimbokro Department

  Figure 3. Evolution of the ground surface temperature
  between 1988 and 2017 in Dimbokro Department

   84
Science de la vie, de la terre et agronomie                      REV. RAMRES - VOL.09 NUM.02 2021** ISSN 2424-7235

                                                                 Figure 9. Evolution of vegetation cover between 1988 and 2017
                                                                 in Dimbokro Department.

Figure 6. Evolution of the chlorophyll levels between 1988 and
2017 in Dimbokro Department

                                                                 Figure 10. Compositions of the 2017 landsat image showing the oli 5/6/4

                                                                 3.2. Validation of classification results
Figure 7. Evolution of chlorophyll activity between 1988 and      The different colorful compositions OLI5, OLI6 and OLI4
2017 in Dimbokro Department                                      of 2017 Landsat images discriminated as well the land use
                                                                 types (Figure 10) the major colorations which were the
                                                                 clear green and dark green. The different classifications
                                                                 were evaluated by the confusion matrices and the Kappa
                                                                 coefficient (Tables II & III). These matrices showed overall
                                                                 map accuracies of 96.76% for 1988 Landsat TM image and
                                                                 97.70% for 2017 Landsat OLI-TIRS image. The Kappa
                                                                 coefficients were set at 0.96 for 1988 image and at 0.97 for
                                                                 2017 image (Tables II & III). A closer analysis showed that
                                                                 a minor confusion was observed between some land use
                                                                 types. In 1988, the highest confusion is found between the
                                                                 woody savannas and the shrubby savannas, and between
                                                                 the nude soils or localities and the woody savannas (Table
                                                                 II). These confusions were 3.73% and 3.66% respectively.
                                                                 In 2017, the highest confusion was between the fallows or
                                                                 crops land and the nude soils or localities, with a value of
                                                                 5.42% (Table III).
Figure 8. Evolution of the plant cover levels in 1988 and 2017
in Dimbokro Department                                           3.3. Evolution of the land use types
                                                                 The land use map of the different vegetation formations
                                                                 in Dimbokro County between 1988 and 2017 (Figure 11)
                                                                 showed a total of seven land use classes. These are fallows
                                                                 or crops lands, reparian forests, forests of plateaus, forest
                                                                 plantations, savannas (shrubby and woody) and nude soils
                                                                 or localities. The latter (nude soils) reached the Southern
                                                                 zone of Dimbokro Department (Figure 11).

                                                                                                                                 85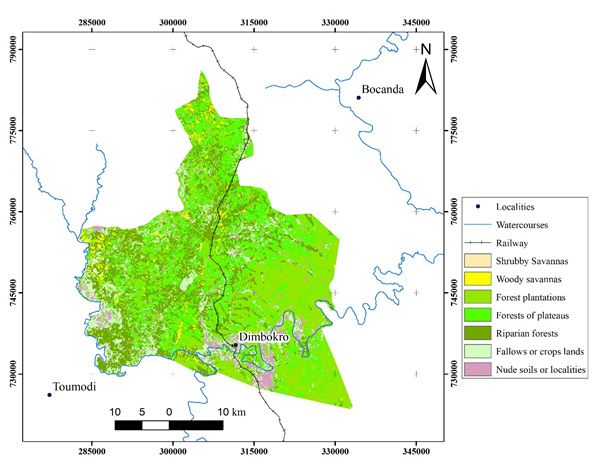
REV. RAMRES - VOL.09 NUM.02. 2021** ISSN 2424-7235                                                    Science de la vie, de la terre et agronomie

Table II. Confusion matrix for the classification of the 1988 image.
Total accuracy = (18501/19121) 96.76%, Kappa coefficient = 0.96. The values in bold diagonal
correspond for each class to the well-ranked pixel rates. The various off-diagonal rates reflect
the rates of poorly ranked pixels that have been assigned to a class to which they do not belong.

Table III. Confusion matrix for the classification of the 2017 image.
Total accuracy = (11842/12121) 97.70 %. Kappa coefficient = 0.97. The values in bold diagonal
correspond for each class to the well-ranked pixel rates. The various off-diagonal rates reflect
the rates of poorly ranked pixels that have been assigned to a class to which they do not belong.

                                                                                                    Figure 13. Changes in land use types between 1988 and 2017 in
                                                                                                    Dimbokro Department

                                                                                                    The change matrix of the cross-referencing of 1988 and 2017
                                                                                                    land use maps of Dimbokro Department showed a change
                                                                                                    in the different land use types areas which was a decrease of
                                                                                                    5.69% (367 325 ha) vegetation and an increase of 5.52% (355
                                                                                                    984 ha) vegetation (Table V).
Figure 11. Evolution of land use types in Dimbokro Department in 1988 and 2017
                                                                                                    Table V. Overall land use types change in Dimbokro Department
In terms of change rate of land use types, the overall Dimbokro                                     from 1988 to 2017.
Department experienced a rate of 6.79% corresponding to an
increasing area of 17% (271.67 Km²) of the savannas (shrubby                                           Nature of change         Area (ha)        Importance (%)
and woody), the fallows or crops lands, the forests of plateaus                                            Stability            5 729 291            88.79
and forest plantations, and a decreasing area of 23.66% (380.90                                          Progression             355 984               5.52
Km²) of the nude soils or localities and the riparian forests
(Figures 12 & 13, Table IV). The riparian forests lost 30.36%                                             Regression             367 325               5.69
of its area, while the nude soils or localities experienced a                                                Total              6 452 600              100
regression about 47.45% of its (Figures 11 & 12, Table IV)
from 1988 to 2017. The shrubby savannas, the forest of plateaus
and the fallows or crops lands showed a slight increase in area,                                    3.6. Relation between climatic variables and the land use types
while the woody savannas and the forest plantations got the
higher positive rates of change with 93.40% and 205.05% of                                          In 1988, the Eastern zone of Dimbokro Department occupied
their respective areas (Figures 11 & 12, Table IV).                                                 mainly by the forest plantations, the fallows or crops lands and
                                                                                                    the riparian forests (Figure 7) showed the highest chlorophyll
                                                                                                    activity level (Figure 4), the lowest ground surface temperature
                                                                                                    (Figure 2) and the highest value of NDBI (Figures 8 & 9).
                                                                                                    The Western zone of Department was covered mainly by the
                                                                                                    savannas (shrubby and woody), the nude soils or localities
                                                                                                    and the forests of plateaus (Figure 7) and experienced the
                                                                                                    lowest chlorophyll activity level (Figure 4), the lowest land
                                                                                                    surface temperature (Figure 2) and the lowest value of NDBI
                                                                                                    (Figures 8 & 9).

Figure 12. Changes in Dimbokro Department land use types between 1988 and 2017.
    86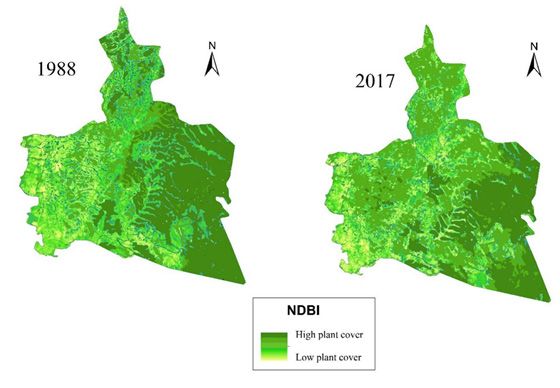
Science de la vie, de la terre et agronomie                        REV. RAMRES - VOL.09 NUM.02 2021** ISSN 2424-7235

4. DISCUSSION
The overall high map accuracies about 96.76% for 1988              5. CONCLUSION
Landsat TM image and 97.70% for 2017 Landsat OLI-TIRS
                                                                   The analyses of Landsat TM satellite images from 1988 and
image, and the Kappa coefficients of 0.96 for 1988 image
                                                                   OLI/TIRS satellite images from 2017 showed the spatial
and at 0.97 for 2017 image showed that the classification of
                                                                   and temporal dynamics of the landscape and land use types
the land use dynamics in Dimbokro Department (Figure 10)
                                                                   in Dimbokro Department. The unsupervised classification
was very correct as well as recommended Pontius (2000),
                                                                   method discriminated land use types on the basis of remote
De Raadt et al. (2019) and Foody (2020). Thus, these maps
                                                                   sensing indices including GST, NDVI, NDBI and NDWI.
(Figures 10, 11 & 13) experienced the field truth and the
                                                                   These indices provided information on the heat exchange,
slight confusions found between the riparian forests and
                                                                   the chlorophyll level and activity, the vegetation cover
woody savannas, on the one hand, and between the fallows
                                                                   and dynamic. From 1988 to 2017, all the land use types
or crops lands and the nude soils or localities, on the other
                                                                   increased in area more or less significantly except the riparian
hand (Tables II & III), could be due to the physiognomy of
                                                                   forests and the nude soils or localities, which decreased in
these vegetation, which should be favourable to very close
                                                                   area significantly in Dimbokro Department. A relationship
spectral responses. Therefore, the classification of the land
                                                                   was found between the land use types and the chlorophyll
uses into seven types (Figures 10-12, Tables II-IV) was very
                                                                   activity level and activity, and the GST, and the NDBI. Our
good and allowed to evaluate the land use change over the 29
                                                                   hypothesis to find different responses of the land use types
years dynamics (Figures 11-13, Table IV). Many authors in
                                                                   to human activities and temperature variation in Dimbokro
Côte d’Ivoire, specially N’Guessan et al. (2003), Goetze et al.
                                                                   Department was confirmed.
(2006), Barima (2009), Barima et al. (2009, 2010) and Sangne
et al. (2015) stressed that the use of remote sensing indices      ACKNOWLEDGEMENTS
provide useful and potential information for the knowledge of      The authors would like to thank the African Centre of
the state of the vegetation cover of an area. Elsewhere, others    Excellence on Climate Change, Biodiversity and Sustainable
authors like Wang and Gamon (2019) and Weiss et al. (2020)         Agriculture of the University Félix Houphouët-Boigny which
gave the same conclusion.                                          funded this work. We’re grateful to local technician and
The relationship of the GST (Figures 2 & 3) with the chlorophyll   people who helped us to collect data in the field. Also, many
activity and level (Figures 5 & 6), and with the plant cover       thanks for the reviewers who helped us to improve this paper.
level (Figure 8) was conform to Benkahla (2011) who found          CONFLICT OF INTEREST STATEMENT
the lower surface temperature in the higher vegetation density
area and certified that the vegetation regulates the surface       The authors of this manuscript declare that they have no
temperature by absorbing the radiant energy and re-emitting        conflict of interest.
it as latent heat through the process of evapotranspiration.       REFERENCES
The areas of Dimbokro Department with the highest land
use change from 1988 to 2017 was the forest plantations            Avenard J.M., (1971). Aspects de la Géomorphologie. In :
(Figures 8, 11 & 12) that increased and corresponded to the        Avenard J.M., Eldin E., Girard G., Sircoulon J., Touchebeuf
area of the highest chlorophyll level (Figure 5). These forests    P., Guillaumet J.-L., Adjanohoun E. and Perraud A. (eds). Le
plantations belonging to the Société de Développement des          milieu naturel de la Côte d’Ivoire. ORSTOM, Paris, pp. 7-72.
Forêts domain were largely monospecific plantations made           Bamba I., Mama A., Neuba D.F.R., Koffi K.J., Traoré D.,
up of species such as Gmelina arborea Roxb., Senna siamea          Visser M., Sissin B., Lejoly J. and Bogaert J., (2008). Influence
(Lam.) Irw. & Barn. and Tectona grandis L.f. and where the         des actions anthropiques sur la dynamique spatiotemporelle
canopy was very closed by large trees (Kouamé 2017).               de l’occupation du sol dans la province du Bas-Congo (R. D.
Meneses-Tovar (2011) stated that NDVI was an indicator of          Congo). Sciences et Nature, 5(1), 49-60.
forest health, while Tra Bi (2013) underlined the correlation      Barima Y.S.S., (2009). Dynamique, fragmentation et diversité
between the chlorophyll activities and the anthropogenic           végétale des paysages forestiers en milieux de transition forêt-
activities. In Dimbokro Department, the establishment of the       savane dans le Département de Tanda (Côte d’Ivoire). Thèse
crops like yam, cassava, palm oil, rice, cashew and banana         de Doctorat, Université Libre de Bruxelles, Belgique, 178 p.
was the main cause of the regression of both the riparian
forests and the nude soils or localities (Figure 12) as have       Barima Y.S.S., Barbier N., Bamba I., Traoré D., Lejoly J.
shown Kissinger et al. (2012) and Tchatchou et al. (2015).         and Bogaert J., (2009). Dynamique paysagère en milieu
Ningal et al. (2008) showed that the evolution of agricultural     de transition forêt-savane ivoirienne. Bois et Forêts des
areas to the detriment of vegetation cover was a threat of         Tropiques, 299 (1), 15-25.
the forest areas. Mama and Oloukoi (2003), Kissinger et al.        Barima Y.S.S., Egnankou W.M., N’Doumé A.C.T., Kouamé
(2012) and Tchatchou et al. (2015) distinguished the direct        F.N. and Bongaert J., (2010). Modélisation de la dynamique
and indirect causes of the vegetation cover degradation.           du paysage forestier dans la région de transition forêt-savane à
The direct causes were related to human activities including       l’Est de la Côte d’Ivoire. Revue Télédétection, 9 (2), 129-138.
charcoal production, the medicinal plants extraction, logging,
bush fires, forest clearance etc. by the rural populations.        Benkahla N., (2011). Identification de la végétation terrestre
The Indirect causes were related to the poverty of the local       par radiomètre MSG-SEVIRI et suivi de son évolution
populations, which harvest the vegetation for the financial        temporelle. Diplôme Magister, Faculté des Sciences,
means or to their primary needs such as the health, the meat,      Université des Sciences et de la Technologie d’Oran
the food etc.                                                      Mohamed Boudiaf, Algérie 86 p.
                                                                   Brou Y.T., Akindès F. and Bigot S., (2005). La variabilité
                                                                                                                             87
REV. RAMRES - VOL.09 NUM.02. 2021** ISSN 2424-7235                         Science de la vie, de la terre et agronomie

climatique en Côte d’Ivoire : entre perceptions sociales et            Quantification des changements de l’occupation du sol dans la
réponses agricoles. Cahiers Agricultures, 14 (6), 533-540.             prefecture de Yoto (Sud-est Togo) à l’aide de l’imagerie satellitaire
                                                                       Landsat. Revue des Sciences de l'Environnement, 13, 137-156.
Cheng G., Xie X., Han J., Guo L. and Xia G.-S., (2020). Remote
sensing image scene classification meets deep learning:                Lambert N., (2012). Cartographie de l’occupation du sol:
Challenges, methods, benchmarks, and opportunities. Journal            Spécifications techniques. Observatoire du Sahara et du Sahel, 36 p.
of Selected Topics in Applied Earth Observations and Remote
                                                                       Li Z.-L. and Becker F., (1993). Feasibility of land surface
Sensing, 13, 3735-3756.
                                                                       temperature and emissivity determination from AVHRR
Crist E.P. and Cicone R.C., (1984).Application of the Tasseled Cap     Data. Remote Sensing of Environment, 43, 67-85.
concept to simulated thematic mapper data. Photogrammetric
                                                                       Ma L., Liu Y., Zhang X., Ye Y., Yin G. and Johnson B.A.,
Engineering and Remote Sensing, 50, 343-352.
                                                                       (2019). Deep learning in remote sensing applications: A
De Raadt A., Warrens M.J., Bosker R.J. and Kiers H.A.,                 meta-analysis and review. ISPRS journal of photogrammetry
(2019). Kappa coefficients for missing data. Educational and           and remote sensing, 152, 166-177.
psychological measurement, 79(3), 558-576.
                                                                       Mama V.J. and Oloukoi J., (2003). Evaluation de la précision des
Eggert M.K.H., (1993). Central Africa and the archeology of the        traitements analogiques des images satellitaires dans l’étude de la
equatorial forest: reflections on some major topics. In: Shaw T.,      dynamique de l’occupation du sol. Télédétection, 3 (5), 429-441.
Sinclair P., Andah B. and Okpoko A. (eds). The archaeology of
                                                                       Meneses-Tovar C.L., (2011). L’indice différentiel normalisé
Africa: food, metals, and towns. New York, Routledge, 289-329.
                                                                       de végétation comme indicateur de la dégradation. Unasylva,
Denis A., (2013). Travaux Pratiques de télédétection spatiale. Arlon   238 (62), 46 p.
Campus Environnement, Université de Liège, Belgique, 84 p.
                                                                       Mortsch L.D., (2006). Impact of climate change on agriculture,
Foody G.M., (2020). Explaining the unsuitability of the kappa          forestry and wetlands. In : Bhatti J., Lal R., Apps M.J. and Price
coefficient in the assessment and comparison of the accuracy           M.A. (eds). Climate change and managed ecosystems, pp.45-67.
of thematic maps obtained by image classification. Remote
                                                                       N’guessan K.E., Bellan M.-F. and Blasco F., (2003). Suivi par
Sensing of Environment, 239, 111630.
                                                                       télédétection spatiale d'une forêt tropicale humide protégée soumise
Godard V., (2005). Typologie des paysages forestiers du Sud            à des pressions anthropiques. Télédétection, 3 (5), 443-456.
du massif de Fontainebleau après la tempête de décembre
                                                                       Ningal T., Hartemink A.E. and Bregt A.K., (2008). Land
1999. Évaluation des dégâts forestiers à l’aide d’un semis de
                                                                       use change and population growth in the Morobe Province
points et d’imagerie satellitale optique. Revue Internationale
                                                                       of Papua New Guinea between 1975 and 2000. Journal of
de Géomatique, 15 (3), 281-302.
                                                                       Environment Management, 87, 117-124.
Goetze D., Hörsch B. and Porembski S., (2006). Dynamics
                                                                       Noyola-Medrano C., Mering C. and Rojas Beltrán M.A.,
of forest-savanna mosaics in north-eastern Ivory Coast from
                                                                       (2008). Evaluation du changement de l’occupation du sol à
1954 to 2002. Journal of Biogeography, 33, 653-664.
                                                                       l’aide des images Landsat et Spot: champ volcanique de la
Guillaumet J.-L. and Adjanohoun É., (1971). La végétation              Sierra Chichinautzin, Mexique, 12 p.
de la Côte d’Ivoire. In : Avenard J. M., Éldin E., Girard G.,
                                                                       Ouédraogo O., Thiombiano A., Hahn-Hadjali K. and
Sircoulon J., Touchebeuf P., Guillaumet J.-L., Adjanohoun É.
                                                                       Guinko S., (2009). Diversity and dynamics of the juvenile
and Perraud A. (eds). Le milieu naturel de la Côte d’Ivoire.
                                                                       woody vegetation of the Arly National Park, Burkina Faso,
Mémoires de l’ORSTOM 50, 157-263.
                                                                       Candollea, 64, 257-278.
Kissinger G., Herold M. and De S.V., (2012). Drivers of
                                                                       Parmentier I., Harrigan R.J., Buermann W., Mitchard E.T.A.,
deforestation and forest degradation. A synthesis report for
                                                                       Saatchi S., Malhi Y., Bongers F., Hawthorne W.D., Leal M.E.,
REDD+ policymakers. Vancouver, Canada, 48 p.
                                                                       Lewis S.L., Nusbaumer L., Sheil D., Sosef M.S.M., Affum-
Kouamé F.N., (2016). Structure de la végétation, flore et              Baffoue K., Bakayoko A., Chuyong G.B., Chatelain C.V.,
régénération des forêts classées de Duekoué et de Scio dans            Comiskey J.A., Dauby G., Doucet J.-L., Fauset S., Gautier L.,
la zone de forêt dense humide de l’Ouest de la Côte d’Ivoire.          Gillet J.-F., Kenfack D., Kouamé F.N., Kouassi E.K., Kouka L.A.,
Thèse Doctorat, Université Félix Houphouët-Boigny, 282 p.              Parren M.P.E., Peh K. S.-H., Reitsma J.M., Senterre B., Sonké B.,
                                                                       Sunderland T.C.H., Swaine M.D., Tchouto M.G.P., Thomas D.,
Kouamé F.N., (2017). Végétation, flore et régénération en
                                                                       van Valkenburg J.L.C.H. and Hardy O.J., (2011). Predicting alpha
forêts classées de Côte d’Ivoire. Editions universitaires
                                                                       diversity of African rain forests: models based on climate and
européennes, Saarbrüken, 285 p.
                                                                       satellite-derived data do not perform better than a purely spatial
Kouamé F.N. and Zoro Bi I.A., (2010). Nouveau découpage                model.” Journal of Biogeography, 38(6), 1164-1176.
de la zone de forêt dense humide de la Côte d’Ivoire. Sciences
                                                                       Parmentier I., Malhi A., Senterre B., Whittaker R.J., A.T.D.N.,
et Nature, 7 (2), 177-194.
                                                                       Alonso A., Balinga M.P.B.,
Kouassi A.M., Kouamé K.F., Ahoussi K.E., Oularé S. and
                                                                       Bakayoko A., Bongers F., Chatelain C.V., Comiskey J.A.,
Biémi J., (2012). Impacts conjugués des changements
                                                                       Corthay R., Djuikouo-Kamdem M.-N., Doucet J.-L., Gautier
climatiques et des pressions anthropiques sur les modifications
                                                                       L., Hawthorne W.D., Issembe Y.A., Kouamé F.N., Kouka
de la couverture végétale dans le bassin versant du N'Zi-
                                                                       L.A., Leal M.E., Lejoly J., Lewis S.L., Nusbaumer L., Parren
Bandama (Côte d'Ivoire). Revue Ivoirienne des Sciences et
                                                                       M.P.E., Peh K.S.-H., Phillips O.L., Poorter L., Sheil D., Sonké
Technologies, 20, 124 - 146.
                                                                       B., Sosef M.S.M., Sunderland T.C.H., Stropp J., ter Steege
Kpedenou K.D., Boukpessi T. and Tchamie T.T.K., (2016).                H., Swaine M.D., Tchouto M.G.P., van Gemerden B.S., van
   88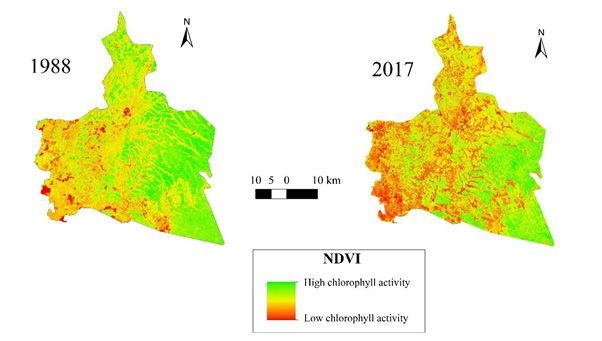
Science de la vie, de la terre et agronomie                         REV. RAMRES - VOL.09 NUM.02 2021** ISSN 2424-7235

Valkenburg J.L.C.H. and Wöll H., (2007). The odd man out?           phylogénétique nouvelle des Angiospermes des régions
Might climate explain the lower tree α-diversity of African         tempérées et tropicales. Presses polytechniques et
rain forests relative to Amazonian rain forests? Journal of         universitaires romandes, Lausanne 372 p.
Ecology, 95, 1058-1071.                                             Tchatchou B., Sonwa D.J., Ifo S. and Tiani A.M., (2015).
Perraud A., (1971). Les sols. In : Avenard J.M., Eldin E.,          Déforestation et dégradation des forêts dans le bassin du
Girard G., Sircoulon J., Touchebeuf P., Guillaumet J.-L.,           Congo : Etat des lieux, causes actuelles et perspectives. Papier
Adjanohoun E. and Perraud A. (eds). Le milieu naturel de la         occasionnel 120. Bogor, Indonésie, CIFOR, 47 p.
Côte d’Ivoire. ORSTOM, Paris, pp. 265-391.                          Toyi M.S., Barima Y.S.S., Mama A., André M., Bastin J.-
Pontius Jr R.G., (2000). Quantification error versus location       F., De Cannière C., Sinsin B. and Bogaert J., (2013). Tree
error in comparison of categorical maps. Photogrammetric            plantation will not compensate natural woody vegetation
Engineering & Remote Sensing, 66, 1011-1016.                        cover loss in the Atlantic Department of Southern Benin.
                                                                    Tropicultura, 31, 62-70.
Robin M., (2002). Télédétection, des Satellites au SIG. Une
analyse complète du processus de création d’un type essentiel       Tra Bi Z.A., (2013). Etude de l’impact des activités
d’information géographique. Nathan, 2ème édition, 318 p.            anthropiques et de la variabilité climatique sur la végétation
                                                                    et les usages des sols, par utilisation de la télédétection et
Ruuska S., Hämäläinen W., Kajava S., Mughal M., Matilainen
                                                                    des statistiques agricoles, sur le bassin versant du Bouregreg
P. and Mononen J., (2018). Evaluation of the confusion
                                                                    (Maroc). Thèse de Doctorat, Géographie, Université Félix
matrix method in the validation of an automated system
                                                                    Houphouët Boigny et Université d’Artois 191 p.
for measuring feeding behaviour of cattle. Behavioural
processes, 148, 56-62.                                              Valor E. and Caselles V., (1996). Mapping Land Surface Emissivity
                                                                    from NDVI: Application to European, African, and South American
Sangne Y.C., (2009). Dynamique du couvert forestier d’une
                                                                    Areas. Remote sensing of Environment, 57, 167-184.
aire protégée soumise aux pressions anthropiques : cas de la
forêt classée de Téné dans le Département d’Oumé (Centre-           Vancutsem C., Pekel J.-F., Evrard C., Malaisse F. and
Ouest de la Côte d’Ivoire). Thèse de Doctorat, Université de        Defourny P., (2006). Carte de l’occupation du sol de la
Cocody-Abidjan (Côte d’Ivoire), 220 p.                              République Démocratique du Congo au 1/3 000 000e. Faculté
                                                                    d’Ingénierie biologique, agronomique et environnementale,
Sangne C.Y., Barima Y.S.S., Bamba I. and N’Doumé C.T.A.,
                                                                    Université catholique de Louvain 29 p.
(2015). Dynamique forestière post-conflits armés de la forêt
classée du Haut-Sassandra (Côte d’Ivoire). VertigO, 15 (3), 1-18.   Wan Z. and Li Z-L., (1997). A physics-based algorithm for
                                                                    retrieving land-surface emissivity and temperature from
Schlaepfer R., (2002). Analyse de la dynamique du paysage.
                                                                    EOS/MODIS data, IEEE. Transactions on Geoscience and
Fiche d’enseignement 4.2, Laboratoire de Gestion des
                                                                    Remote Sensing, 3(5), 980-996.
Ecosystèmes, Ecole Polytechnique de Lausanne, Suisse 10 p.
                                                                    Wang R. and Gamon J.A., (2019). Remote sensing of terrestrial
Spichiger R.E., Savolainen V.V. and Figeat M., (2000).
                                                                    plant biodiversity. Remote Sensing of Environment, 231, 111218.
Botanique systématique des plantes à fleurs. Une approche

                                                                                                                              89
You can also read