Dynamic Line Rating - June 2019 United States Department of Energy Washington, DC 20585
←
→
Page content transcription
If your browser does not render page correctly, please read the page content below
Dynamic Line
Rating

June 2019

            United States Department of Energy
                         Washington, DC 20585
Page left intentionally blank
Department of Energy | June 2019

Executive Summary
The electric grid is a complex system-of-systems that is responsible for providing safe, reliable,
and cost-effective electricity to customers. If a transmission system component, such as an
overhead line, is operating at its physical limit, system operators may choose to run a more
expensive generator over a less expensive one in order to meet safety and system reliability
standards. The events and costs associated with the suboptimal commitment and dispatch of
generators is known as congestion. Congestion costs can be quite substantial; the sum of real-
time congestion cost among major U.S. system operators in 2016 was $4.8 billion.

Traditional solutions to alleviating congestion include expanding, upgrading, or rebuilding the
electric infrastructure. While these long-lead-time solutions may be needed in the long term,
new and innovative technologies such as dynamic line rating (DLR) may provide congestion
relief in the near term at lower expense. DLR systems are one of many options for addressing
grid congestion; other solutions such as power-flow controllers, energy storage, distributed
energy resources, and demand response also play key roles in modernizing the grid. An
additional benefit of implementing DLR is increased situational awareness of the transmission
system and the potential for condition-based monitoring of transmission lines.

The maximum power flow capacity on a transmission line is limited by heating considerations to
maintain safe and reliable operating conditions. These static line ratings (SLRs) are usually
calculated using conservative assumptions about the transmission-line operating environment,
producing an inflexible constraint that does not take advantage of changing or favorable
environmental conditions (e.g., wind cooling) that allow for greater transmission usage. DLR is
a blanket term for the many different technologies and methodologies for determining
conductor thermal ratings in a more-dynamic fashion using improved, more granular, or real-
time data. At its core, DLR systems help system operators determine the prevailing current-
carrying capacity limits of transmission lines to relax constraints based on SLRs.

Over the past several decades, a diverse set of technologies, methods, and systems have been
developed to enable DLR. Each system and method has advantages and disadvantages when it
comes to accuracy, reliability, capital cost, ease of installation and integration, and maturity.
Despite DLR’s potential for realizing cost savings and its ability to increase grid reliability and
resilience, several challenges remain that prevent its widespread adoption. Implementation of
DLR must ensure that new hazards are not created and be tempered with consideration for
other system limitations and the potential for unintended consequences.

The U.S. currently lags behind other countries in the deployment of some advanced
transmission technologies, such as DLR. One of the variables is the difference in regulatory
environments; the U.S. provides transmission owners little incentive to deliver more power
over existing lines or to reduce transmission congestion. Additionally, wholesale electricity
markets play an important role in guiding the operating, planning, and investment decisions of
asset owners and developers. Broad adoption of DLR will influence the performance of

                                                                     Dynamic Line Rating | Page ii
Department of Energy | June 2019
electricity markets, impacting the profitability or viability of specific generation sources. While
the impact of DLR schemes on different generation technologies cannot be generalized, there
are instances where specific sources can be advantaged or disadvantaged.
Overall, experience with DLR pilot studies and demonstrations have shown capacity increases,
but the outcomes are difficult to extrapolate beyond the targeted lines. Numerous power grid
stakeholders have also expressed support for DLR, but technical, market, and regulatory
challenges remain that must be addressed to facilitate broader adoption. Further research is
needed to better understand the economic benefits, costs, and impacts of wide-spread DLR
adoption, especially at the regional or national level. Additional demonstrations and pilot
studies can also provide utilities and other stakeholders with increased confidence in DLR
methods and systems, reduce technology risk and uncertainty, and help ascertain the value of
ancillary benefits such as improved situational awareness.
Dynamic Line Rating | Page iiiDepartment of Energy | June 2019
Abbreviation Reference
AAR Ambient Adjusted Rating
AEP American Electric Power
CAISO California Independent System Operator
CIGRE International Council on Large Electric Systems
DERs distributed energy resources
DLR dynamic line rating
DOE Department of Energy
DTE Detroit Edison (DTE Energy)
ERCOT Electricity Reliability Council of Texas
FERC Federal Energy Regulatory Commission
IEC International Electrotechnical Commission
IEEE Institute of Electrical and Electronics Engineers
ISO independent system operator
ISO-NE Independent System Operator New England
MISO Midcontinent Independent System Operator
NERC North American Electric Reliability Corporation
NYISO New York Independent System Operator
NYPA New York Power Authority
REE Red Electica de Espana
ROE return on equity
RTE Réseau de Transport d'Électricité
RTO regional transmission organization
SCADA supervisory control and data acquisition
SIL surge impedance load
SLR static line rating
TCF transmission capacity forecasting
TDU transmission and distribution utility
WOW Wind on Wires
WPPI Wisconsin Public Power Inc.
Dynamic Line Rating | Page ivDepartment of Energy | June 2019
DYNAMIC LINE RATING
Table of Contents
II. Introduction ........................................................................................................................... 1
State of the U.S. Electric Grid.............................................................................................. 1
Transmission Congestion .................................................................................................... 2
Thermal Limits of Transmission Lines ................................................................................. 3
Static Line Ratings ......................................................................................................... 4
Dynamic Line Ratings .................................................................................................... 4
Potential Benefits of Dynamic Line Rating.......................................................................... 5
Improved Congestion Management ............................................................................. 5
Increased Reliability and Resilience .............................................................................. 6
III. State of DLR Technology ........................................................................................................ 7
Sensing and Monitoring ...................................................................................................... 7
Communications ............................................................................................................... 10
Analytics Engine ................................................................................................................ 10
Integration ........................................................................................................................ 11
Barriers and Limitations .................................................................................................... 12
Accuracy and Reliability .............................................................................................. 13
Operational Knowledge and Experience .................................................................... 13
Cost of Implementation .............................................................................................. 14
Monetization of Benefits ............................................................................................ 15
IV. Stakeholder Views and Sysem Impacts ............................................................................... 16
Case Studies ...................................................................................................................... 17
Stakeholder Views ............................................................................................................ 18
Impact on Different Generation Technologies ................................................................. 21
Other System Impacts and Considerations ...................................................................... 22
V. Conclusions .......................................................................................................................... 23
VI. Bibliography ......................................................................................................................... 25
Dynamic Line Rating | Page vDepartment of Energy | June 2019
II. Introduction
The electric grid is a complex system-of-systems that is responsible for providing safe, reliable,
and cost-effective electricity to customers. Developed and built over the last 125 years, the
U.S. electric power system has been called the biggest machine in the world. The electric
transmission and distribution infrastructure and the energy delivery it facilitates represent an
essential fabric of the modern economy. Whether the grid is powering manufacturing and
essential health services or our computers and cell phones, its omnipresence is felt most when
it suddenly fails. Recently, investments in the grid have focused on improving its reliability,
efficiency, and resiliency to meet the growing dependence on electricity across all sectors. This
is a complicated task where generation and use must be balanced continuously, the ability to
store electricity cost-effectively is limited, and energy consumption patterns are ever-changing.
To serve our expectation of continuous access to electricity, a collection of generators, towers,
wires, transformers, switches, and poles were erected and stitched together. The electric
power system is typically divided into the categories of generation, transmission, distribution,
and end-use. In addition to the physical infrastructure, a centralized control paradigm was
developed where large remote generators are coordinated and dispatched to ensure the
reliable delivery of electricity to end-users through a vast network of high-voltage transmission
lines and lower-voltage distribution systems. Balancing authorities and system operators have
been tasked with the dispatch of generators to meet all loads while ensuring reliability and
minimizing costs, a process known as security-constrained economic dispatch.
If a transmission system component, such as an overhead line, is operating at its physical limit,
balancing authorities may choose to run a more expensive generator over a less expensive one
in order to meet safety and system reliability standards. The events and costs associated with
the suboptimal commitment and dispatch of generators are known as congestion [1].
Balancing authorities and system operators attempt to mitigate congestion by forecasting
demand and generator availability in the short term (e.g., through day-ahead and hour-ahead
markets) and identifying system needs in the long term (e.g., through multi-year resource,
transmission, and distribution planning).
Ultimately, the goal of the electric grid is to deliver safe, reliable, and cost-effective electric
power. For each part of the system, there are numerous tools, technologies, and approaches to
help accomplish this goal. In the distribution system, vegetation management and distribution
automation are used to prevent and recover from interruptions. In the transmission system, a
variety of contingencies are analyzed and planned for while phasor measurement units provide
wide-area situational awareness. Dynamic line rating (DLR) is one of several tools that can help
address challenges with transmission operation, especially congestion management.
State of the U.S. Electric Grid
The U.S. electric grid contains more than 200,000 miles of high-voltage transmission lines and
roughly 5.5 million miles of local distribution lines that operate within a patchwork of Federal,
Dynamic Line Rating | Page 1Department of Energy | June 2019
State, Tribal, and local regulatory jurisdictions. However, the reliability of the bulk power
system (i.e., large generators and the transmission network) generally fall under the purview of
the Federal Energy Regulatory Commission (FERC) and the North American Electric Reliability
Corporation (NERC), which issue and enforce mandatory reliability standards [2]. Several
professional organizations, such as the Institute for Electrical and Electronics Engineers (IEEE),
International Electrotechnical Commission (IEC), and the International Council on Large Electric
Systems (CIGRE), also issue guidelines and technical standards. These various standards
provide the basis for the bulk power system that is key to ensuring the safe and reliable delivery
of electricity.
Climate in the U.S. spans a vast spectrum, ranging from tropical to subarctic to desert,
depending on location. This means the electric power system experiences many different
temperatures and weather conditions daily and throughout the seasons of the year.
Additionally, the demand for electricity also changes by hour, day of the week, and season with
times of peak-load varying by region. In hot climates, home air-conditioning usage increases
the overall load needed in the late afternoon during the hottest part of the year. In cold
climates, home heating increases loads in mid-mornings and mid-evenings during the coldest
part of the year. Weather conditions are also important to grid operations since they affect
system loads and extreme weather events can result in damage to infrastructure assets.
Parts of the electric grid are more than a century old, and 70 percent of the transmission lines
and large power transformers are more than 25 years old [3], [4]. Along with aging
infrastructure, the electric power system is evolving from one consisting of predominantly
dispatchable generation sources (e.g., nuclear, coal, natural gas, and hydroelectric) to one
having increasing percentages of variable generation sources (e.g., wind and solar). The
deployment of variable generation varies widely across the U.S. as well as the ability of the
regional grid infrastructure to accommodate them. Additionally, the centralized control
paradigm where generation is dispatched to serve variable customer loads is being challenged
with greater deployment of distributed energy resources (DERs). The increasing adoption of
electric vehicles will also introduce load growth and potentially increased variability. These
broad system changes have created a need for advanced solutions to help solve modern
operational challenges.
Transmission Congestion
Transmission congestion occurs when changes in demand or generation result in power
delivery that reach or exceed the physical capacity of the transmission network. Transmission
constraint “refers either to [the limit placed on] a piece of equipment or an operational limit
imposed to protect reliability that restricts these flows, or to a lack of adequate transmission
capacity to deliver expected new sources of generation without violating reliability rules [1].”
Power flows on transmission lines are limited for both electrical (e.g., voltage drop, phase,
stability) and thermal (e.g., resistive heating, mechanical sag) reasons. Typically, these limits
are calculated by system and planning engineers and applied by system operators to ensure
safety and reliability. Transmission congestion results in generation commitment and dispatch
decisions that vary from a lowest-cost basis, ultimately increasing the price of electricity.
Dynamic Line Rating | Page 2Department of Energy | June 2019
In most organized wholesale markets, the locational marginal price of electricity (i.e., the price
actually paid for electricity at different parts of the system) is calculated by adding the system
marginal cost (i.e., the incremental cost of electricity to meet the last MWh of demand based
on economic dispatch), the congestion component (i.e., the cost associated with the local
dispatch of more expensive generation to relieve the constraint), and the marginal loss
components (i.e., transmission losses associated with delivering the increment of electricity).
While the settlement rules associated with these calculations vary slightly across the main
wholesale markets, the result is the same: congestion costs are effectively paid for by the users
of electricity.
Congestion costs can be quite substantial; between 2009 and 2017, California ratepayers’ bills
included $683.5 million in congestion-related costs [5]. According to a 2018 U.S. Department of
Energy (DOE) report, the sum of real-time congestion cost for 2016 among major system
operators—specifically, the California Independent System Operator (CAISO), the Electricity
Reliability Council of Texas (ERCOT), Independent System Operator New England (ISO-NE),
Midcontinent Independent System Operator (MISO), New York Independent System Operator
(NYISO), and PJM—was $4.8 billion [6].
Traditional solutions to alleviating congestion include expanding, upgrading, or rebuilding the
electric infrastructure. Transmission expansion projects in the U.S. totaled over $20 billion
every year since 2014 through 2016 [7]. Since most transmission infrastructure was built
between the 1960s and the 1980s, these investments are needed to ensure grid reliability as
the assets age. One estimate projects that transmission replacement costs alone will increase
by $1.2–3.2 billion per year over the next 10 years, assuming facilities need to be replaced after
60 to 80 years of operation [8]. Additionally, line reconductoring, which can be used in some
situations to increase capacity on existing transmission right-of-way, can cost from $1 million to
$8 million per mile depending on the voltage class of the line [9]. While these long-lead-time
solutions may be needed in the long term, new and innovative technologies (e.g., DLR, demand
response, power-flow controllers, DER, and energy storage) may provide congestion relief in
the near term at lower expense.
Thermal Limits of Transmission Lines
A transmission line is referred to as being thermally limited when heating considerations set the
maximum power flow capacity on the line. These thermal limits (i.e., maximum current
carrying capacity at a given voltage) are determined based on the maximum operating
temperature of the conductor that prevents premature aging and that limits conductor sag to
maintain minimum clearances under the line for safety. Conductors expand at higher
temperatures, lengthening the line and reducing the distance to the ground and other objects,
which can result in arcing or faults if safe clearance distances are not maintained. Generally,
the physical properties of the conductor (e.g., maximum temperature rating, electrical
resistance, mechanical strength) and a set of environmental conditions (e.g., ambient air
temperature, wind speed, solar radiation) are used to calculate thermal limits.
Dynamic Line Rating | Page 3Department of Energy | June 2019
Static Line Ratings
Static line ratings (SLRs) are typically used by system operators in dispatch decisions to maintain
safe operating conditions. SLRs are determined according to IEEE Standard 738, “Standard for
Calculating the Current-Temperature Relationship of Bare Overhead Conductors” [10]. These
thermal ratings are usually calculated using conservative assumptions about the transmission-
line operating environment such as static weather conditions, average wind speeds and
direction, average ambient temperatures, and solar conditions for summer and winter seasons.
While these assumptions are not worst case (e.g., based on absolute maximum ambient
temperatures, zero wind speed, or full solar exposure), there can be instances where the real
ratings based on actual conditions are lower than SLRs, putting the conductor at risk for
thermal damage and greater sag. Overall, SLRs produce an inflexible constraint that does not
take advantage of changing or favorable environmental conditions that allow for greater
transmission usage in many hours of the year.
Dynamic Line Rating
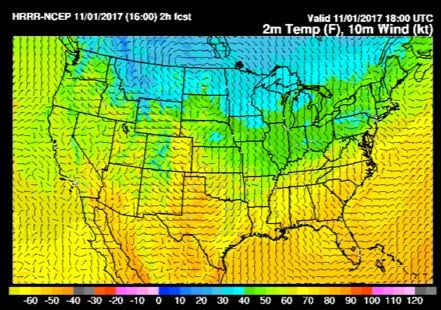
DLR is a blanket term for the many different technologies and methodologies for determining
conductor thermal ratings in a more-dynamic fashion using improved, more granular, or real-
time data. In principle, DLR uses the same heat-balance equations as SLR, but includes the
more-sophisticated time varying component, as shown in Figure 1. DLR can take various forms
and includes dynamic thermal line ratings, ambient adjusted ratings (AARs), real-time thermal
ratings, forecasted dynamic line ratings, and even analysis of existing lines with previously
gathered data.
Figure 1: Heat-transfer model for a conductor.
DLR technologies have traditionally been bifurcated into weather-based and asset-based
systems [11]. Weather-based systems focus on measurement of the environmental conditions
that are direct variables in the heat-balance equations. Field data collected include wind speed
and direction, ambient air temperature, solar radiation, and line current. Along with
engineering design criteria, these parameters are used to calculate the maximum allowable
Dynamic Line Rating | Page 4Department of Energy | June 2019
conductor current. Asset-based systems focus on measurement of the conductor itself and
include local conductor temperature, position or tension, and line current. These parameters
are used to establish relational results that are combined with the physical specifications of the
conductor to calculate the maximum allowable conductor current.
A comparison of the different systems and methodologies can be found in the “State of DLR
Technology” section of this report; a more detailed assessment is provided in literature [12].
While there are advantages and disadvantages of each system, the key distinction is whether
the system provides information on conditions and physical parameters of a single point along
a line or can be representative of the entire length of the line.
Potential Benefits of Dynamic Line Rating
The objective of all DLR systems is to help system operators determine, accurately and reliably,
the prevailing current carrying capacity limits of transmission lines to relax constraints based on
thermal considerations [13]. In some cases, the consideration of seasonal or monthly ratings
may help defer some infrastructure investments made for economic reasons or increase the
utilization of existing lines. DLR also has the benefit of improving reliability and resilience by
providing grid operators with enhanced situational awareness of individual assets, enabling
greater flexibility. DLR can be applied in a variety of circumstances and voltage classes, but is
particularly well suited to manage congestion on older lines, such as those at 115, 138, and
230 kV. While new lines may be designed to avoid a thermal limit, use of DLR can still be
beneficial by providing situational awareness and supporting asset management.
Improved Congestion Management
In the generator-unit commitment process, grid operators decide ahead of time which
generators to start up or shut down based on expected electricity demand and transmission
constraints. To perform the day-ahead security-constrained unit commitment effectively,
generator availability and transmission line capacity must be estimated. DLR technology,
enabled with transmission capacity forecasting (TCF) based on weather forecasting, can be used
to predict a transmission line’s capacity hours or days ahead of time. By forecasting the
expected transmission capacity more accurately, a more favorable commitment of generators
in day-ahead markets and more efficient dispatch within real-time markets will be possible,
thus reducing congestion costs.
The electric power system is becoming more dynamic with a need to make faster operational
decisions based on more rapidly changing conditions. Real-time monitoring of the grid can
support this need, especially as the mix of generation sources serving the country changes. For
example, the growth in variable renewable generation, such as wind and solar, is introducing
greater uncertainty and intermittency. The retirement of coal and nuclear plants and the
addition of new natural gas plants are also changing power flows and reliability requirements
for the system. When an unexpected event happens (e.g., an unplanned contingency, load- or
wind-forecast error), transmission congestion can occur and grid operators may curtail
generation [14]. DLR integrated into real-time operations can help better manage congestion
and associated costs during these changes and events.
Dynamic Line Rating | Page 5Department of Energy | June 2019
For example, ISO-NE realized significant consumer savings when it implemented AARs on
transmission ties with New York during the 2018 “bomb cyclone.” At the time, much of the grid
in the northeast was heavily congested due to high electricity demand and fuel supply
constraints. ISO-NE issued an abnormal-conditions alert and increased their transmission line
ratings to allow for greater capacity [15]. An ISO-NE report stated, “. . . the scheduling limit on
the NY ties was increased from 1,400 to 1,600 MW. The increased limit was made possible by
the cold conditions which helped to improve thermal transfer capability [16].”
It is widely accepted that implementation of DLR can provide congestion-management benefits.
However, no comprehensive study has been conducted to assess the potential cost savings
from widespread deployment of DLR in the U.S. across a variety of scenarios.
Increased Reliability and Resilience
Under NERC reliability rules, a power system must be operated so that it will remain stable
despite the instantaneous loss of any single transmission line or generator (i.e., N-1 contingent).
Grid operators and planners manage the system by ensuring there is enough spare capacity on
other transmission lines and equipment so that a contingency will not overload those lines. In
the event of overloads, relay settings may trigger protective actions that can lead to
interruptions or outages. DLR can potentially improve reliability by calculating the true thermal
limit for those lines and informing relay settings used to protect transmission equipment [9].
Furthermore, in cases where a customer’s supply might normally be disrupted to ensure system
stability, the additional capacity from DLR can alleviate the situation and provide a means to
avoid an outage, improving reliability metrics.
Another benefit of installing sensing and monitoring technologies like DLR is an increased
situational awareness of the transmission system. Understanding when conditions may exceed
constraints is critical in situations where lines may sag below clearances, making the system
vulnerable to faults and safety hazards. Enhanced situational awareness can help ensure lines
are not overloaded and, in effect, increase reliability metrics as well as protect the public from
consequent issues of safety (e.g., fire or electric shock). Condition-based monitoring of
transmission lines is also a possibility; rather than relying upon engineering assumptions and
maintenance schedules, real-time status of the line can be used in decision making to mitigate
component failures, boosting reliability.
FERC has stated that it understands resilience to mean “[t]he ability to withstand and reduce
the magnitude and/or duration of disruptive events, which includes the capability to anticipate,
absorb, adapt to, and/or rapidly recover from such an event [17].” Numerous power system
events can cause disruptions, including component failure, human error, weather events, and
damage—either unintentional or willful. Generally, methods, tools, and technologies that relax
constraints on a system, give it more flexibility, or provide better situational awareness increase
the resilience of the system. DLR can support more electric-delivery options during a disruption
to mitigate load interruptions and facilitate recovery and restoration after an event.
Dynamic Line Rating | Page 6Department of Energy | June 2019
Extreme events that cause electricity outages tend to have limited geographic scope; increasing
transmission capacity to allow more power to be imported into a region from neighboring areas
that are less affected by the event can increase grid resilience. DLR can be particularly
beneficial during certain extreme weather conditions, such as the 2018 “bomb cyclone” and
2014 “polar vortex” events, where extremely low temperatures and wind chill caused high
electricity demand and fuel prices, but also caused many generators to unexpectedly go offline
due to equipment failures and fuel-supply constraints. DLR would allow grid operators to take
advantage of the fact that colder temperatures and high winds in those events provided cooling
that greatly increased the thermal limits of transmission lines.
In the recent FERC proceeding on power system resilience, all independent system operators
explained the importance of transmission capacity for resilience. For example, the New York
grid operator explained that “[m]aintaining and protecting existing interconnections between
neighboring regions and continually assessing opportunities to improve interregional
transaction coordination can bolster the resiliency of the grid throughout an interconnected
region. These interconnections foster the opportunity for the Northeast and Mid-Atlantic
markets to rely on a broader, more diverse set of resources to meet the overall needs of the
region [18].”
III. State of DLR Technology
To operationalize DLR, several different technology components must be integrated into a
system. The most fundamental is a means to measure the parameters that impact the
transmission limits of a line. Obtaining these parameters can be accomplished through sensing
and monitoring of either the conductor itself or environmental conditions. A communications
channel must be established between the measurement apparatus and an analytics engine to
transport data in a timely manner. The analytics engine, usually a software application,
performs calculations or evaluations to translate measured parameters into information about
the transmission line. Finally, the information from this process must be integrated into a
control room or automated system where decisions are made.
Over the past several decades, a diverse set of technologies, methods, and systems have been
developed to support DLR. Each system and method has advantages and disadvantages when
it comes to accuracy, reliability, capital cost, ease of installation and integration, and maturity.
Research efforts have focused on improving state-of-the-art technologies and addressing some
of the barriers and limitations associated with implementing these different technologies and
approaches.
Sensing and Monitoring
There are several ways to measure or determine the parameters that impact a transmission
line. Table 1 lists some of the common sensors and methods used for DLR, including
advantages and disadvantages. As mentioned earlier, the primary approaches are divided into
Dynamic Line Rating | Page 7Department of Energy | June 2019
monitoring either the conductor directly or the environmental parameters that affect line
ratings. Direct conductor monitoring parameters, such as sag, tension, and clearance, are
measurements used to calculate the conductor temperature. Generally, direct conductor
monitoring approaches approximate the environmental conditions around the line, whereas
environmental parameter monitoring approaches approximate the conductor conditions. The
combination of measured and approximated parameters is used to dynamically rate the line.
Technology developers continue to seek the best combination of performance, cost, and ease
of installation for sensing and monitoring approaches. Direct conductor monitoring tend to
offer great accuracy and precision, but are challenged with installation and maintenance costs
associated with adequately covering all spans or segments of a line. Some of the line-mounted
sensor options may even require line outages, which impose additional costs. On the other
hand, environmental parameter monitoring may be more cost-effective but are limited in
accuracy by the location of weather stations and can face validation challenges. Both
categories of approaches can be used in combination to complement one another in other
solutions. While these various technologies and approaches have been verified in practice, the
electric industry has not standardized or converged on the most accurate, efficient, or cost-
effective methods for determining parameters.
Table 1: Common sensing and monitoring approaches for DLR.
Measurement Approach Description with Advantages (+) and Disadvantages (-)
Parameter
Devices like infrared thermometers/cameras are used to
measure conductor temperature from the ground.
Ground- + Temperature can be measured directly.
based + No line outage is required.
Sensor - Difficult to verify and validate calibration.
Direct Conductor Monitoring
- Susceptible to physical interference, which may
cause inaccurate readings.
Temperature
Thermocouples or thermistors are affixed onto the
conductor to measure its temperature.
Line- + Temperature can be measured directly.
mounted - Single point of measurement.
Sensor - May require line outage during installation or
maintenance.
- Difficult to verify and validate calibration.
Devices are attached to the conductor to measures the
mechanical force between the line and the structure.
Tension Monitor + Monitors physical characteristics of a conductor and
can benefit asset management (e.g., ice loading).
- Requires line outage to install.
Dynamic Line Rating | Page 8Department of Energy | June 2019
Measurement Approach Description with Advantages (+) and Disadvantages (-)
Parameter
Cameras monitor the distance a line has sagged. This is
accomplished through image processing techniques, or
Ground- or
with a target affixed to the line that the camera tracks.
Structure-
+ No line outage is required.
based
+ Monitors physical characteristics of a conductor and
Sensor
can benefit asset management.
Sag - Difficult to verify and validate calibration.
Devices that measure the inclination and vibration of a
line to determine the amount the line has sagged.
Line-
+ Monitors physical characteristics of a conductor and
mounted
can benefit asset management.
Sensor
- May require line outage.
- Difficult to verify and validate calibration.
Devices measure the electric fields emitted from a line
Ground-
to determine its distance above ground.
based
+ No line outage is required.
Sensor
- Susceptible to electromagnetic interference.
Devices mounted to the conductor that use sonar, light
detection and ranging, or a range finder to measure its
Clearance
distance to the ground.
Line-
+ Monitors physical characteristics of a conductor and
mounted
can benefit asset management.
Sensor
- Requires line outage to install.
- Twisting lines can rotate the device, causing
incorrect readings.
Given historical weather data and other data sources,
Numerical
predicts weather conditions through computation and
and
Environmental Parameter Monitoring
mathematics.
Statistical
+ Minimal to no specialized hardware required.
Methods
- Real-time predictions are error prone.
Weather-station sensors measure wind speed, wind
direction, temperature, and solar radiation.
Direct-
+ Environmental parameters can be directly measured.
Weather Measured
- Many weather stations required to monitor large
area.
A computational fluid dynamics model uses analysis of
Physics the terrain to map wind speed and direction from
Model with weather stations data to adjacent areas.
Direct- + A single weather station can effectively monitor a
Measured much larger area.
- Models take additional time to run.
Dynamic Line Rating | Page 9Department of Energy | June 2019
Measurement Approach Description with Advantages (+) and Disadvantages (-)
Parameter
- Requires large amount of geographic data.
Device uses a conductor material, placed close to and in
the direction of the line to be monitored, as a proxy for
the line. The material’s temperature is measured while
Conductor Replica it is heated electrically to determine the ambient cooling
conditions.
+ Does not require a line outage.
- Difficult to verify and validate calibration.
Communications
Successful implementation of DLR requires the ability to communicate between the sensing and
monitoring technologies and the control rooms or other decision systems in a timely manner.
Many different technologies—radio, cellular networks, satellite, fiber optics, and even physical
media—can be used as communication channels. However, the choice of technology will
depend on the monitoring approach as well as requirements of the application, especially when
it comes to data-transfer amounts and acceptable latency. For example, simple weather
stations only need to transmit a few environmental parameters to the control center. For these
small data packet applications, many existing technologies can be used, and the choice
becomes dependent on cost, terrain, and network availability. As the number of capabilities
and measured parameters increase for sensing and monitoring technologies, the
communications requirement will also increase.
As utilities and system operators begin to rely on DLR systems for control, dispatch, and market
decisions, the communications channel becomes a critical asset and will need to meet NERC’s
Critical Infrastructure Protection standards and requirements to ensure the authenticity and
integrity of DLR data. Corruption of this data from any cause, unintentional or deliberate,
becomes an operational problem that can have significant consequences. DLR system owners
or service providers need to concern themselves with the reliability of the communication
systems, including the cybersecurity of the sensing and monitoring technologies, the
communication channels, and the operating systems. Cybersecurity breaches can manifest as
data disruptions or poor data integrity that seek to invoke bad decisions or manipulate markets.
System operators will need strategies and solutions for detecting and mitigating problems in
communications.
Analytics Engine
The measured and approximated environmental and conductor parameters must be processed
in order to become useful information. In most cases, the raw sensing and monitoring data is
equated to the parameters measured without filtering or preprocessing to address potential
errors. The measured conditions are analyzed according to IEEE Standard 738 or CIGRE
Technical Brochure 2.12 to determine the steady-state or transient line current-carrying
capacity [19]. The information resulting from these calculations can then be integrated into a
Dynamic Line Rating | Page 10Department of Energy | June 2019
control room, usually through a software interface, or studied independently to improve
decision making.
Advances in models, methods, algorithms, and computational speed can change what is
possible. For example, forecasting DLRs from measured data can provide additional value over
what can be achieved with real-time information alone. Combining weather-forecasting
methodologies and analytics with DLR technology is still in its infancy. Several national weather
forecast models with high resolution could be used for this approach. An example forecast
from the National Oceanic and Atmospheric Administration with their high-resolution rapid-
refresh model is shown in Figure 2. This forecast gives wind speed and direction at 3 km spatial
resolution for heights that roughly correspond to those of overhead transmission lines.
As with any modeling and analysis process, confidence in the data input and the validity of the
processed output is critical. For example, wind speed and direction sensors can malfunction
due to age or weather conditions and provide incorrect readings. A means to detect such
anomalies in real time during the analysis would provide more confidence in decisions made
based on these sensors. Models utilized in the analytics may also have accuracy sensitivities
depending on the input range, requiring validation of models and the sensor data employed.
Methodologies for providing diagnostics and forensics when system components degrade or
fail are currently lacking from vendors. Similarly, assumptions made in developing models are
often not validated. Remedying these shortfalls could be key to greater trust of DLR
technologies in the long term.
Figure 2: Example National Oceanic and Atmospheric Administration wind and temperature forecast
(http://rapidrefresh.noaa.gov).
Integration
Integration into the control room is the most challenging step in implementing DLR because
“[t]he work in a control room is highly complex [20].” Adding more information to the control
Dynamic Line Rating | Page 11Department of Energy | June 2019
room may excessively tax operators. In theory, calculated information from the analytic engine
could first be read by the supervisory control and data acquisition (SCADA) system and then be
displayed to operators. The display methodology (e.g., visualization, human-machine interface)
most useful for system operators has yet to be agreed upon. Many control rooms have created
displays for their own use, such as the one developed by the Spanish utility Red Eléctrica de
España [21].
Making information actionable to the system operators is a primary concern; operators want a
maximized but stable line rating that ensures conductor temperatures do not rise to the point
where excessive sagging occurs. Depending on the implementation, DLRs can be noisy due to
their dependence on wind speed and direction that changes rapidly. Filtering steps to reduce
the volatility of information seen by an operator and methods to increase confidence in the
ratings can be performed as shown in Figure 3. The bright blue line shows DLRs in 30-minute
intervals with a 30 percent cap above the SLR, providing usability and ensuring safety, whereas
the light blue line shows the real-time, unfiltered DLRs. The orange and dark blue lines show
intermediate filtering steps. This is one example of how DLR data can be made more
actionable; DOE has also funded research on alternative ways to more effectively present DLR
data to system operators [20]. Overall, standardization of DLR data use and a baseline of
expected functionality and performance will be needed to facilitate control room integration.
Figure 3: Example DLR calculation with raw real-time, auto-regressive average, conductor temperature compensated,
and a 30-minute capped rating compared to static rating.
Barriers and Limitations
Despite DLR’s potential for realizing cost savings and its ability to increase grid reliability and
resilience, several barriers and limitations prevent widespread adoption. In general, hesitation
Dynamic Line Rating | Page 12Department of Energy | June 2019
exists in the largely risk-averse utility industry related to the use of unfamiliar technologies.
One common concern is the accuracy and reliability of DLR data and related lack of operational
knowledge and experience with the technology. Capital costs and installation complexities are
a barrier as well. Another important variable that explains lower deployment in the U.S.
relative to other countries is the different regulatory environments; the U.S. provides
transmission owners little incentive to deliver more power over existing lines.
Accuracy and Reliability
The accuracy and reliability of DLR is critical to successful deployment and realization of cost
savings, but inaccuracies can arise through both measurement and modeling errors [22].
Measurement errors include imprecise or inconsistent measurements and improperly
calibrated direct-measurement sensors. DLR systems can also malfunction, in whole or in part,
such as during a loss of communications connectivity. Additionally, some direct-measurement
sensors are not able to measure transmission line parameters accurately during periods of light
loading [23]. In these situations, there is always the option to revert to SLRs if the system is
aware of the malfunction.
Modeling errors encompass inaccurate mathematical rating models, weather forecasting
errors, and errors in collecting circuit topological and conductor data. For example, with older
power lines, the thermal and mechanical properties of the conductor may have shifted over
time due to aging and past use, yielding inaccurate results in clearance calculations. Similarly,
CIGRE has documented that emissivity of overhead transmission lines can also change as lines
age, affecting solar radiation impact and thermal-radiative properties [24]. Proper
characterization of the transmission line itself should be made prior to implementing DLR.
These various sources of error reduce confidence in the capability of DLR to perform accurately
and reliably. Developing methodologies and solutions to address these concerns will be critical
to broader DLR adoption. Some strategies currently under investigation have employed a
mathematically described confidence level within the DLR calculation, which rates the power
line more conservatively proportional to lower confidence parameters such as weather
predictions [25].
Operational Knowledge and Experience
As mentioned earlier, integrating DLR into control rooms requires accommodation. In a New
York Power Authority (NYPA) DLR demonstration, the learning curve and trust in measurement
accuracy were identified as challenges that might cause system operators to avoid adopting
DLR [13]. In addition to the learning curve, introducing DLR systems would require the
integration of a new terminal and additional training for employees. More importantly, a
dedicated effort to ensure the system is providing accurate real-time information is required.
Transmission operator feedback also suggest that they have limited time to make complex
decisions and need intuitive information, especially in emergency situations [20].
Despite these challenges, studies conducted by NYPA and Oncor are optimistic about DLR
implementation and offer remedies for control room integration issues: “One option is that a
team of devoted engineers would oversee the DLR software and server, another option is to
Dynamic Line Rating | Page 13Department of Energy | June 2019
outsource the software to a third party, and a third approach is to integrate the DLR system
directly into system operations [13]. ” The third approach, while comparatively more difficult,
is the most cohesive. One way to make this transition as seamless as possible, according to the
Idaho National Laboratory, would be to “integrate the DLR calculation in the operation system
behind the scenes and replace the original static line limit information with … [the new] DLR
information [20].” This approach would limit the information introduced on a system
operator’s display and would not increase an operator’s mental workload.
DLR also imposes a variety of risks in its implementation. For example, if a transmission line is
scheduled to operate above its static rating due to a forecast of strong winds (i.e., TCF), but a
change in weather causes a sudden drop in wind speeds in real-time, the line would then be
operating above its actual thermal limit. In this situation, there is an increased risk of
clearance-height violations or, in extreme cases, heating to the point that the material and
mechanical properties of the transmission line are degraded permanently. System operators
will likely need to back up this method with shorter-term forecasting and real-time weather
reporting to make operational decisions that protect assets and ensure safety. In general,
changes in line ratings would be additional variables that would have to be incorporated into
real-time dispatch decisions.
The use of enhanced ratings must also consider characterizing lines that run through vegetated
areas to ensure proper clearance above or around vegetation, in addition to ground clearances.
Vegetation near transmission lines pose a higher potential for wildfire risk, especially in
drought-ridden areas [26]. Net benefits from employing DLR could quickly be lost if conductors
become overheated or damaged due to incorrect sensor placement, inaccurate weather
predictions, or unforeseen circumstances, leading to premature degradation and replacement,
or other hidden costs.
Cost of Implementation
While relatively inexpensive compared to other transmission-capacity expansion and utilization
options, cost of DLR systems and their implementation are not insignificant. Identifying the
transmission line on which to install DLR and the specific technology to install can also prove
difficult. The current carrying capacity of a particular line or line segment is often restricted by
variations in wind cooling along the conductor [27]. For DLR to accurately and effectively
maximize a transmission line’s thermal rating, the length of the line being monitored needs to
be considered. Analysis is needed to determine the number of devices required and the
relevant locations that give a reliable and accurate rating for the entire line. Identifying these
“critical spans” is not trivial and will impact the cost of implementing DLR.
In a 2017 study by American Electric Power (AEP), a hypothetical DLR deployment on three
sections of the 22-mile Cook-Olive 345 kV transmission line in the AEP transmission zone of PJM
was simulated. With commercially available DLR systems, installation and implementation
would have cost approximately $500,000 and generated a net congestion savings of more than
$4 million in the year-long study [28]. This result would indicate a payback period of two
Dynamic Line Rating | Page 14Department of Energy | June 2019
months. As a point of comparison, if that line were economically upgraded, the cost would be
$22-$176 million based on a Pacific Gas & Electric cost-per-mile estimate [9].
Overall, there is an absence of studies analyzing the payback period for DLR under the current
technical landscape and power-system conditions. Improved studies are needed to better
quantify and understand the financial impacts (e.g., costs and benefits) of DLR, especially for
utilities and transmission owners, to overcome conservative assumptions that can impede
implementation.
Monetization of Benefits
While DLR can lead to cost savings, these savings may not accrue to the financial benefit of
transmission owners in the U.S. to sufficiently incentivize them to deploy such systems and
other advanced transmission technologies (e.g., power flow controllers). This is due, in part, to
the financial regulatory structure for rate-regulated utilities. Transmission owners generally
can recover their prudently incurred expenditures for transmission under FERC’s rules.
However, under the current U.S. regulatory cost-of-service model, transmission owners receive
a return on invested capital rather than a premium for delivering more power over existing
lines or reducing transmission congestion. In addition, DLR involve many costs that are
classified as operational and maintenance expenses that are ineligible for inclusion in
calculating the return on equity (ROE), unlike physical assets. Thus, there may be a financial
incentive for utilities to deploy new transmission lines and other large facilities rather than DLR
to manage congestion.
While some FERC incentives are available for optimization of existing transmission facilities, to
date, few, if any transmission developers or operators, have sought such incentives. FERC has
recognized this issue in the past, noting in a 2012 policy statement providing guidance on its
transmission incentives that, “the Commission is concerned that its current practice of granting
incentive ROE and risk-reducing incentives may not be effectively encouraging the deployment
of new technologies or the employment of practices that provide demonstrated benefits to
consumers. Accordingly, the Commission remains open to alternative incentive proposals
aimed at supporting projects that achieve these ends [29].” By contrast, other countries, such
as the United Kingdom, have provided more direct and more comprehensive incentives for
transmission line optimization, which may have led to greater deployment of advanced
transmission technologies.
Additionally, many utilities may not be ready to address the challenges of incorporating DLR
into their control rooms. Instead, they opt to use SLRs, focusing on system safety, reliability,
and simplicity rather than the economic interest of consumers. This reflects the fact that
economic benefits of enhancements to existing transmission systems generally accrue to the
consumer, rather than the utility or transmission owner, and so become a secondary
consideration. As a group of researchers noted, “In the case of transmission congestion,
higher-cost generation is dispatched to meet load demand. Consequently, energy customers
may experience an increase in electricity prices in the form of congestion charges. Therefore,
Dynamic Line Rating | Page 15Department of Energy | June 2019
the owner of the constrained transmission line is not directly affected by such circumstances
and thus is not willing to remove the constraint [27].”
The interconnected nature of the electric grid also contributes to difficulty monetizing benefits.
For shorter transmission lines (i.e., typically up to 100 km), the maximum current carrying
capacity (i.e., loadability) is predominantly set by thermal limits while the maximum current
carrying capacity for longer transmission lines is usually set by voltage limits and stability
constraints [27]. Thermal limits tend to be higher than voltage or stability limits on longer lines,
as shown in Figure 4, limiting the applicability of DLR. Additionally, implementation of DLR can
move power flows to other lines, possibly voltage-limited lines or those owned by others,
adding complexity in how costs and benefits should be allocated.
Figure 4: Power-transfer limits in relation to transmission line length,
with loadability calculated per unit of surge impedance load (SIL)
IV. Stakeholder Views and Systems Impacts
The main benefit of DLR is the cost savings associated with utilizing existing equipment to carry
more power, allowing greater utilization of low-cost generating resources while offering a
potential low-cost alternative to spending millions of dollars on economic transmission
upgrades. Increased situational awareness and better data collection would also greatly benefit
a grid operator during regular operations or post-failure studies by providing more-relevant
data for decision making or analysis. Due to these benefits, DLR has been deployed and studied
domestically as well as internationally. However, the electric power system has numerous
stakeholders, ranging from regulatory commissions to consumer advocates, industrial users to
Dynamic Line Rating | Page 16Department of Energy | June 2019
equipment vendors to independent power producers, in addition to utilities. Understanding
their perspectives on DLR is important to broader adoption. Additionally, there are other
system impacts that need to be considered in order to mitigate unintended consequences.
Case Studies
DLR is a technology option that has been available for 20 years, but has yet to see wide-scale
adoption. However, several prominent small-scale investigations of DLR have been performed
and examples of commercial products that measure the effects of line heating have been
tested. Table 2 lists these known case studies (i.e., analyses, pilot implementations, and
installation of commercial products) along with a description of the experience. While these
results are generally positive, outcomes are difficult to extrapolate beyond the targeted lines.
Table 2: DLR case studies.
Entity Year Experience
REE: Spain 1998 400 kV transmission lines around Madrid were instrumented
and the data stream was incorporated into the control room.
DLRs showed promising headroom for increased line capacities
[21].
Northern Ireland 2009 DLR was explored to address congestion from wind farm
Electricity expansions. A 110 kV line was instrumented and studied,
showing that line ratings could be increased by 10% to 20% in
most remote locations, and by 26% in some cases [30].
RTE: France 2011 A sag sensor was tested on several 400 kV lines in France and
found to be accurate enough to be used in ampacity
calculations. However, they felt more research is needed to
properly integrate the new data into control rooms [31].
Kepco 2013 The South Korean utility analyzed DLR for several transmission
lines to address concerns with outage rates on parts of their
system. DLR was found to allow maximum loading to increase
by 35% over current values safely [32].
NYPA 2013 The demonstration project evaluated a variety of DLR systems
and technologies, and how they could be used in transmission
system engineering, operations, and planning. They found a
positive correlation between increased real-time capacity and
increased wind generation, and capacity increases of 30 to 44%
over static ratings [13].
Oncor 2013 The demonstration project focused on monitoring an entire
transmission line and included DLR integration into control
systems. They observed capacity increases between 6 and 14%
over AARs, available over 83% of the time. Additionally, they
determined their DLR system could increase line capacity, on
average, between 30 and 70% relative to static ratings [13].
Dynamic Line Rating | Page 17You can also read