DSV-Panalpina Market update - April 2021
←
→
Page content transcription
If your browser does not render page correctly, please read the page content below
DSV-Panalpina
                                                      Market update
                                                               April 2021

1 | DSV – Market update Air & Sea April 15th , 2021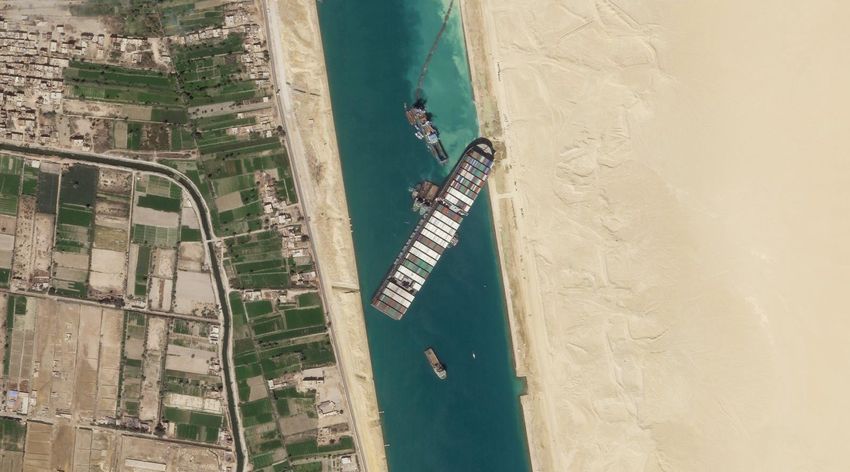
Content

    1           COVID-19 Overview

                 Suez Canal Blockage
    2            “ripple effect”

    3           Ocean freight update

    4            Airfreight update

2 | DSV – Market update Air & Sea April 15th , 2021
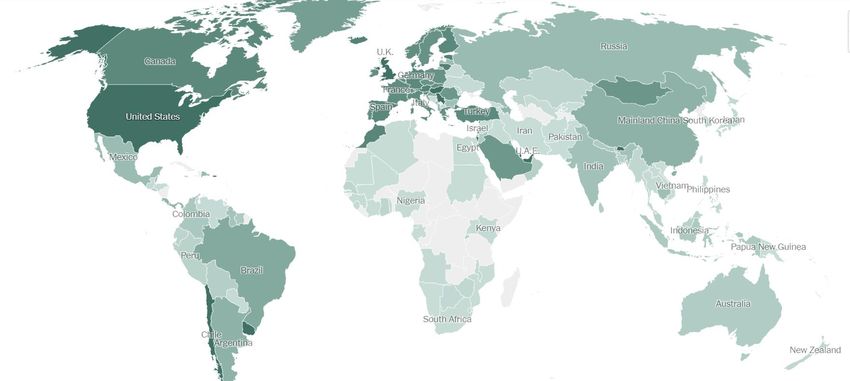
More than 825 million vaccine doses have been administered
 worldwide, equal to 11 doses for every 100 people
 The number has growth 3x compared to one month of March and we expect an exponential growth as we have
 more vaccines available
                                                                                              Doses Administered       Pct. of population
                                                                                               Per 100
Dosis administered per 100 people                                                               People        Total Vaccinated Fully Vaccinated
                                                                                 World              11 824,878,017           –                –
                                                                                 Israel            116 10,290,033          60%            56%
                                                                                 Seychelles        112     108,749         68%            45%
                                                                                 U.A.E.             95    9,156,728           –              –
                                                                                 Chile              65 12,259,848          40%            26%
                                                                                 Bhutan             63      476,74         63%               –
                                                                                 Bahrain            63     989,363         37%            26%
                                                                                 U.K.               60 40,107,877          49%            12%
                                                                                 United
                                                                                                    58 192,282,781         37%            23%
                                                                                 States
                                                                                 Maldives           55     283,753         52%            3.0%
                                                                                 Monaco             53        20,51        30%            23%
                                                                                 San Marino         52      17,707         28%            24%
                                                                                 Malta              52        249,4        36%            15%
                                                                                 Hungary            44    4,327,732        31%            13%
                                                                                 Serbia             41    2,882,854        25%            17%

https://www.nytimes.com/interactive/2021/world/covid-vaccinations-tracker.html

 3 | DSV – Market update Air & Sea April 15th , 2021
Global COVID-19 Freight Restrictions Overview
Fully vaccinated travellers are less likely to get and spread COVID-19.
                                                      COVID-19 Travel Regulations Map as per IATA

                                                                                                                                                                ASIA PACIFIC
   EUROPE
                                                                                                                                                                China: China has restricted entry and
   Europe is on lockdown until April   30th                                                                                                                     transit to all travelers except Chinese
   Travelers are subject to a 7-day isolation                                                                                                                   nationals, Hong Kong, Macau, or Taiwan
   period and take another COVID-19 PCR                                                                                                                         passport holders, and travelers with
   test at the end of this period.                                                                                                                              diplomatic, service, courtesy, or C visas,
                                                                                                                                                                or visas issued after March 28, 2020.
   UK: From March 8, passenger traveling
   abroad will need to carry a new travel                                                                                                                       South East Asia: Most countries have
   declaration form stating that their trip is                                                                                                                  banned the entry until end of April with
   permitted under UK national lockdown                                                                                                                         potential extension
   rules..
                                                                                                                                                                INDIAN SUB-CONTINENT.

   NORTH AMERICA                                                                                                                                                India:.Until April 30th passenger planes
                                                                                                            Source:https://www.iatatravelcentre.com/world.php
                                                                                                                                                                are banned to enter the country.
   People who has been in EU and UK                                                                                                                             Cargo planes are allowed to enter the
   during last 14 days or residents from                                                                                                                        country.
   those countries are banned the entry to
   USA, this does not apply to nationals or                                                                                                                     Sri Lanka: Flights has been suspended.
   permanent residents in USA
                                                                                                                                                                Bangladesh and Pakistan: Passengers
   LATIN AMERICA                                      AFRICA and MIDDLE EAST                                                                                    must present a negative PCR before
                                                                                                                                                                entering
   All flights from UK and South Africa are           South Africa All passengers must present a negative corona virus test and they are only
   suspended to Argentina, Brazil, Chile etc          allowed to travel to 3 airports, Cape Town, Durban and Johannesburg.

                                                      Saudi Arabia Restrictions to travellers coming from Argentina ,Brazil, India South Africa
                                                      and United Kingdom

4 | DSV – Market update Air & Sea April 15th , 2021
Suez Canal Blockage
“ripple effect”

5 | DSV – Market update Air & Sea April 15th , 2021
A total of ~340k TEU is estimated to have been delayed by
the Suez Canal blockage
Raw materials and consumer goods form more than half of containerized Suez ocean trade

Breakdown of AsiaEurope containerized ocean trade by commodity                                                                     Delayed demand is about to arrive in
% of Teus                                                                                                                            Europe, potentially overwhelming ports…
                                                                                                                                     Container vessels in European waters, April 7th

                                                                                                                                      Source: Marinetraffic.com

Note: Shares of TEUs rounded to the nearest percentage; 1) Based on historical average (2017-2019, excluding 2020 due to COVID effects) volumes (bidirectional) between Asia
and Europe in March, assuming trade was blocked for seven days; Source: Seabury Cargo Global Ocean Trade database, Seabury Cargo analysis (April 2021)

6 | DSV – Market update Air & Sea April 15th , 2021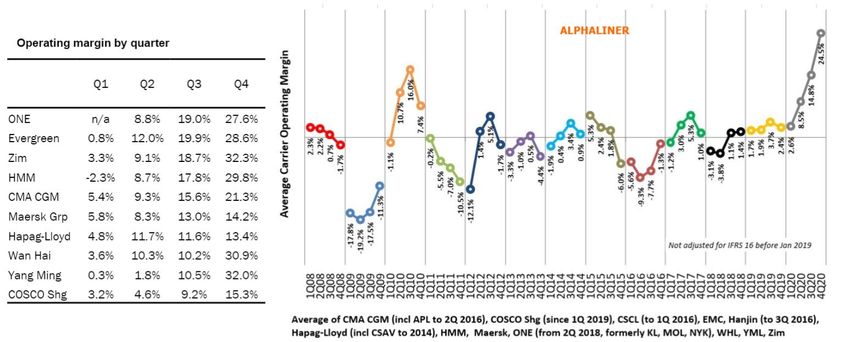
Suez blockage: Suez Canal blockage by Ever Given impacts
    the available vessel capacity in April and May heavily
          Change in weekly capacity from before to        Change in weekly capacity from before to      Change in weekly capacity from before to
          after Suez Blockage ASIA-MED                    after Suez Blockage ASIA-N.Europe             after Suez Blockage N.Europe-ASIA

•      Even though the Ever Given has been freed, the direct –and substantial -operational ripple effects are now clearly visible for the
       coming months on the Asia-Europe services, in both directions. Blank sailings announced for week 15 and week 18

•      As a consequence of the blockage, vessels have already been diverted around Africa and will continue on this routing,impacting
       the ability to maintain the schedules announced just a few weeks ago. And this impacts the trade through Suez in both directions.

•      We can see a drop of capacity (depending of the shipping line) of -20% to 30% on week 19-21 and for the exports out of Europe the effect is
       happening now. This will have a consequence as well on equipment repositioning                                             Source: Seaintel

    7 | DSV – Market update Air & Sea April 15th , 2021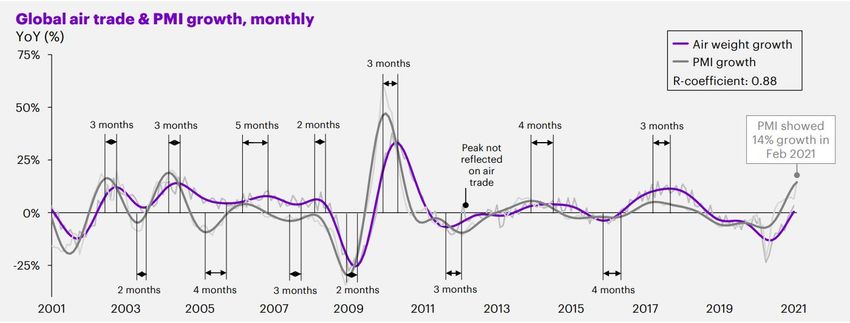
Declaration of General Average of the Ever Given vessel
Additional cost for cargo owners without cargo insurance to release their cargo from Ever Given in the future.

                                                           •   General Average is special for transport by sea, as it means that all
                                                               parties having anything of value on board a ship shall participate to the
                                                               costs for saving the ship and cargo.
                                                           •   Lloyd’s List has reported that Egypt is looking to claim around
                                                               $1bn in compensation for the casualty that closed the Suez Canal
                                                               for six days last month, according to the head of the Suez Canal
                                                               Authority.
                                                           •   The shipowner has declared GA for the costs incurred, including for
                                                               the salvage operation, to protect the ship and the cargo and to
                                                               continue the intended voyage.
                                                           •   These costs will eventually be divided proportionally between the
                                                               cargo interests based on the values of the cargo.
                                                           •   The shipowner will have a lien on the cargo and shippers as cargo
                                                               owner may only have their cargo released from the shipowner when
                                                               proper security inform of an Average Guarantee (signed by cargo
                                                               Insurers) have been completed, signed and forwarded to the Average
                                                               Adjuster.
                                                           •   If cargo is not insured ,the security in form of an Average Bond shall
                                                               be completed and signed and a cash deposit will be required instead
                                                               of an average guarantee. The security is needed by the shipowner to
                                                               secure their payment of contributions for their costs incurred.

8 | DSV – Market update Air & Sea April 15th , 2021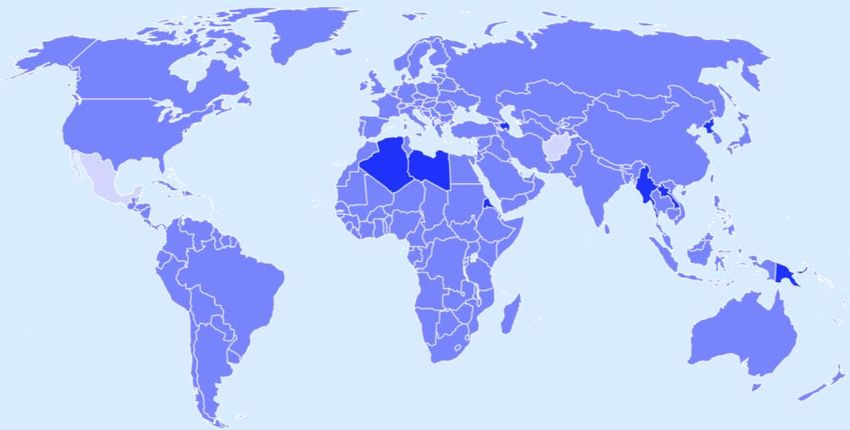
Suez canal blockage: A small fraction of impacted ocean demand
Asia-Europe trade could shift to air, for either of two main
reasons
High demand for finished articles                                                          Components to finish
Example: Laptops                                                                           Example: Laptops

                                                                                                                                                                 •   In addition, short shelf life of
                                                                                                                                                                     products (e.g. perishables)
                                                                                                                                                                     may require air transport

Note: Showing average value densities for Westbound (Asia Pacific to Europe) air and ocean trade in March 2017, 2018 and 2019; 1) 50% of the average air value
density of $150/kg; Source: Seabury Cargo Global Air and Ocean trade databases; Seabury Cargo analysis (April 2021)

9 | DSV – Market update Air & Sea April 15th , 2021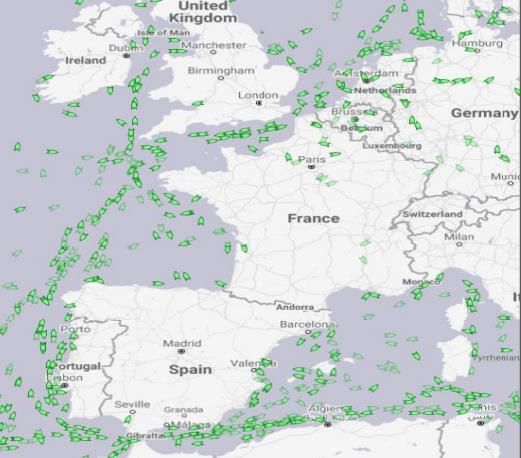
Ocean freight
                                                       Update

10 | DSV – Market update Air & Sea April 15th , 2021
MSC well on track to become the world’s largest container line
MSC vs Maersk Group – Fleet capacity history
• MSC currently operates a fleet of 587 containers ships which have
a total carry-ing capacity of 3,892,732 teu.
• Since Maersk’s fleet of 711 ships has a slot ca-pacity of 4,126,740
teu, the ‘gap’ between the two partners of the ‘2M Vessel Sharing
Agreement’ now stands at ‘only’ 234,000 teu.
• Irrespective of past de-velopments and fleet growth, the carriers’
opposing stance on container vessel newbuilding is expected to
see MSC overtake its Danish competitor and claim the global top-
spot some time in 2022
• MSC’s pipeline could grow even further, since a number of big
new buildings are believed to be joining the MSC fleet under long
term charters that have yet to be confirmed. Maersk meanwhile is
not expected to place any large orders soon.
Source: Alphaliner
11 | DSV – Market update Air & Sea April 15th , 2021Aggregate operating earnings top Shipping lines USD 15 Bn in
2020
Main carriers: Average core EBIT margin by quater
• The container shipping operations of the nine leading carriers reporting public numbers recorded an aggregated operating income of USD 15.1 Bn
in 2020, up from USD 4.8 Bn recorded in 2019, underlining the stark impact of COVID-19.
Source: Alphaliner
12 | DSV – Market update Air & Sea April 15th , 2021USA and EUROPE port Congestion is not improving
Terminal congestion is not improving and in North America Intermodal congestion is also not improving
Average US Port congestion (New York, Savannah, Houston and Los
Average port congestion 5 days, Europe Main ports
Angeles, 10 days delay
• Port congestion is becoming an issue in Europe with delays above 5 days and in north America reaching to almost two weeks
• We are reaching all time high in terms of port congestion and it is not improving, it seems that it is maintaining a plateau level
• Carriers are still announcing void sailings to avoid more congestion on the ports (both Asia, US and Europe)
Source: Alphaliner and Seabury
13 | DSV – Market update Air & Sea April 15th , 2021Trade Update
Asia Pacific Equipment Situation
Container shortage & Poor schedule reliability:
• All equipment types remain tight across Asia.
• Capacity discipline among carriers is expected to
continue.
• Shipper should consider booking as early as
possible 3-4 weeks in advance.
S= SURPLUS OF CONTAINERS
D= DEFICIT OF CONTAINERS
14 | DSV – Market update Air & Sea April 15th , 2021Worst vessel performance ever recorded: 34,9%
Global Port congestion is increasing transit time to now almost 7 days
Schedule Reliability Average delay of late vessels
8.00
90.0%
80.0% 7.00
70.0% 6.00
60.0% 5.00
50.0% 2020
2020 4.00
40.0% 2021
2021
3.00
30.0%
2.00
20.0%
10.0% 1.00
0.0% 0.00
JAN FEB MAR APR MAY JUN JUL AUG SEP OCT NOV DEC JAN FEB MAR APR MAY JUN JUL AUG SEP OCT NOV DEC
Source: Sea-Intelligence Maritime Analysis
15 | DSV – Market update Air & Sea April 15th , 2021Bunker price continue upward momentum
800
700
600
• Following a sharp drop in bunker fuel
VLSFO prices in Mar-Apr 2020 due to the
500
IFO380 pandemic, prices then have started to
rebound and stabilize
400
• Fuel price have begun to increase
300 significantly Jun – early Nov 2020
200 • Can anticipate for BAF increase in line
with the continuing upward trend in
100 VLSFO price
0
Source: Ship&Bunker
16 | DSV – Market update Air & Sea April 15th , 2021Ocean Freight Asia - Europe
Suez Canal blockage by Ever Given impacts the available vessel capacity in April
and May heavily
SCFI – North Europe WB Rate Index Rates remain stable at slow pace
(US$/40ft)
SCFI Levels Week 14-2021:
• Shanghai – North Europe: USD 7,928/ FEU
$9.300
• Shanghai – Mediterranean: USD 8,052/ FEU
$8.300
$7.300
Spot market rates are on high level, with challenges to
find space
$6.300
$5.300 • Empty Equipment flow is disrupted by the Suez Canal
blockage
$4.300
$3.300 • Previous equipment situation in March was under
control but tight. Going forward, carriers will have
$2.300
severe equipment issues in Q2 again.
$1.300
• Demand is not strong but exceeding the limited
allocation by far.
Source: SCFI Week 14
17 | DSV – Market update Air & Sea April 15th , 2021Ocean Freight Asia - North America
Strong demand and lack of equipment maintains rates in all time high
SCFI Transpacific EB Rate Index (US$/40ft)
$4.300 All lines are now short on equipment, 40‘HC boxes are
in short supply.
$3.800 SCFI Levels Week 14-2021:
• Shanghai – US West Coast: USD 3,931/ FEU
$3.300 • Shanghai – US East Coast: USD 5,334/ FEU
Lines are now blanking sailings to LAX due to the
$2.800 congestion
$2.300
• There is still a strong demand in the trade and it is
expected new services and capacity to be added.
$1.800 • We expect demand to remain strong after could remain
into October and beyond
Source: SCFI Wekk 14 2021
18 | DSV – Market update Air & Sea April 15th , 2021Ocean Freight Asia – South America (East Coast)
The ocean freight market is far from stable and rates are going up/down everyday.
SCFI to Santos Brazil (US$/40ft)
$17.000
$15.000
SCFI Levels Week 10-2021:
$13.000 • Shanghai – Santos: USD 14,310/ FEU
$11.000
Capacity remains unchanged, except for announced blank
$9.000
sailings, equipment in Asia is an issue eventhough demand
$7.000 is not strong
$5.000 - ECSA: Average of 30K TEU/week supply + European
routing (adding up to 8-10%).
$3.000
$1.000
- WCSA/MEX : average of 78K TEU/week supply.
Source: SCFI Week 14-2021
19 | DSV – Market update Air & Sea April 15th , 2021Ocean Freight Europe – Asia
Full ship scenario continues
Drewry Rotterdam Shanghai (US$/40ft)
$2.000
Drewry Levels Week 14-2021:
$1.900
• Rotterdam – Shanghai: USD 1,465/ FEU
$1.800
$1.700
Allocation of space is a big problem in the trade
$1.600
$1.500 • Some carriers have introduced temporary booking stops
$1.400 in order to cope with the surging export demand
$1.300 • Port congestion and the on-going equipment shortage is
$1.200 creating massive operational challenges
$1.100
• Several Post-CNY blank sailings expected for 2nd half
$1.000 of March/early April. Details to follow
Source: Drewry Week 14-2021
20 | DSV – Market update Air & Sea April 15th , 2021Ocean Freight Europe – North America
Rates are increasing – Bookings required well in advanced
Drewry Levels Week 14-2021:
• Rotterdam – New York: USD 2,601/ FEU
Drewry Rotterdam New York (US$/40ft)
$4.000
$3.800 Bookings need to be places 6-8 Weeks in advanced
$3.600
• Rates are being added various surcharges like PSS,
$3.400 EIS, EBS etc. Expect a GRI to be announced in
$3.200 February to become effective by latest April 1, 2021
$3.000 • Equipment deficit in most origin regions in Europe. This
$2.800 will remain the biggest issue for quite some time.
Carriers charge EIS/EBS to cover empty moves,
$2.600
although no guarantee from carriers that they can
$2.400 provide the needed containers.
$2.200
• Port concession is adding to the problem, situation is
$2.000
critical
• Bunker oil prices are on a upturn, we expect carriers to
charge higher BAF in March + Q2
Source: Drewry Week 10-2021
21 | DSV – Market update Air & Sea April 15th , 2021Ocean freight market overview – High rates will remain on Q2
TRADE LANE COMMENTS RATES AND SPACE
• Empty Equipment flow is disrupted by the Suez Canal blockage
ASIA to Europe • Spot Market rates are on a high level anyway already.
• Long term rates will increase
• Rates steady at historical highest levels.
ASIA to NAM • Equipment shortage, specially in Vietnam and South east Asia.
• Ships are waiting at anchor in LAX, Oakland and Savannah
• The need of equipment is affecting all trades globally
• Vessel are full and less capacity available
Europe to NAM
• Congestion (Port facility) surcharge for the port of New York applied by Ocean Carriers. This
is applicable for all cargo to and from Europe
• Low vessel-transit-time reliability, and congestion at major terminals.
Exports from • Post-Suez vessel bunching expected at key India ports, causing more downstream delays.
India Suggested booking 15-20 days prior to CRD.Space is tight
• Booking needs to be placed one month in advance
ASIA to LATAM • ASIA to LATAM due to longer transit times needs to offset with higher rates
• Rates are stable
• Port congestion at most of Asian ports
INTRA ASIA • New bunker level. Australian ports are still congested but improving
• Average Intra asia rate level have eased slightly and stabilised but is still overall higher
22 | DSV – Market update Air & Sea April 15th , 2021Airfreight Update 23 | DSV – Market update Air & Sea April 15th , 2021
The Purchasing Managers Index hints at strong air freight
demand in the coming months

  Global air trade & PMI growth, monthly
  YoY (%)

                                                                                                                                    Double-digit PMI
                                                                                                                                    growth has not been
                                                                                                                                    recorded for almost
                                                                                                                                    10 years

Notes: Air trade values until January 2021 (in weight); PMI values until February 2021; PMI is JP Morgan Global Manufacturing PMI
Source: Market Economics, Seabury Cargo Global Air Trade Database; Seabury Cargo analysis (April 2021)

24 | DSV – Market update Air & Sea April 15th , 2021
Leading indicators for China, USA and EU indicate a
recovery at different speeds in the short term
Capacity
constraints will
be the limiting
factor to air
cargo export
demand
Note: forecasts made based on following correlation factors (R): China=0.79; USA=0.80; EU=0.85; Air trade values until December 2020 (in weight); PMI values
until February 2021, CLI values until February 2021; This forecast does not consider potential impacts of the coronavirus outbreak on air trade Source: Markit
Economics; OECD; Seabury Cargo Global Air Trade Database; Seabury Cargo analysis (April 2021)
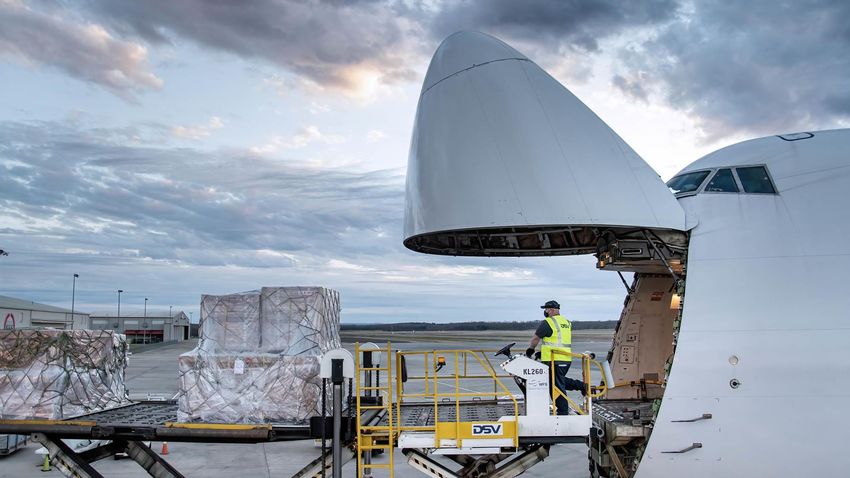
25 | DSV – Market update Air & Sea April 15th , 2021Air cargo capacity still down 7% YoY in Q1 2021
After strong declines in 2020, air cargo demand completed
its recovery to 2019 levels in January
International air cargo capacity growth, Jan – Mar 2021
% growth vs last year
Global capacity decline: -7%
The Transpacific and Asia to Europe were the only trade lanes showing positive capacity growth rates in Q1 2021
Note: Arrow thickness representative of May 2020 capacity, direct flights only; all flows indicate region-to-region capacity; regions are indicated by color coding; all dates measured in UTC; 1) Total cargo capacity includes
international widebody passenger and all freighter flights; 2) Comparing capacity between 22 Feb- 7 Mar 2021 to capacity the same weeks in 2019; Source: Seabury Consulting Capacity Tracking database, Seabury Consulting Source: Seabury
analysis (March 2021)
26 | DSV – Market update Air & Sea April 15th , 2021The air cargo demand-supply imbalance has pushed load factors
and yields to historically high levels
International load facto development Gross airline yields
FTK/ATK (%) $/kg (quarterly average)
• Load factors have
increased 20% since the
beginning of the pandemic
Notes: Gross yields based on IATA cargo eChartbook (until October 2019), WACD yield data (until Feb 2021); FTK & ATK data based on IATA Carrier Tracker CTK
and ACTK, respectively, through Jan 2021; Source: IATA eChartbook; IATA Monthly Traffic Results; IATA Air Freight Monthly Analysis; WorldACD website;
Seabury Cargo analysis (April 2021
27 | DSV – Market update Air & Sea April 15th , 2021A year after the outbreak of COVID-19, freighters (+25%)
keep driving global capacity recovery
Weekly international air cargo capacity, Feb 2020 – Mar 2021
Thousand of tons
• Belly cargo capacity
recovers slowly; though is
still 47% below pre-COVID-
19 levels
Note: Direct international capacity only; All freighters and widebody passenger aircraft only; 1) Comparing capacity between Jan – Mar 2021 vs Jan – Mar 2020
Source: Seabury Cargo Capacity Tracking database, Seabury Cargo analysis (April 2021
28 | DSV – Market update Air & Sea April 15th , 2021Air exports recovery is no longer exclusive to North East Asian
countries
Air exports by origin region, Jan 2020 – Jan 2021
Index (Jan 2020 = 100)
• The speed of recovery
still varies by region;
North America and Asia
Pacific (excl. NEA) are
the latest regions to
return to pre-pandemic
levels
Source: Seabury Cargo Global Trade Database, Seabury Cargo analysis (April 2021)
29 | DSV – Market update Air & Sea April 15th , 2021Automotive (+24% YoY increase) and high tech (+8%) led demand
recovery in the last quarter
Industry summary, Nov 2020 – Jan 2021 Top/bottom commodities, Nov 2020 – Jan 2021
Air weight change (tonnes) and growth (%) Air weight change (thousand tonnes) and % growth
Source: Seabury Cargo Global Air Trade Dashboard; Seabury Cargo analysis (April 2021)
30 | DSV – Market update Air & Sea April 15th , 2021Many widebody passenger aircraft orders have been deferred
while freighter orders have increased vs. last year
Change in planned widebody aircraft deliveries 1 Apr 2020 vs. 1 Apr 2021
Number of Aircraft
• ~1,900 widebody
passenger aircraft are
still parked despite the
belly capacity
Note: Snapshot of order book as of the first day of the month; Showing widebody aircraft only; 1) Including aircraft that are already delivered in 2020; 2) Aircraft ordered
by UPS, FedEx and DHL; 3) Difference of total orders as of 1 April 2021 and orders as of 1 April 2020. Aircraft orders that have been deferred to after 2029 are
considered as cancellations; 4) Total planned deliveries from 2020 to 2029, including aircraft already delivered in 2020; Source: Cirium Fleet Database, Seabury Cargo
analysis (April 2021)
31 | DSV – Market update Air & Sea April 15th , 2021Asia Pacific has shown the strongest recovery in air
imports, registering positive YoY growth in Jan’21
Global air import change by region, Jan 2020 – Jan 20211
Thousand tonnes change
Air imports of all other
regions have (almost)
recovered to Jan’20
levels
Notes: 1) Comparing against same month previous year
Source: Seabury Cargo Global Air Trade Database, Seabury Cargo analysis (April 2021
32 | DSV – Market update Air & Sea April 15th , 2021Air freight market overview
Many shipper
TRADE LANE COMMENTS RATES AND SPACE
• The story in Asia continues to be capacity. With market demand at peak levels,
Exports from
capacity is being further constrained pushing rates to the highest levels of the
China / Hong Kong
year. We see a ramp up of volumes by the beginning Q2.
• North Asia (Korea/Japan) and Southeast Asia markets are very busy and yields
Exports from JP, KR and continue to climb as demand exceeds available capacity.
South Asia • The yield difference between these markets and China is approaching $4-5 per
kg.
Exports from • Lack of space and high rates
India/Bangladesh • Limited capacity available (limited PAX) and strong demand at the moment
• Trans-Atlantic market continues to be very strong in both directions as demand
outstrips capacity.
Export from Europe
• Cargo is taking between 5-7 days minimum for uplift so please plan ahead and
be patient with transit times.
• US Export market is strong to both Europe and Asia. The backlogs to Europe
are especially acute and transit times are much longer than normal. With the
Exports from NAM
continued drought of belly capacity, expect these conditions to continue into the
foreseeable future.
33 | DSV – Market update Air & Sea April 15th , 2021You can also read