Dr. Gema BONALES-DAIMEL - Complutense University of Madrid. Spain. . RUA
←
→
Page content transcription
If your browser does not render page correctly, please read the page content below
Revista Mediterránea de Comunicación (RMC)
                                                                                                                                         Mediterranean Journal of Communication (MJC)
                                                                                                                                                                       ISSN: 1989-872X

                                                   Dr. Gema BONALES-DAIMEL
                                                   Complutense University of Madrid. Spain. gbonales@ucm.es. https://orcid.org/0000-0003-2085-2203

                                                   Dr. Luis MAÑAS-VINIEGRA
                                                   Complutense University of Madrid. Spain. lmanas@ucm.es. http://orcid.org/0000-0001-9129-5673

                                                     The evolution of advertising investment during a decade of economic crisis (2007-2018).
                                                                The case of the automotive sector and its adaptation to the Internet
                                                   Evolución de la inversión publicitaria durante la década de crisis económica (2007-2018).
                                                                  El caso del sector del automóvil y su adaptación a Internet

                                                   Dates | Received: 09/11/2020 - Reviewed: 08/02/2021 - In press: 07/04/2021 - Published: 01/07/2021

                                                   Abstract                                                                Resumen
                                                   The economic crisis and the emergence of                                La crisis económica y la irrupción de la
                                                   technology - led by the Internet - has resulted                         tecnología -liderada por el medio Internet-
                                                   in a real transformation in advertising, and in the                     han provocado una auténtica transformación
                                                   automobile market. In recent years, the industry                        del sector de la publicidad y del mercado del
                                                   and, specifically, the automobile industry, has                         automóvil. En los últimos años, las industrias, y
                                                   realised the power of the Internet because it                           más concretamente la automovilística, se han
                                                   is an interactive medium, affording it a major                          dado cuenta del poder que ejerce Internet -por
                                                   role in corporate communication strategy                                tratarse de un medio interactivo-, dotándole
                                                   by enabling it to contact millions of potential                         de gran protagonismo en la estrategia de
                                                   customers who spend more and more time                                  comunicación corporativa         al    permitirles
                                                   online (Armstrong, 2001). This research sought                          contactar con millones de potenciales clientes
                                                   to examine, based on a content analysis, the                            que cada vez pasan más tiempo conectados
                                                   evolution of investment in the period in question                       (Armstrong, 2001). El objetivo de la presente
                                                   and any potential changes in advertising. The                           investigación es examinar a partir de un análisis
                                                   results suggest that technology has evolved in                          de contenido la evolución de la inversión
                                                   such a remarkable way as to have conditioned                            en el periodo analizado y los cambios en la
                                                   advertising. Specifically, the total amount                             publicidad, si los hubiera habido. Los resultados
                                                   of investment of the automotive industry in                             sugieren que la tecnología ha evolucionado de
                                                   advertising decreased by 61% from 2007 to                               una manera tan notoria que ha condicionado
                                                   2018, while Internet advertising grew by 83%                            la publicidad. Concretamente, la cifra de
                                                   over the same period (Infoadex, 2019).                                  inversión total de la automoción en publicidad
                                                                                                                           ha descendido un 61% en el periodo que va
© 2021 Gema Bonales-Daimiel, Luis Mañas-Viniegra

                                                                                                                           desde el año 2007 al 2018, mientras que la
                                                                                                                           publicidad en Internet ha crecido un 83% en el
                                                                                                                           mismo ciclo (Infoadex, 2019).

                                                   Keywords                                                                Palabras clave
                                                   Advertising   investment;             Internet;      media;             Inversión publicitaria; Internet; medios                      de
                                                   automotive; technology                                                  comunicación; automoción; tecnología

                                                   Bonales-Daimiel, G., & Mañas-Viniegra, L. (2021). The evolution of advertising investment during a decade of economic crisis (2007-
                                                   2018). The case of the automotive sector and its adaptation to the Internet. Revista Mediterránea de Comunicación/Mediterranean
                                                   Journal of Communication, 12(2), 227-243. https://www.doi.org/10.14198/MEDCOM.18155

                                                                                                                                                                                     227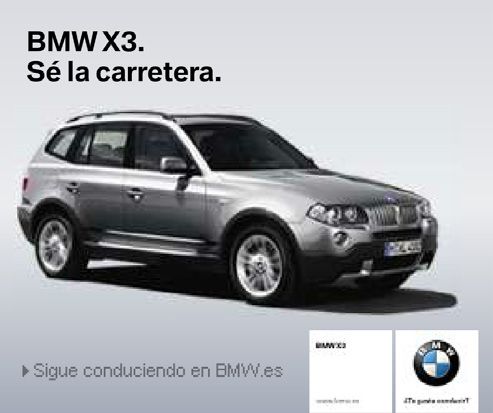
1. Introduction
The technological revolution and the transformation of the media (Scolari, 2012) have brought about
constant changes in advertising communication (Del-Pino, Castelló, and Ramos-Soler, 2013), as the
application of technology to the media offers possibilities for brands to adapt to new consumer demands.
Thus, growing use of the Internet is displacing the contact that individuals have had with traditional media,
as “they already spend more time surfing the web than watching television. In fact, reading news and
watching videos are increasingly the main activities on the Internet” (Martín and Fernández, 2014: 19).

In this context, the present study analyses the evolution of advertising in Spain before and after the
economic crisis that started in this country in the second half of 2008 (Dávila-Quintana and González-
López-Valcárcel, 2009), focusing on the case study of the automotive sector, which represents 10%
of the Spanish Gross Domestic Product. It is also one of the three sectors with the highest level of
advertising investment in Spain (Infoadex, 2019), accounting for 12% in 2007 and 13% of total advertising
expenditures in 2018.

1.1. The Internet, a driving force for change
Throughout history, technological development has been one of the main driving forces for change
and the shaping of society. In turn, society has stimulated technological development in one direction
or another according to the dominant criteria, needs, and interests of each era and social group. This
is a virtuous circle involving technological and social change that several authors have cited, since
technology is an integral part of human activity (Bouza, 2002; Van Eijck, and Claxton, 2009).

The rise of digital technology has led to the decline of analogue and is the result of the modernisation
of society, which demands services in line with its needs and expectations. This process is influenced
by purchasing power, information and technological advances. As the entire world is now digital,
advertising tends to be digital as well.

Due to constant technological progress, most sectors have had to transform themselves and embrace
change, as they can no longer continue with the values and ways of working that existed prior to the
technological revolution (Linz, Riechman, and Sempere, 2007). The automotive world has undergone
major changes as well (Mitchell, Hainley, and Burns, 2010; Aoyama, 2012; Buckl, Camek, Kainz, Simon,
Mercep, Stähle, and Knoll, 2012). As in other fields, technology has erupted in the automotive industry,
providing advanced functionalities: GPS navigation, speed control, lane keeping assist, and even voice
assistance, such as that which is available on smartphones. These advances have led to a change in
habits and paradigms of consumption and, as a result, the emergence of concepts such as connected
vehicles, electrification, automated driving systems, the introduction of new materials and techniques,
and changes in the concept of mobility.

The explosion and growth of the Internet in recent years has contributed to these changes in the media
sector, producing a widespread, alarming loss of revenue from advertising, especially in the print media
(newspapers, magazines and supplements), and cinema as well.

For many authors, the Internet has become the most important communication channel of our time,
or the new metamedium, to which the rest of the media will have to adapt (Okazaki, 2002). This digital
medium is much more than technology. “It is a means of communication, interaction, and social
organisation” (Castells, 2000: 1). Researchers at the University of Granada and Rice University have
shown that the impact of the Internet on the evolution of advertising investment in the media over the
last decade has been much greater than the influence of the 2008 economic crisis (Del-Barrio-García,
Kamakura, and Luque-Martínez, 2019).

Television has long been considered the main communication channel, yet it has started to lose its
ability to influence the population. Consequently, the advertising and media paradigm has evolved
and is changing the ways people consume, and is also transforming “the massiveness that traditional
media previously achieved” (Martín and Fernández, 2014: 20).

1.2. The transformation of advertising
Advertising contributes directly and plays a leading role in institutionalising the everyday life of social
groups, representing a documentary source by reflecting social reality at every moment (Moreno and
Molina, 2012; Ruiz and Sánchez, 2019). However, like any other source, it does not reflect true reality
because it is not transparent, but instead is a distorted cultural mirror, as established by the researcher
Pollay (1986) in his time. This metaphor implies that advertising reflects only certain attitudes, behaviours,
and values, which are those that serve the interests of the advertiser. Despite this situation, and beyond
its commercial purpose, advertising also transfers symbolic brand meaning to the consumer with the city
as its main setting (García-Martín, 2020).

228
With the onset of the global financial crisis in Spain, since the end of 2008 the advertising sector has
suffered a sharp decline in investment figures. The economic recession has been the cause of many
problems within the industry. For Rodríguez (1994: 105), “the transformation of advertising must be
analysed by considering three aspects: 1) the economic crisis in general, and of companies in particular;
2) the crisis of the advertising system itself in terms of effectiveness; and 3) the crisis of social and cultural
values represented by advertising”.

Before the crisis, specifically during the years of economic prosperity, advertising budgets grew to a large
extent, creating the myth of advertising as being all-powerful (León, 1994). Once economic instability
began, budgets were reduced and agencies suffered the most damage. Some authors have stated
that “the crisis of the advertising system is basically the crisis of advertising agencies and, ultimately, of
the concept of advertising they represent” (Caro, 1994: 97).

Subsequently, with the appearance of extensive television offerings, the saturation and fragmentation
of audiences began along with an evolution in consumption habits and a loss of effectiveness on
the part of advertising, and the result has been the advertising crisis (Baraybar-Fernández, Baños-
González, Barquero-Pérez, Goya-Esteban, and de-la-Morena-Gómez, 2017). The consequences of this
paradigmatic transformation are the decline of television and the press, the growth of cinema and
radio, and the expansion of advertising through the Internet, especially in social networks, which have
experienced an upward trend in terms of investment for a number of years, especially in Spain in 2018.
Likewise, investment in branded content and influencers has grown considerably as well (Infoadex,
2019).

In addition to the aforementioned economic and advertising crisis, there has been a significant change
in the value models reflected in advertising discourse. Advertising communication partly consists of
inducing the audience to desire products offered on the market by means of symbolic representations
of goods, services or ideas. The personal values of car buyers that relate to product attributes are
hedonism or personal pleasure and design, as well as a concern for safety and the search for protective
features (Pimenta and Piato, 2016). If anything, the relevance of advertising values in this sector have
increased due to empirical evidence that shows that the gap between perceived and objective
quality has decreased over the last two decades (Akdeniz and Calantone, 2017). Moreover, the use of
unrealistic images, which are sometimes used in car advertising, increases uncertainty in evaluating the
product and imagining its use (Kim, Choi, and Wakslak, 2019).

Representations are constantly being renewed (Benavides, 2012), as these values change over time. With
the Covid-19 health crisis, brands are currently shifting toward an emphasis on conscious consumerism,
and focusing on environmental sustainability in their communications (González, Lecumberri, and
Gaspar, 2020).

A complex combination of values has been built around the automobile, led by design, price,
technology, ecology and safety. New values are emerging as well, such as well-being and health, as
a result of the current health crisis. Introduction of the ecological concept in car advertising, described
as eco-fashion (Díez-Arroyo, 2018), contrasts with the low level of energy efficiency of the products
of most advertisers, despite appropriating the existing social concern about the deterioration of the
environment (Chen, 2016). The consequence is a low presence of best practice in the automotive
advertising sector in Spain (Pedros-Pérez, Martínez-Jiménez, and Aparicio-Martínez, 2019).

As a consequence of all these various factors, the automotive industry has been forced to digitise its
communication strategy and, consequently, the figures have been increasing. Advertising developed
on the Internet shows significant differences compared to advertising created for other media, one
of which is interactivity, (Yoon and Kim, 2001). Internet advertising has been labelled as electronic
advertising (Hawkins, Gausen, and Stromman, 2012). Moreover, according to authors Blázquez, Molina,
Esteban, and Martín-Consuegra (2008), its purpose is not only to advertise and distribute messages, but
“it must also facilitate customer relations, the creation of cyber branding, provide consumer services,
generate electronic sales of goods and services, and send direct and interactive marketing messages”
(2008:161).

While it is true that consumers do not buy cars online, 86% of them search on the Internet for information
about the brand or its models, features and prices before visiting a dealership (IAB Spain, 2019), so the
digitisation of advertising communication for car brands should already be contemplating all phases of
the purchase process.

                                                                                                              229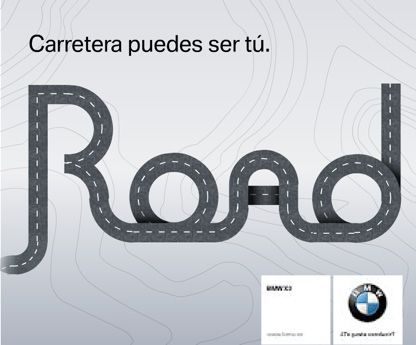
2. Methodology
The overall objective of this research is to analyse the evolution of advertising investment in Spain, in
general, and in the automotive industry, in particular.

The specific objectives are as follows:
         • Determine how advertising investment has evolved before and after the economic crisis.
         • Identify the importance of the Internet in advertising investment as a whole in order to
           establish the impact of technology on automotive advertising.
         • Analyse the content of digital advertising in the automotive sector.
         • This study is based on the following hypotheses:
         • H1. There is a direct relationship between the economic crisis and investment.
         • H2. The Internet has been the most heavily used medium by automotive brands during and
           after the crisis. The restoration of advertising investment has occurred thanks to the Internet.
         • H3. Internet advertising has changed over the last 10 years as a result of technology.
This research has used a methodology that is both quantitative and qualitative. Content analysis was
carried out through a comparative study of advertising during the period examined (2007-2018), in
addition to the use of the information extracted from Infoadex (the largest database in the advertising
sector) with its Info Io tool based on data related to investment, insertions and occupancy.

Firstly, a data collection from the automotive sector was carried out in order to identify the recent history
of advertising investment. In all the searches, net investment figures were used, which Infoadex calls:
“INV_EST_IAD_€”, as this is a more realistic amount and closer to the figure for the purchase of the space.

Secondly, a qualitative analysis of advertising was carried out, and in order to properly calculate the
size of the advertising sample, the statistical algorithm known as the z-score was applied. The sample is
composed of 672 adverts that appeared between 2008 and 2018. These ads were randomly selected
and are representative of the automotive brands. Likewise, in choosing the sample, the proportionality
criterion has been applied based on the number of adverts per four-month period, as shown in Table 1.
In order for the study to be statistically representative, a confidence level of 99% and a margin of error
of 5% was applied.

                                           Table 1. Sample selection

                                  2008                                             2018

                      1st four-    2nd four-    3rd four-              1st four-     2nd four-    3rd four-
             Total                                          Total
                       month        month        month                  month         month        month
             year                                           year
                       period       period       period                 period        period       period

   No. of
  adverts    1,353      338          632          393       10,959      2,688             5,115    3,156

  Sample      300        75          139           86        372          91              174       107

                                     Source: Prepared by the authors

All of these adverts were downloaded using the Infoadex Mosaic tool. After obtaining the ads, the
search criteria indicated in Table 2 were followed.

230
Table 2. Search criteria of the adverts using the Mosaic tool
Sector Category Product Advertising format
Car 1. Mini Banner
Car 2. Small Billboard
Car 3. Medium Button
Car 4. Full-size Fat Skyscraper
Car 5. Luxury Full banner
Car 6. Coupe Gigabanner
Car 7. Sport car
Half page filmstrip sidekick square
Car 8. Minivan
Half banner
Car 9. Off-road
Large rectangle
Medium banner
Medium rectangle
Passenger
Automotive industry
cars
Medium square
Megabanner
Other formats
Portrait
Rectangle
Skyscraper
Small button
Small skyscraper
Splitscreen
Square
Wide skyscraper
Source: Prepared by the authors based on data from Infoadex (2019)
To determine the analysis parameters of the adverts, we used those that have been established previously
in other studies as a reference, such as the one from Campuzano Ruiz (1992), who established four
levels of analysis of a still image: technical, formal, meaning, and context; Villafañe (2006) determined
analysis parameters for both a still and moving image, which is the foundation of this study; and Acal
(2015) established his own model with two levels of analysis: identification and the interpretative, based
on the theories of Lasswell, Durand, Ricarte, and Barthes, among others.
In order to analyse the adverts, this research has focused on the study of the three parts, or sections,
that make up a still advertisement: 1) the art or image; 2) the text or copy; and 3) the most relevant
advertising value conveyed.
Below is the complete sampling sheet that was used to review the adverts produced by the automotive
brands on the Internet. It includes the following categories and options:
• Date of issue.
• Advertiser.
231• Brand.
• Model.
• Product [passenger cars: 1 mini, 2 small, 3 medium, 4 full-size, 5 luxury, 6 coupe, 7 sport car,
8 minivan, 9 off-road].
• Banner type [flash animation, jpg, animated gif].
• Format [banner, billboard, bumper, layer, half banner, megabanner, portrait, pushdown,
skyscraper, page stealer, sidekick, slider, splitscreen, and superbanner].
• Medium.
• Film frames [1, 2, 3, 4, 5, 6, 7, 8, 9, 10, 11, 12, 13, 14, 15… 20].
• Dimensions [250x250, 300x250, 300x600, 468x60, 234x60, 234x90, 728x90, 900x90, 120x600,
800x600, 400x400, 900x250, 300x1050].
• Technique [photography, drawing, photography and drawing, text].
• Car [yes, no].
• Protagonist [product, brand, character].
• Shot [Close-up, Medium shot, Long shot].
• Background [neutral, city, mountains, sea, and road].
• Background colour [white, grey, black, blue, green, orange, red, yellow, purple and brown].
• Car colour [white, grey, black, blue, green, orange, red, and yellow].
• Lighting [artificial, natural, dark].
• Headline [yes, no].
• Copy [yes, no].
• Claim [yes, no].
• Logo [yes, no].
• Call to action [yes, no].
• Legal notice [yes, no].
• Value [safety, price, financing, promotion, guarantee, ecology, technology, comfort,
boot space, design, consumption, power, infotainment, performance, compliance with
legislation].
The values have been established as a result of previous fieldwork based on a sample of 150 people
aged 18-60 from diverse professional sectors in Spain (engineering, computer systems, education,
communication, architecture, fine arts, and university students), with a common interest, which is
technology. Moreover, they were all selected through social networks and were asked to categorise
a series of factors, mostly obtained from the model of Byun (2001) and López, Fernández, and Mariel
(2002), in order of importance, from which fifteen were obtained. These values, which were used to
categorise the advertising, were subsequently completed with the values of online advertising.
3. Results
3.1. Advertising investment
In the first general analysis by sector (Figure 1), the automotive industry was the one that invested the
most in advertising from 2007 to 2012. It was followed by distribution and food service, and the health
and beauty industry. From 2013 to 2016, the retail industry invested the most, with the automotive industry
in second place. In 2014, it came in third place. In 2017 and 2018, automotive advertising investment
figures were increasing, while total investment remained stable.
232Figure 1. Advertising investment by sector
Source: Prepared by the authors based on data from Infoadex (2019)
The automotive sector continues to have the highest level of investment with 10% of the total. It is
therefore one of the strategic sectors in Spain. It has always been among the first few positions at the
top of the rankings in terms of advertising investment and, as can be seen in Figure 2, although the total
amount of advertising expenditure has fallen, advertising investment in this sector has remained stable.
In other words, the percentage of the total amount of advertising investment has been similar over the
last 10 years: before, during, and after the economic crisis, ranging from 10% to 13%.
Figure 2. Advertising investment in the automotive sector as a % of the total
Source: Prepared by the authors based on data from Infoadex (2019)
233Regarding the analysis of advertising investment by automotive group (Figure 3), the Volkswagen group
led the ranking in terms of advertising investment in Spain from 2007 to 2018, followed by the PSA group,
with the Renault-Nissan-Mitsubishi group holding third place. The Volkswagen group is the one that
invested the most in 2018, with a significant difference of more than 200 million euros compared to the
rest of the groups.
Figure 3. Advertising investment by automotive group
Source: Prepared by the authors based on data from Infoadex (2019)
As seen in Figure 4, television advertising has declined since 2008, with 2018 being the year with
the highest investment on the Internet. However, during those 10 years, the Internet never overtook
television, while other media such as radio, cinema and the print media maintained similar levels
of investment.
Figure 4. Investment by the automotive industry according to media type
Source: Prepared by the authors based on data from Infoadex (2019)
According to the results produced by Infoadex, advertising investment on the Internet (Figure 5) has
grown by 21% since 2017 and, in the automotive market, it has increased by 75% during the same
period.
234Figure 5. Comparison of advertising investment on the Internet
Source: Prepared by the authors based on data from Infoadex (2019)
The brands that invested the most on Internet from 2007 to 2018 (Figure 6) were Seat, Peugeot, Citroen,
Volkswagen, Ford, Renault, Opel, Nissan, Audi, and Kia, maintaining continuity with the groups’ strategies.
There has been a notable upturn since 2016 with the economic recovery having been consolidated.
Figure 6. Total Internet investment by brand, 2007-2018
Source: Prepared by the authors based on data from Infoadex (2019)
3.2. Content analysis of the advertisements
By analysing the random sample of adverts extracted from the Infoadex Mosaic tool, one can see in
Figure 7 that between 2008 and 2018, the predominant advertising format was the page stealer (53% in
2008 and 37% in 2018), followed by the megabanner (28% in 2008 and 23% in 2018), and the skyscraper
(7% in 2008 and 13% in 2018). In 2018, the splitscreen (16%) and billboard (4%) also stand out.
235Figure 7. Comparison according to advertising format
Source: Prepared by the authors based on data from Infoadex (2019)
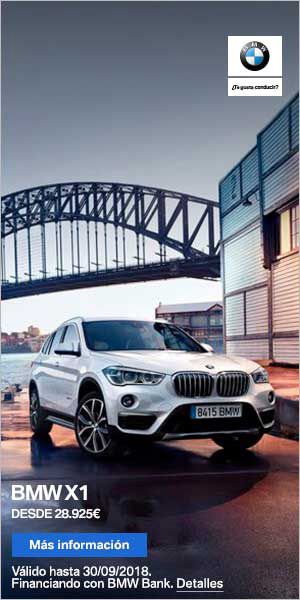
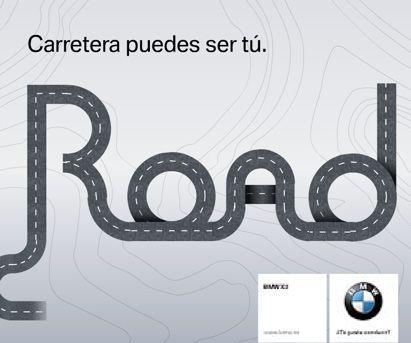
Figures 8 and 9 show two examples of advertisements created by the BMW car brand in 2008 and 2018,
respectively, in which the evolution of media channels can be seen. The first uses a rectangular page
stealer - 300x250 pixels - and the second uses the so-called splitscreen - 300x600 pixels. The car is placed
in the centre in a horizontal and vertical format, with a predominantly grey colour in the advertisement
that appeared in the year when the economic crisis started.
Figure 8. Page stealer created by BMW in 2008
Source: Infoadex (2019)
Figure 9. Splitscreen created by BMW in 2018
Source: Infoadex (2019)
236In terms of the technology used (Figure 10), in 2008 flash animation was predominant at 89% (compared
to 0% in 2018) followed by animated gifs at 11%. In 2018, jpg predominates with 53%, followed by
animated gifs (30%) and static gifs (17%).
Figure l0. Comparison according to banner type
Source: Prepared by the authors based on data from Infoadex (2019)
Regarding techniques employed (Figure 11), photography was the most widely used resource, both
in 2008 at 76%, and in 2018 at 97%. Only 2% in 2008 and 1% in 2018 were text ads in which no image
appeared.
Figure 11. Comparison according to technique
Source: Prepared by the authors based on data from Infoadex (2019)
In nearly all the adverts, the narrative is characterised by the prominence of the product (88% in 2008
and 93% in 2018). In only 8% of the ads in 2008, the protagonist of the ad was the brand, compared
to 6% in 2018. As for the use of a character, this appeared at the rate of 11% in 2008 and 2% in 2018.
Furthermore, in only 2% of the cases in 2008 and 3% in 2018, respectively, the car does not appear in
the advert. For both years, 2008 and 2018, the car is the protagonist with a presence of more than 95%.
The car is the advertised product. Consequently, it stands out the most. For this reason, the background
is less important and is only used as a resource to accompany the protagonist. In 2008, the most
widely used background (Figure 12) was a plain, neutral colour (a colour that serves as a backdrop in
order to put more emphasis on the product), with a figure of 76%. In 2018, the background became
more important and provided information about the context or setting of the car. For example, if the
advertising says “master the road”, the road is seen on the screen. Moreover, in 2018 an urban backdrop
dominated 47% of the adverts compared to 12% in 2008. This was followed by a neutral background,
with 30%, and the use of nature, which accounted for 18% in 2018 and 10% in 2008.
237Figure 12. Comparison according to background
Source: Prepared by the authors based on data from Infoadex (2019)
With regard to colour (Figure 13), both the colour of the automobile and the background were analysed.
In 2008, the three most prevalent car colours used in advertisements were grey (32%), red (21%) and
black (13%), which was closely followed by white (12%) and blue (10%). In 2018, by comparison, red
was the most prevalent colour at 24%. Moreover, in that same year the three most commonly used car
colours were red (24%), blue (19%), white (also 19%), and grey (18%).
Figure 13. Comparison according to automobile colour
Source: Prepared by the authors based on data from Infoadex (2019)
The background colour (Figure 14) in both 2008 and 2018 was predominantly grey, with 28% and 41%
respectively, whereas in 2008 colours such as black (20%), white (19%), blue (17%), as well as yellow
and green (6%) were used. In 2018, more colours were used, yet primary and secondary colours were
predominant. The colours of nature stood out, especially brown (21%), blue (12%), and green (3%).
White and black also had a strong presence at 8% each.
238Figure 14. Comparison according to background colour
Source: Prepared by the authors based on data from Infoadex (2019)
In terms of text, both in 2008 and 2018 the majority of the advertisements had headlines and copy. More
specifically, in 2008 the presence of headlines was 91%, and in 2018 the figure was 89%. In 2008, copy
was present in 95% of the adverts, and in 2018 this figure stood at 89%. Only 39% of the 2008 adverts
and 33% of those of 2018 had a closing or claim. The logo, on the other hand, was present in 97% of the
2008 adverts and 92% of the 2018 ads. Moreover, 75% of the ads in 2008 and 78% in 2018 included a call
to action. Only 18% of the 2008 banners featured a legal disclaimer, while in 2018 this figure was even
lower at 10%.
4. Discussion and conclusions
Citizens are increasingly using the Internet as their main channel of consumption. As a result, advertisers
have directed their advertising strategy toward this medium. Despite the fact that all the hypotheses
put forward at the beginning of this research have been validated, H1 has only been partially verified in
terms of the direct relationship between investment and the economic crisis. Since 2007, there has been
a drop in advertising investment due to the crisis, with the worst figures in 2013. However, in 2017 and
2018, when the economy had already recovered, advertising investment still had not been restored,
and remains below pre-crisis levels.
Furthermore, H2 can only be partially confirmed as well, as the Internet is the medium that has grown
the most in the period analysed, especially since 2016. As a result, it can be affirmed that the recovery
of advertising investment is due to the upsurge of the Internet as an advertising medium. However, the
most heavily used medium employed by automotive brands, both during and after the crisis, has been
television.
Even though each medium has its own unique features, and integrating all of them benefits the
communication strategy, the Internet is the medium that has evolved the most and has had the strongest
impact. As can be seen in the type of advertisements used, this impact is due to the fact that the
Internet offers visual appeal for users and, in this way, the brand becomes interactive for its consumers
as well. Moreover, digital resources are able to reach more people. Therefore, H3 can also be validated,
as advertising has changed over the last 10 years as a result of technology, which has challenged
traditional advertising media such as totally paper-based media like newspapers and magazines. Even
though the purchase of a vehicle is a more rational decision and television is adapting, the truth is that
this medium has suffered a sharp decline since 2007.
With regard to content analysis of the adverts, it can be seen that the format par excellence, which
has been the banner, has changed in the last ten years, and other resources such as page stealers
have become more heavily used. In 2018, other resources gained prominence, such as splitscreens and
billboards. Similarly, there has been a shift from the expandable, floating format to video adverts, with
the aim of generating more attention from the audience.
239In 2008, the majority of ads were produced with flash, while in 2018 it was no longer used, and the predominant format became jpg. This is probably due to the fact that the former required the browser to incorporate specific software to visualise files created with the flash language and usually caused the web to function somewhat more slowly, as these files were heavier and took longer to load. On the other hand, the use of images in Internet advertising is essential in order to create visual attraction with a resulting impact. In terms of advertising properties, photography was the most heavily used technique, both in 2008 and 2018. The aim is to portray the product as close to reality as possible in order to make it attractive to the user and make them want to buy it. The product, which is the car, is the protagonist of the advert. In most of the 2008 ads, a single grey car is shown, while in 2018 it is red. The state of mind reflects the colour a person chooses. For this reason, with the onset of the financial crisis in 2008, the predominant colours used to display cars were grey, red, black, white and blue, while in 2018, red, blue, white and grey predominated. This could also be due to the impossibility of regularly changing cars. Advertisers knew that customers were not going to change cars quickly, and as a result, in 2008 they decided to use grey, which is a more neutral and rational colour, even a bit boring, yet more difficult to saturate. Consequently, this colour was more in line with communication during the crisis. On the other hand, the colour red is a more passionate, risky colour that appeals to feelings, which is why it was chosen more frequently for adverts in 2018 as a way of connecting with customers through emotion. In the 2018 ads, the car is no longer grey, and the colour varies depending on the model and segment. Sport cars and coupes are displayed with more aggressive colours, such as red or yellow. Mini-vans and off-road vehicles are depicted in white, blue and black. In advertisements where more than one car appears, an attempt is made to increase awareness of the brand or product line. These are branding adverts aimed at enhancing brand recognition with less emphasis on selling a specific product. Instead, their purpose is to raise awareness of a range of cars and/or a brand. They have been in the minority, both during and after the crisis, as the main objective of these companies is to showcase specific models. As far as the background is concerned, in 2008 most of the adverts showed a background that hardly provided any information, because it was neutral and unimportant, hence the use of plain ink. Grey, black and white predominate. In 2018, the background takes centre stage and accompanies the figure. As the trend is no longer neutral, urban and natural settings appear. Hence, the predominance of grey, brown, blue and green. In 2018, the urban landscape is characterised mainly by buildings, accounting for 47%, and the natural landscape comprises 18%, which is mainly composed of mountains, the sky and the sea. Above all, these are settings where the terrain becomes difficult and the car is the protagonist that dominates the scene. The car in 2018 is no longer shown as an isolated object in a neutral showcase where it provides no information, and the concept of mobility is emphasised by appealing to emotion: the pleasure of driving, or “feel the road”. The car is an element of the environment that cares for and protects. It appears in idyllic environments, such as paradisiacal beaches and, on some occasions, the setting is shown exclusively without the car. This approach is used by brands to reflect their high level of respect that leaves no trace of an ecological footprint in its wake. This evolution is a feature related to the period of economic crisis. During the crisis, the aim was to appeal to the basic functional need of a vehicle, which is mobility, whereas after the crisis companies appealed to the pleasure experienced by consumers through the in-car experience of mobility. Regarding the analysis of the text that appeared in the adverts, the banners analysed stand out for their interactivity and for including only a small amount of text. It is usually clear, concise and brief, highlighting the main competitive advantage of the car. The messages used are not informative, but rather the majority of them appeal to feelings and experiences in order to generate engagement. Most include a headline and copy, as well as a button or call to action that redirects the user to the advertiser’s website and highlights the brand logo, which refers to the importance of recognition and guiding the user toward the car brand that he or she should buy. Few brands include a legal disclaimer in their advertising. One of the main conclusions obtained from this study is that technology evolved in the 10-year period from 2007 to 2018 in a way that was clearly evident. In fact, the change was so great that it influenced advertising on the Internet, moving from prominence on television to the mobile functionality of smartphones. These changes have had an impact not only on advertising and its respective investment, but also on the devices employed by users along with the style of advertisements as well. During the period studied, it was found that advertisers made ads less intrusive and annoying, because the adverts started to have fewer frames. They also needed to adapt to the new technological channels, modifying their format size and innovating in the area of audio-visual resources in order to grab the attention of users. 240
The ultimate goal of all these adverts is for the customer to interact with them in order to be sent to another
web page with a much larger amount of detailed information about the vehicle, the vehicle product
line, or simply the brand they are trying to promote. This is the main difference between the Internet and
all other traditional media, which is that the latter have a deficiency of interactivity. Consequently, the
brand-customer relationship becomes one of the most valued factors in any purchasing process.

This research indicates that in situations of economic crisis, total advertising investment decreases and
more is invested in the Internet. Furthermore, there is evidence of a change in advertising in which
the type of technological support, as well as the structure of narratives and design, have adapted to
the social context that users experience with the aim of creating a link with a potential customer, in
most cases. Brands change their discourse according to the variables that emerge in society, in which
purchasing power, value systems, and even common concerns are important.

In order to carry out this study, a compilation of advertisements was used, which were obtained from
Infoadex through its Mosaic tool. This was the first limitation of the study, as this platform specialises
in traditional advertising spaces and has gradually adapted to the Internet realm, which means that
during some periods of time it does not collect all the inventory available, thereby excluding a large
proportion of the adverts produced by advertisers on social networks. For future research, it would be of
interest to obtain more results directly from brands, or from platforms such as Facebook and Instagram,
as well as to extend the study to the values that brands display through their advertising, due to the
fact that in 2008 automotive advertising placed greater importance on certain criteria and, in 2018, it
emphasised others.

5. Specific contributions of each author

 Contributions                                       Responsible party/parties

 Conception and design of the study                  Gema Bonales and Luis Mañas

 Documentary research                                Gema Bonales and Luis Mañas

 Data collection                                     Gema Bonales and Luis Mañas

 Analysis and critical interpretation of data        Gema Bonales and Luis Mañas

 Review and validation of versions                   Gema Bonales and Luis Mañas

6. Acknowledgement
Translator: Charles Edmond Arthur.

7. Bibliographic references
[1] Acal, I. (2015). Metodologías para el análisis de la imagen fija en los documentos publicitarios:
revisión y aplicaciones. Revista General de Información y Documentación, 25(2), 425-446.
https://doi.org/10.5209/rev_RGID.2015.v25.n2.51243

[2] Akdeniz, M. B., and Calantone, R. J. (2017). A longitudinal examination of the impact of quality
perception gap on brand performance in the US Automotive Industry. Marketing Letters, 28(1), 43-57.
https://doi.org/10.1007/s11002-015-9392-8

[3] Aoyama, M. (2012). Computing for the next-generation automobile. IEEE Computer, 45(6), 32-37.
https://doi.org/10.1109/MC.2012.153

[4] Armstrong, S. (2001). La publicidad en Internet: cómo se transmite su mensaje a través de la World
Wide Web. Bilbao: Deusto.

[5] Baraybar-Fernández, A.; Baños-González, M.; Barquero-Pérez, O.; Goya-Esteban, R., and de-
la-Morena-Gómez, A. (2017). Evaluation of Emotional Responses to Television Advertising through
Neuromarketing. Comunicar, 25(52), 19-28. https://doi.org/10.3916/C52-2017-02

[6] Benavides, J. (2012). La investigación en comunicación y publicidad: nuevos temas y problemas.
Questiones Publicitarias, 1(17), 71-93. https://doi.org/10.5565/rev/qp.55

[7] Blázquez, J.; Molina, A.; Esteban, A., and Martín-Consuegra, D. (2008). Análisis de la eficacia
publicitaria en Internet. Investigaciones Europeas de Dirección y Economía de la Empresa, 14(1), 159-
176. https://doi.org/10.1016/S1135-2523(12)60017-3

                                                                                                           241
[8] Bouza, F. (2002). Innovación tecnológica y cambio social. In X. Pérez-Vilariño y M. Bouzada- Fernández (coords.), Las encrucijadas del cambio social (pp. 85-97). Vigo: Universidad de Vigo. [9] Buckl, C.; Camek, A.; Kainz, G.; Simon, C.; Mercep, L.; Stähle, H., and Knoll, A. (2012). The software car: Building ICT architectures for future electric vehicles. IEEE International Electric Vehicle Conference, 12689445, 1-8. https://doi.org/10.1109/IEVC.2012.6183198 [10] Byun, D. H. (2001). The AHP approach for selecting an automobile purchase model. Information & Management, 38(5), 289–297. https://doi.org/10.1016/S0378-7206(00)00071-9 [11] Campuzano, A. (1992). Tecnologías audiovisuales y educación: una visión desde la práctica. Madrid: Akal. [12] Caro, A. (1994). Las profesiones publicitarias ante la crisis. In J. Benavides-Delgado (coord.), La crisis de la publicidad (pp. 55-70). Madrid: Edipo. [13] Castells, M. (2000). Internet y la sociedad red. Contrastes: Revista cultural, 43, 111-113. shorturl.at/dqsyT [14] Chen, S. (2016). Selling the environment: Green marketing discourse in China’s automobile advertising. Discourse Context & Media, 12, 11-19. https://doi.org/10.1016/j.dcm.2016.03.003 [15] Dávila-Quintana, C. E., and González-López-Valcárcel, B. (2009). Crisis económica y salud. Gaceta Sanitaria, 23(4), 261-265. https://doi.org/10.1016/j.gaceta.2009.04.003 [16] Del-Barrio-García, S.; Kamakura, W. A., and Luque-Martínez, T. (2019). A Longitudinal Cross-product Analysis of Media-budget Allocations: How Economic and Technological Disruptions Affected Media Choices Across Industries. Journal of Interactive Marketing, 45, 1-15. https://doi.org/10.1016/J.INTMAR.2018.05.004 [17] Del-Pino, C.; Castelló, A., and Ramos-Soler, I. (2013). La comunicación en cambio constante. Madrid: Fragua. [18] Díez-Arroyo, M. (2018). Metarepresentation and echo in online automobile advertising. Lingua, 201, 1-17. https://doi.org/10.1016/j.lingua.2017.08.008 [19] García-Martín, M. (2020). La imagen de la ciudad en la publicidad de automóviles. Boletín de la Asociación de Geógrafos Españoles, 84, 2817, 1-30. https://doi.org/10.21138/bage.2817 [20] Hawkins, T. R.; Gausen, O. M., and Stromman, A. H. (2012). Environmental impacts of hybrid and electric vehicles—a review. The International Journal of Life Cycle Assessment, 17, 997-1014. https://doi.org/10.1007/s11367-012-0440-9 [21] IAB Spain (2019). Estudio Anual de Redes Sociales. Available in https://bit.ly/36ltkcA [22] Infoadex (2019). Info ío/Mosaico. Available in https://tinyurl.com/y6vtar3a [23] Kim, B. K.; Choi, J., and Wakslak, C. J. (2019). The Image Realism Effect: The Effect of Unrealistic Product Images in Advertising. Journal of Advertising, 48(3), 251-270. https://doi.org/10.1080/00913367.2019.1597787 [24] León, J. L. (1994). La eficacia de la publicidad en tiempos de crisis. In J. Benavides-Delgado (coord.), La crisis de la publicidad (pp. 11-32). Madrid: Edipo. [25] Linz, M.; Riechman, J., and Sempere, J. (2007). Vivir (bien) con menos. Barcelona: Icaria. [26] González, D.; Lecumberri, G., and Gaspar, M. (2020). Consumidores y marcas en tiempos de Covid-19. Llorente y Cuenca. Available in https://bit.ly/35bJGF6 [27] López, C.; Fernández, K., and Mariel, P. (2002). Índices de satisfacción del consumidor: Una aplicación de modelos de ecuaciones estructurales a la industria automovilística española. Available in http://hdl.handle.net/10810/5729 [28] Martín-Guart, R., and Fernández, J. (2014). La Publicidad y la Agencia de Medios Frente al Cambio en el Ecosistema Mediático. Cuadernos.info, 34, 13-25. https://doi.org/10.7764/cdi.34.572 [29] Mitchell, W. J.; Hainley, B. E., and Burns, L. D. (2010). Reinventing the automobile: Personal urban mobility for the 21st century. Cambridge, MA: MIT press. 242
[30] Moreno, A., and Molina, P. (2012). La publicidad, fuente documental para explicar permanencias
y cambios en las sociedades contemporáneas. Cuestiones de género: de igualdad y la diferencia, 7,
177-195. https://doi.org/10.18002/cg.v0i7.909

[31] Okazaki, S. (2002). La Estandarización Publicitaria de las Multinacionales Japonesas: Análisis
de Contenido de la Publicidad Web en Japón, España y EE.UU. (Doctoral dissertation) Universidad
Autónoma de Madrid, Madrid.

[32] Pedros-Pérez, G.; Martínez-Jiménez, P., and Aparicio-Martínez, P. (2019). The potential of car
advertising in pursuing transport policy goals: Code of good practices in the Spanish context.
Transportation Research Part D-Transport and Environment, 72, 312-332.
https://doi.org/10.1016/j.trd.2019.05.010

[33] Pimenta, M. L., and Piato, E. L. (2016). Cognitive relationships between automobile attributes and
personal values. Asia Pacific Journal of Marketing and Logistics, 28(5), 841-861.
https://doi.org/10.1108/APJML-09-2015-0147

[34] Pollay, R. W. (1986). The Distorted Mirror: Reflections on the Unintended Consequences of
Advertising. Journal of Marketing, 50, 18-36. https://doi.org/10.1177/002224298605000202

[35] Rodríguez, J. C. (1994). Panorama general de la crisis publicitaria. Questiones publicitarias, 3, 105-
113. https://doi.org/10.5565/rev/qp.217

[36] Ruiz, F. X., and Sánchez, C. (2019). Narrativas de la crisis económica: el nacionalneoliberalismo en la
publicidad española (2008-2017). Palabra Clave, 22(2),1-37. https://doi.org/10.5294/pacla.2019.22.2.8

[37] Scolari, C. A. (2012). Media ecology: Exploring the metaphor to expand the theory.
Communication Theory, 22(2), 204-225. https://10.1111/j.1468-2885.2012.01404.x

[38] Van Eijck, M., and Claxton, N. X. (2009). Rethinking the notion of technology in education: Techno-
epistemology as a feature inherent to human praxis. Science Education, 93(2), 218-232.
https://doi.org/10.1002/SCE.20308

[39] Villafañe, J. (2006). Introducción a la teoría de la imagen. Madrid, España: Pirámide.

[40] Yoon, S., and Kim, J. (2001). Is the Internet More Effective Than Traditional Media? Factors Affecting
the Choice of Media. Journal of Advertising Research, 41(6), 53-60.
https://doi.org/10.2501/JAR-41-6-53-60.

                                                                                                        243
You can also read