Doubly robust estimation for causal effect - FYP Proposal WONG Tsz Lok - Department of Mathematics Hong Kong Baptist University 2020-2021 - Math, HKBU
←
→
Page content transcription
If your browser does not render page correctly, please read the page content below
FYP Proposal

Doubly robust estimation for causal
 effect

 by

 WONG Tsz Lok

 Advised by
 Prof. Lixing Zhu

 Department of Mathematics

 Hong Kong Baptist University

 2020-2021

Table of Contents

1. Introduction…………………………………………………………….………………………………………….3
 1.1 Overview…………………………………………………………………………………………… 3
 1.2 Objectives…………………………………………………………………………………………. 6
 1.3 Literature Review………………………………………………………………………………. 7
2. Methodology………………………………………………………………………………………………………9
 2.1 Data Collection……………………………………………………………………..…………… 9
 2.2 Defining the main variables…………………………………………………….………………..9
 2.3 Average Treatment Effect…………………………………………………….…………….10
 2.4 Generalized Method of Moments estimation………………………….…………11
3. Computation and result……………………………………………………………….……………………13
 3.1 Simulation………………………………………………………………………………………….13
 3.2 Data analysis………………………………………………………………………………………15
 3.2.1 Data Collection……………………………………………………………………………………15
 3.2.2 Result and conclusion………………………………………………………………………….17
4. References…………………………………………………………………………………………………………

1. Introduction 1.1 Overview Epidemic prevention measures of COVID-19 in Hong Kong In order to control the spread of COVID-19, Hong Kong government implemented different policies this year. For examples, class suspension for all schools, put restriction on the entry of all non-Hong Kong residents from abroad, compulsory quarantine for the recent travelers or other social restrictions policies. There are varied prevention measures. In the period of the methods were being implemented, there are unlikely effect for the growth of the number of confirmed cases. The Hong Kong society has been challenged by the repeating waves of COVID-19 explosions since the first case confirmed in January 2020. Was the government implemented those prevention measures effectively? Second wave explosions of COVID-19 The second wave explosion of COVID-19 has started from late march. On 21thMarch, the Education Bureau has announced to have longer period for the suspension of face-to-face classes for all schools [1]. However there were different confirmed cases from particular place, the confirmed case of the employee from Hong Kong airport [2], RTHK [3] or the cases from Industrial Building [4]. Hong Kong Government started to implement various prevention measures on late March. Main prevention measures on late March and early April 25thMarch: Since the imported cases in Hong Kong were increasing rapidly, Hong

Kong government has started to cut off the virus transmission chain by strengthen the departure policies. All non-local from overseas countries entering Hong Kong were denied. All travelers from Taiwan and Macao will be issue to a 2-weeks compulsory quarantine. Reinforcing the policy for the people who need to have quarantine orders [5] 28thMarch: The Hong Kong government has put restrictions on restaurants, prohibiting all dine-in services in restaurants from 6pm [6] 29thMarch: Social-distancing measures, restricting gathering for more than four people [7] 2ndApril: Closing all the bars, nightclubs, salons and part of other entertainment venue for 2 weeks [8] Third wave explosions of COVID-19 The third wave was started from late June and early July, there was first source unknown local case on 5thJuly since 13thJune [9]. On that day, there were also 8 imported cases [10]. Then, the Hong Kong Government announced a new round of prevention measures. Main prevention measures on July 13thJuly: Closing specify entertainment venue for 1 week. Put restrictions on restaurants, prohibiting all dine-in services in restaurants from night to morning. Tighten the social-distancing measures [11]. 20thJuly: All civil servants have started to work from home. All people in indoor public places should wear mask. The policy bureaux only provided necessary services.
Lengthen the policy on 13thJuly for a week. 27thJuly: Prohibiting all dine-in services for most of the restaurant. Gatherings in public have been tightened to two people. Forcing people to wear mask in outdoor area [12]
1.2 Objectives
The goal of this project is to use doubly robust estimation to estimate the causal

effect of the prevention measures implemented by Hong Kong government. In this

project, we are going to study the average treatment effect of the second and third

waves of COVID-19 comparing the control group that is the period without policy

implementation and treatment group that is the period with policy implementation.

Our aim is to find out the efficiency of the prevention measures Hong Kong

Government made of the second and third wave explosion of COVID-19.

In order to estimate the result, we will have following objectives:

1. Data collection

 To construct a data set and to select suitable variables that is useful for this

 estimation.

2. Using Generalized Method of Moments (GMM) for estimation

 To create numbers of moment conditions and to compute the result of different

 variables.

3. Data analysis

 To analysis the result after estimating the average treatment effect by GMM.
1.3 Literature Review
In order to understand the doubly robust estimation, a similar investigation on the

same topic has been studied.

Doubly robust estimation for COVID-19 in Germany
Background

Germany encountered the first wave of COVID-19 from March, 2020. There are

thousands of number of inflections has been observed everyday in Germany from

March to April. Huber and Langen [13] have investigated on COVID-19 that they

wanted to find out how the lockdown measures implemented affect the growth of

COVID-19-related hospitalization and death rates. Several states in Germany banned

the gatherings with more than two people and implemented curfews.

Methodology

They separated two group based on the region-specific start of the epidemic,

treatment group and early intervention group. They consider semi-parametric

approach to work on doubly robust estimation which can be apply when there is

subset of regressors are missing [14]. In the research, they found out the average

treatment effects of different subsets of countries by applying the “drgee” package in

“R” suggested by Zetterqvist and Sjölander [15]. Since the effect right after the

implementations is not significant, the evaluate sample was started from 8 days after

the prevention measures. They studied the different of mean in cumulative fatalities

between two groups per 28 days after the epidemic measures.

Result

The result told us that the mean differences in first 2 weeks are close to zero. Then,

the trend goes positive and significant thereafter. Besides, they found the results of

using doubly robust estimation are similar to ordinary least squares, but doubly
robust estimation has much more obvious effect at late time of the period.

There are several important things we need to consider when we doing similar

approach. We can refer to above study to consider a better estimation. The second

wave explosion of COVID-19 in Hong Kong has sustained about a month. The period

is rather shorter than Germany. Therefore, the period of the sample for our data

should be depends on the length of the virus sustained.

Besides, we should consider the time of different epidemic measures have been

implemented in order to set the range of our data to encounter the unstableness. In

addition, we can search for some package from “R” to make our estimation

procedures more simply.
2. Methodology
2.1 Data Collection
In the data collection, we need to obtain the outcome variable and covariates. In our

project, the outcome variable is the number of confirmed cases of each day and the

covariates can be the age, gender or other things related to the outcome variable.

Adding different covariates to it could increase the accuracy for our estimation. In the

estimation of causal effect, we should have the data of treatment group and control

group. In this project, the control group is the data we collect when the government

has not implemented the prevention measures and the treatment group is the data

after the implementation. Besides, we need to decide the sample size, the confirmed

cases of the period of the data that we collect. Since there will be incubation period

for each patient, when we collect the data for right after the implementation, the

result we finally get may be unstable. Therefore, we are going to collect the data

from few days after the implementation of the policies just as what Huber and

Langen did from above literature. Since the period of the second wave explosion of

COVID-19 is relatively shorter, so we only collect 20 days for each group. For the third

wave, we can collect the data for a month for each group.
Data Set
Data Set A (Control Group)
Period: 13thMarch, 2020 to 1stApril, 2020
Data Set B (Treatment Group)
Period: 2ndApril, 2020 to 21stApril, 2020
Data Set C (Control Group)
Period: 20thJune, 2020 to 20thJuly, 2020
Data Set D (Treatment Group)
Period: 21stJuly, 2020 to 19thAugest, 2020
2.2 Defining the main variables
Let Y be the outcome variable, Y refer to the number of confirmed cases on each day.
Let X be the vector of the covariates (including a constant), X refer to age…
Let T be the binary treatment indicator.
Let = {Y, T, X}, that contains independent and identically distributed
observations.2.3 Average Treatment Effect
For the estimation of the average treatment effect, we would like to use the
approach suggested by Lewbel, Choi and Zhou[16].
First of all, our final goal is to obtain the average treatment effect from the data set.
= = 1, − = 0,
We can express in this form,
(1 − )
= { − }
1 − ( | )
Let , , be the proposed functional form of ( | , ),
Let = ( 10 , 11 , 00 , 01 )
Where , , = 10 + 11 + 1 − ( 00 + 01 )
1, , = 10 + 11 ,
0, , = 00 + 01 ,
Let , be the proposed functional form of ( | )
Let = ( 0, 1 ) ,
exp ( + 1 )
Where , = 1+exp ( 0, )
0, + 1
We will use generalized method of moments later on, therefore we decide vector of
moments to estimate , , .
− , , 1 ,
, , = =0
− 1, , − 0, ,
Which consists the estimation of by least square, minimize the sample average of
2
[ − , , ], and the estimation of
, ,
and 1 , = is the least square estimation of
− , 2
, , = 1− =0
− −
, 1 − ,
Which consists the estimation of by least square, minimize of the sample average2
of [ − , ], and the estimation of
,
and 2 = is the least square estimation of
2.4 Generalized Method of Moments estimation
We can obtain the moment conditions from the formula above.
Consider 1 , , we have
, ,
1 , =
= 1−
1−
{ − ( , , )}
{ − ( , , )}
So, we can express , , = − , , (1 − )
− , , (1 − )
− { 1, , − (0, , )}
{ − { 10 + 11 + 1 − 00 + 01 }}
{ − { 10 + 11 + 1 − 00 + 01 }}
= − { 10 + 11 + 1 − 00 + 01 } (1 − )
− { 10 + 11 + 1 − 00 + 01 } (1 − )
− {( 10 + 11 ) − ( 00 + 01 )}
We do the same thing to , , , consider 2 ,
,
We have 2 =
( 0, + 1 )
exp
(1+exp 0, + 1 )2
=
( 0, + 1 )
exp
(1+exp 0, + 1 )2
( + 1 )
exp ( 0, + 1 )
exp
{ − 1+exp ( 0, )} (1+exp
0, + 1 0, + 1 )2
( 0, + 1 )
exp ( 0, + 1 )
exp
So, we can express , , = { − 1+exp ( 0, + 1 )
} (1+exp 0, + 1 )2
(1− )
−{ ( 0, + 1 )
exp
− ( 0, + 1 )
exp
}
1−
1+exp ( 0, + 1 ) 1+exp ( 0, + 1 )If both model are correctly specified
, , = 0 and , , =0
Defining
1 1
, ≡ , , , ℎ , ≡ , ,
=1 =1
To estimate the value of { , } and { , }
We have
0 0 , 0 = 0 and ℎ0 0 , 0 = 0
for some the true coefficient values 0 , 0 and 0 .
Then, we use the “sandwich” and “gmm” package by Achim Zeileis[17] and Pierre
Chausse[18] for statistical software “R” to compute the two step GMM estimates for
each model separately. Then, the package help us to obtain the value of objective
function , and ℎ , suggested by Hansen and Singleton[19], and the
estimated value of , , ℎ and ℎ , where
, = arg , , , ℎ , ℎ = arg , ℎ ,
After using “R” to compute those values, we can obtain the GDR estimator by
calculating the weighted average of and ℎ .
, ℎ + ℎ ℎ , ℎ
=
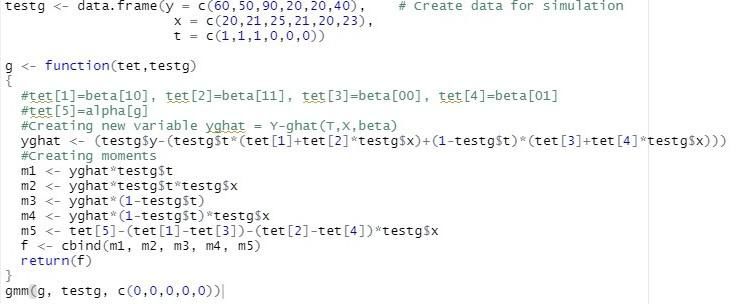
, + ℎ ℎ , ℎ3. Computation 3.1 Simulation Before the estimation for this project, we try to have a simulation for a simple data set. Figure [1] First of all, we create a dataset with = 6 and only 1 covariate. 1 We create vector of moments , = =1 , , and ℎ , = 1 =1 , , Then, we use “R” to compute the vector of moments. Figure [2]
Figure [3]

Figure [2] and figure [3] show the sample code for the estimation of ,

and ℎ , . We can obtain the estimated value of the objective

function , and ℎ ℎ , ℎ and the estimated value of , and for

both model and . Then, we can apply the weighted average formula for General

Doubly Robust estimator to obtain the average treatment effect.
3.2 Data analysis
3.2.1 Data Collection
We obtain the data from Centre for Health Protection[20],

 Figure [4]

Figure 4 shows the collected data. There are case number, report date, onset date,

gender, age, status (hospitalized/left hospital/death), local resident/ non local

resident, case classification and confirmed/suspected for each patient.

After the summarization and the selection of the data, we chose the number of total

cases on a day as the outcome variable, number of local cases and average age of

patients as the covariates.

Here is the line chart for the second wave (figure 5) and third wave (figure 6) data.

 Figure [5]
Figure [6]

*Blue = total cases(Y), green = local cases(x1), red = average age(x2)
3.2.2 Result and conclusion
After using “R” to estimate the moments, we can get the average treatment effect by

the weighted average formula.

For the second wave of the COVID-19 explosion in Hong Kong, we have 2 ≈

−9.1276. The average treatment effect , 2 < 0 and it is differ from zero. It

would suggest that the prevention measures implemented by the government on

late March and early April decreased the number of confirmed cases.

For the third wave of the COVID-19 explosion in Hong Kong, we have 3 ≈

22.5398. The average treatment effect , 3 > 0 and it is far from zero. It

would suggest that the prevention measures implemented by the government on

late July were not effective to decrease the number of confirmed cases.

To sum up the results for two period of COVID-19 explosion, it is hard to conclude

that the prevention measures were effective for controlling the growth of the

number of confirmed cases, since the two periods gave us disparate results.

Considering the third wave, the Hong Kong government implemented the policies on

13thJuly, 20thJuly and tightened the policies on 27thJuly since there were a hundred

confirmed cases for 6 consecutive days.

We try to consider a new model that we using the same control group as the

estimation for third wave explosion, and create a new treatment group from 7 days

after Hong Kong government tightened the policies to 31stAugest. By doing the same

approach, we get 3 ( ) ≈ −4.1369. The average treatment effect

 3 ( ) < 0.
The 3 ( ) < 3 , it suggested that for the late timing of prevention

measures and the tightened of measures would give us stronger treatment effect.

However, the confirmed cases are not necessarily decreased in a short period after

the implementation by the government since we got disparate result for the second

wave and the third wave explosion.

There are some reasons that the average treatment effect for two periods is

inconsistent. First of all, the virus has been mutated in the third wave explosion [22].

In the second wave, the virus strain we encountered was D614, on the other hand,

we were encountered the virus strain G614 on third wave. According to the study by

Korber et al. [23], the virus G614 is more infectious than D614. Therefore, the

outcome variable could be unstable for the third wave explosion. Besides, when we

try to consider the data in the period 21thJuly to 3rdAugest which is excluded in the

estimation for 3 and include in the estimation for 3 ( ) . To see

whether there were some special cases that make two results differ from each other

significantly. As expected there were many cases related to earlier gathering, for

example the party of handover of Hong Kong on 9thJuly or some other family

gathering [24]. As the incubation period varies amongst different cases, the data

recorded by right after the date might be unstable. In order to avoid this problem, we

estimated a new parameter 3 ( ) .
4. References
[1] Now News. 3 月 21 日疫情速報 https://news.now.com/home/local

 /player?newsId=385121 (accessed 15 Oct. 2020)

[2] Mingpao. 星巴克員工確診新冠病毒機場兩分店停業消毒清潔

 https://news.mingpao.com/ins/%E6%B8%AF%E8%81%9E/article/20200323/s00

 001/1584945256656 (accessed 15 Oct. 2020)

[3] Thestandnews. Now 新聞台男剪片確診 https://bit.ly/38BzLsZ

[4] HK01. 新冠肺炎 逾百人白色情人節參與 Studio 9 私人派對有四人確診

 https://bit.ly/3o5Qj37 (accessed 15 Oct. 2020)

[5] GovHK. Government Announces Enhancements to Anti-epidemic Measures in Four

 Aspects. https://www.info.gov.hk/gia/general/202003/24/P2020032400050.htm

 (accessed 16 Oct. 2020)

[6] Reuters. Hong Kong Bans Public Gatherings of More Than Four People

 https://www.reuters.com /article/us-china-health-hongkong/ hong-kong- bans

 -public-gatherings-of-more-than-four-people-idUSKBN21E1MW (accessed 16

 Oct. 2020)

[7] GovHK. Prevention and Control of Disease (Prohibition on Group Gathering)

 Regulation. https://www.info.gov.hk/gia/general/202003/28 /P2020032800

 720.htm?fontSize=1 (accessed 16 Oct. 2020)

[8] News.gov.hk. 六類場所營運限制指示生效 https://www.news.gov.hk

 /chi/2020/04/20200401/20200401_203740_023.html (accessed 16 Oct. 2020)

[9] Now News. 仁濟醫院 59 歲男患者初步確診感染源頭暫時未明

 https://news.now.com/home/local/player?newsId=396783&home=1

[10] Now News. 7 月 5 日疫情速報 https://news.now.com /home/local

 /player?newsId=396795 (accessed 16 Oct. 2020)
[11] BBC News. 肺炎疫情:香港本地病例爆發兇猛 特區政府首下令公交乘客戴

 口罩「限聚令」重新收緊 https://www.bbc.com/zhongwen /trad

 /chinese-news-53390577 (accessed 17 Oct. 2020)

[12] SCMP. Hong Kong Third Wave: Record 145 Covid-19 Cases Trigger Toughest

 Preventive Measures Yet. https://www.scmp.com/news/hong-kong/health-

 environment/article/3094787/hong-kong-third-wave-social-distancing-measure

 s (accessed 17 Oct. 2020)

[13] Huber M. and Langen H. Timing matters: the impact of response measures on

 COVID-19-related hospitalization and death rates in Germany and Switzerland.

 Swiss Journal of Economics and Statistics https://link.springer.com /article

 /10.1186/s41937-020-00054-w (accessed 13 Nov. 2020)

[14] Robins J.M., Rotnitzky A. & Zhao, L.P. (2020). Estimation of Regression

 Coefficients When Some Regressors are not Always Observed Tandfonline.

 https://www.tandfonline.com/doi/abs/10.1080/01621459.1994.10476818

 (accessed 13 Nov. 2020)

[15] Zetterqvist J. and Sjölander A. Doubly Robust Estimation with the R Package

 drgee. https://www.degruyter.com/view /journals/em/4/1/article-p69.xml

 (accessed 13 Nov. 2020)

[16] Lewbel A., Choi J. Y. and Zhou Z. General Doubly Robust Identification and

 Estimation. https://www.econ.cuhk.edu.hk/econ /images/content /news_event

 /seminars /2018-19_2ndTerm/Lewbel.pdf (accessed 5 Dec. 2020)

[17] Zeileis A. Robust Covariance Matrix Estimators. https://cran.r-project.org/web

 /packages/sandwich/index.html (accessed 5 Dec. 2020)

[18] Chausse P. Generalized Method of Moments and Generalized Empirical

 Likelihood. https://cran.r-project.org/web/packages/gmm/gmm.pdf (accessed 5

 Dec. 2020)
[19] Hansen L.P., Singleton K. J., Generalized Instrumental Variables Estimation of

 Nonlinear Ration Expectations Models. http://www-2.rotman.utoronto.ca /~kan

 /3032/pdf/GeneralizedMethodOfMoments/Hansen_Singleton_Econometrica_1

 982.pdf (accessed 12 Dec. 2020)

[20] The Centre for Health Protection. 2019 冠狀病毒病個案的最新情況

 https://www.chp.gov.hk/files/pdf/local_situation_covid19_tc.pdf (accessed 13

 Nov. 2020)

[21] SCMP. Hong Kong Third Wave: Record 145 Covid-19 Cases Trigger Toughest

 Preventive Measures Yet. https://www.scmp.com/news/hong-kong

 /health-environment/article/3094787/hong-kong-third-wave-social-distancing-

 measures (accessed 13 Nov. 2020)

[22] Nature. Spike Mutation D614G Alters SARS-CoV-2 Fitness.

 https://www.nature.com/articles/s41586-020-2895-3 (accessed 17 Dec. 2020)

[23] Korber et al. Tracking Changes in SARS-CoV-2 Spike: Evidence that D614G

 Increases Infectivity of the COVID-19 Virus. ScienceDirect.

 https://www.sciencedirect.com/science/article/pii/S0092867420308205

 (accessed 17 Dec. 2020)

[24] On.cc. 今新增 113 宗確診創單日新高 https://hk.on.cc/hk/bkn/cnt/news

 /20200722/bkn-20200722125453880-0722_00822_001.html (accessed 17 Dec.

 2020)
You can also read