DIVERSITY AND INCLUSION RATINGS FROM REFINITIV - METHODOLOGY
←
→
Page content transcription
If your browser does not render page correctly, please read the page content below
DIVERSITY AND
                   INCLUSION RATINGS
                   FROM REFINITIV
                   METHODOLOGY

                   .

Date of issue: Aug 2021
Diversity & Inclusion Rating - Methodology                     2

Contents
About this document .......................................................................................................................................................................3
   Intended readership ....................................................................................................................................................................3
   Feedback ....................................................................................................................................................................................3
Introduction .....................................................................................................................................................................................4
Calculation Methodology.................................................................................................................................................................6
Diversity and Inclusion scoring example .........................................................................................................................................9
Appendix 1 – ESG measures used ...............................................................................................................................................10

Date of issue: Aug 2021
Diversity & Inclusion Rating - Methodology   3

About this document
Intended readership
This document supports data use by Refinitiv clients. Clients receive the data as part of their desktop license or may be licensed
to use Refinitiv data in a separate licensing agreement.

Feedback
Your questions about the document, suggestions, and contributions are welcome. Please address enquiries to:
icaesg.siebel@refinitiv.com.

Date of issue: Aug 2021
Diversity & Inclusion Rating - Methodology   4

Introduction
Refinitiv Diversity & Inclusion Ratings
Diversity and Inclusion (D&I) ratings powered by Refinitiv ESG data are designed to transparently and objectively measure the
relative performance of companies against factors that define diverse and inclusive workplaces.

It is designed on the hypothesis that companies tracking, reporting and achieving on measures of diversity, inclusion and people
development will, collectively and over time, offer diversification away from portfolios constructed using different selection
criteria such as market capitalization alone1 . Refinitiv’s D&I rating provides the information to help users identify long-term
opportunities and risks in their investments.

Available through Eikon®, the D&I rating ranks over 11,000 publicly listed companies, as measured by 24 separate metrics
across four key pillars. The data is gathered from publicly available information sources and is manually collected to ensure that
the information is standardized, comparable and reliable. All of the ESG data collected is quality controlled and verified in a
rigorous process by our experienced analysts and robust automated checks

Refinitiv ESG Data
Refinitiv provides objective and transparent environmental, social and governance (ESG) information and analysis tools to
enable professional investors to benchmark, compare and integrate extra-financial information into their investment processes.
We offer the most comprehensive ESG database containing information on more than 11,000 global companies and over 500
measures, including all exclusion (ethical screening) criteria and all aspects of sustainability performance, collected and
standardized by more than 360 experienced analysts to ensure data accuracy and comparability.

1   Past performance is not necessarily indicative of future performance

Date of issue: Aug 2021
Diversity & Inclusion Rating - Methodology   5

Refinitiv’s ESG database provides the most in-depth coverage in the industry, tracking detailed ESG data on a broad range of
companies, including the constituents of indices such as the S&P 500, ASX300, MSCI World, MSCI Emerging Markets,
FTSE100, Bovespa and many more.

The data is gathered from publicly available information sources and is manually collected to ensure information is
standardized, comparable and reliable. All of the ESG data collected is quality controlled and verified in a rigorous process by
our experienced analysts and robust automated checks.

The public availability of ESG information varies across different countries, industries and market capitalizations. The ESG
database is therefore more reflective of companies with a greater degree of ESG data disclosure. These include companies
listed in countries where regulatory or investor demand favours such disclosure, companies in industries with a tradition of ESG
transparency and companies with mid to large market capitalizations.

For more information or inquiries, visit Refinitiv ESG data.

Data Source: Business Classifications
The D&I ratings leverage The Refinitiv Business Classification (TRBC) as the benchmark for some of the metrics and to
calculate weights by industry group. TRBC is an industry classification system that is owned and operated by Refinitiv. The
market-oriented system tracks the primary business of a corporation and reflects global industry practices by grouping together
correlated companies that offer products and services into similar end markets.

TRBC is used by the investment community for navigation, aggregation and benchmarking. It provides a global standard for
intelligently identifying peers, tagging research, aggregating financial content and transforming the torrent of news and
information into insightful trends. It delivers a solid foundation for aggregating financial ratios, portfolio benchmarking and
attribution analysis

Date of issue: Aug 2021
Diversity & Inclusion Rating - Methodology 6
Calculation Methodology
Introduction
The D&I rating is calculated on a quarterly basis after close of business on the final business day of each calendar quarter
(determined using the New York Stock Exchange trading calendar) and using the most recent weekly data update from the ESG
database. The new rebalance is effective at market open on the first business day of the new calendar quarter.
The D&I rating is calculated as follows:
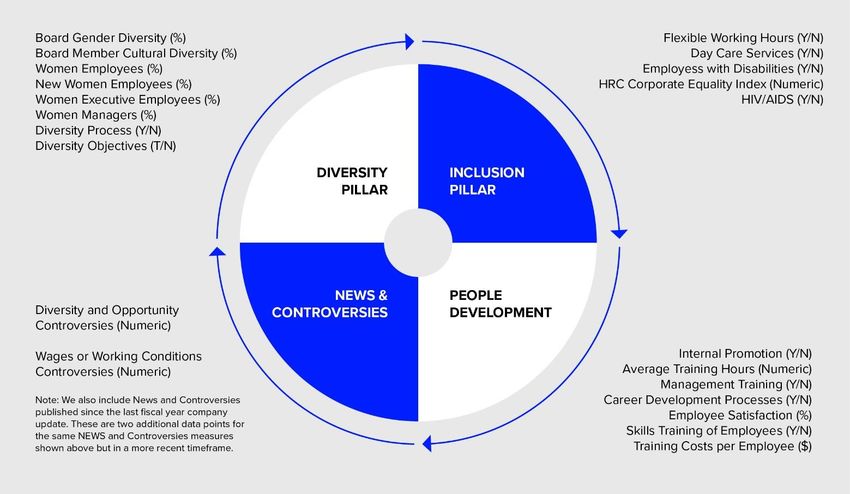
• We select 24 measures that are relevant to diversity and inclusion out of more than 500 measures available in
Refinitiv’s ESG database
• Each of these 24 measures is allocated to one of four pillars: diversity, inclusion, people development and
controversies. The measures are dynamically weighted according to their availability within an industry or country
• Values for three of the four pillars are then calculated using a weighted average of their constituent measures
• A value for the controversies pillar is calculated as a simple average of its constituent measures.
• The overall D&I rating for each company is the simple average of the four pillar scores (each must be greater than zero
for the company to be assigned an overall D&I rating).
Company selection and classification
The company selection procedure starts by taking the universe of companies covered by the ESG database. For each
company, data for 24 measures is taken from the ESG database (for a list of the measures, see Appendix: ESG measures
used). For each company, the measures used cover the latest Fiscal Year (FY) available.
From the ESG data, individual companies are identified using a unique company identifier. For each individual company, static
data (organization name, region, country, ISIN, fiscal year, TRBC industry) and the 24 measures are identified for the latest FY.
This process results in a data set or data dictionary for each company.
Once a data dictionary has been compiled for each company, free float market capitalizations are determined 2 and companies
are classified according to their capitalization. Classifications are determined on a country basis, in which the top 70% of
Date of issue: Aug 2021Diversity & Inclusion Rating - Methodology 7
companies (by cumulative market capitalization value) are considered large cap and the companies in the 70% to 88% region of
cumulative market cap are considered mid cap. All others keep the default small cap classification. Capitalization classification
could potentially be done by region, but it is believed that a country-based classification is optimal.
The default configuration for the index rebalancing engine is to exclude inactive companies from the calculation steps below
Determining min/max values for measures
To scale the scores of individual measures, it is necessary, for each measure, to calculate a minimum/maximum value for each
measure in each of the TRBC industry groups. The complete set of companies under consideration is iterated through and the
data dictionary for each is examined to update the data dictionary entries.
Determining measure weights by industry group/country
Many individual measures are weighted based on the availability of that measure across companies in that industry group
(TRBC Level 3) or country. To determine those weights, it is necessary to first:
(1) Perform a count for each measure, by both industry group and country. For Boolean measures, only Yes (‘Y’) values
are counted. Values that are missing, empty (null), or NA are not counted
(2) Convert the raw counts to percentages, when there are more than 10 companies available. If there are 10 or fewer in
the industry group or country, the percentage is set to zero and a pillar score is not calculated
(3) Use the availability percentages to identify boundaries for assigning quartiles (i.e. for a given measure and industry
group or country, determine into which quartile that percentage falls)
Once the steps above are complete, the quartile assignments can be used to determine the weighting (25%, 50%, 75% or
100%) for that measure within its industry group or country. In the final step, each company is tagged if it belongs to either an
industry or a country for which there are insufficient members to form a benchmark.
Calculating diversity / inclusion / people development pillar ratings
The diversity, inclusion and people development pillars all use the same methodology to calculate the pillar ratings. The steps
are:
(1) Determine the measures involved in the pillar’s calculation (see Appendix: ESG measures used for a mapping of
measures to pillar).
(2) For each company:
a. For each measure used in the pillar:
i. Determine the measure weight (based on whether the measure is weighted relative to
industry group or to country) ii. Add the measure weight to the pillar weight total iii. If the
measure is present:
1. Convert non-numeric values to the appropriate numeric value (i.e. Booleans are mapped
to 0/1, strings are mapped as determined by a data file)
2. If numeric value is not a number (e.g. value was NA) or a Boolean ‘N’ (No) value,
increase transparency count
3. Obtain the appropriate min/max value for the measure within the industry group
4. Calculate the raw score as:
(numericValue-minValue)/(maxValue-minValue)
b. Use the raw scores for each measure to create the normalized scores for each measure. Each normalized
measure score is computed as: rawScore * (MeasureWeight/sumOfWeights)
The sum of the normalized scores, rounded to an integer value, forms the overall score for the company for that pillar.
Calculating controversies scores
The methodology for calculating the controversies score is considerably simpler. It is based on the company’s market cap
classification, and for each measure, whether any controversies were reported (the measures contain the number of
controversies, but this is not taken into account). The methodology steps are:
Date of issue: Aug 2021Diversity & Inclusion Rating - Methodology 8
(1) Determine the measures involved in the pillar’s calculation (see the column ‘Pillar’ in the Measure Names declarative
file, described in the appendix below)
(2) For each company:
a. For each measure used in the pillar:
i. If measure is not present for the company or is NA, score 100 for the measure (no controversies
is considered a positive)
ii. If the measure is present and is a positive number, score based on market capitalization (large =
50; mid = 25; small = 0)
b. The score for the controversies pillar is the average score for the individual measures, rounded to an
integer value
Controversies pillar is the only pillar in which the measures are updated every two weeks, rather than on a fiscal year basis.
Final rating assembly
Overall rating is based on a simple average of the four individual pillar scores. A company must have non-zero scores on all four
pillars to have an overall rating computed. The decision was made to omit the assignment of overall scores to companies
scoring zero on one or more pillars. The rationale behind the decision was that their inclusion would reduce the mean score,
making the ‘average’ significantly lower. For the overall rankings, the intent was to rank only those companies that are actively
tracking and reporting on all four pillars.
Date of issue: Aug 2021Diversity & Inclusion Rating - Methodology 9
Diversity and Inclusion scoring example
In this section, we will illustrate how a pillar score gets calculated using the data available in the ESG database as of June 2017.
The sample company is Refinitiv, using the latest available data and the inclusion pillar score is 67%.
The following five measures make up the inclusion pillar:
Pillar Eikon Item Code Description Benchmark group
Inclusion TR.USLGBTEqualityIndex The score of the company in the HRC corporate equality index from the Country
Human Rights Campaign Foundation.
Inclusion TR.FlexibleWorkingHours Does the company claim to provide flexible working hours or working Industry
hours that promote a work-life balance?
Inclusion TR.DayCareServices Does the company claim to provide day care services for its employees? Country
Inclusion TR.EmployeesWithDisabilities Percentage of employees with disabilities or special needs Country
Inclusion TR.HIVAIDSProgram Does the company report on policies or programs on HIV/AIDS for the Country
workplace or beyond?
Refinitiv’s country group is United States and its industry group (TRBC level 3) is Professional & Commercial Services. In the
rebalance used for the example here, for the scoring universe (1978 companies), the set of companies within the United States
group is 748, while the set of companies within the industry group is 60.
The raw measure values are obtained, then the min/max value for the measure within the benchmark group is extracted, and
applying the formula ((numericValue-minValue)/(maxValue-minValue)), we convert the raw measure value to a raw numeric
value.
Individual measure weights are computed using counts within the appropriate KPI peer group (method described in the previous
section), where counts are converted to percentages, which are then used to determine quartiles.
For example, the measure representing the HIV-AIDS program has a weight of 0.75. This was derived by performing a count of
the ‘Y’ values within the benchmark group: country (67), converting that to a percentage (67/748*100=8.957%). Over all the
countries for this measure, this score determined that the United States would fall in the third quartile (0.75).
This same process was used to determine the measure weights for each measure in the pillar as illustrated in the table below.
The sum of the weights in the inclusion pillar is therefore 3.75. The raw numeric values and the weights are used to compute the
normalized score for each measure.
Eikon Item Code Raw Data Min/Max Value Raw Numberic Value Measure Weight Normalized Score
TR.USLGBTEqualityIndex 100 -25,100 (100-(-25)) / (100-(-25)) = 1 1 1*(1/3.75)=
0.266666
TR.FlexibleWorkingHours Yes 0, 1 Yes/No, converts to 1 0.75 1*(0.75/3.75)= 0.2
TR.DayCareServices No 0, 1 Yes/No, converts to 0 1 0*(1/3.75)= 0
TR.EmployeesWithDisabilities N/A 0.0073, 0.054 No value collected (NA), converts to 0.25 0*(0.25/3.75)= 0
(0.73%, 5.4%) 0
TR.HIVAIDSProgram Yes 0, 1 Yes/No, converts to 1 0.75 1*(0.75/3.75)= 0.2
Inclusion pillar final score is calculated as round ((0.266666+0.2+0+0+0.2)) = 0.67 = 67 (%).
Date of issue: Aug 2021Diversity & Inclusion Rating - Methodology 10
Appendix 1 – ESG measures used
Pillar Eikon Item Code Description Benchmark
group
Controversies TR.ControvDiversityOpportunity Number of controversies published in the media linked to Market Cap
workforce diversity and opportunity (e.g. wages, Classification
promotion, discrimination and harassment).
Controversies TR.RecentControvDiversity Number of controversies linked to workforce diversity and Market Cap
opportunity (e.g. wages, promotion, discrimination and Classification
harassment) published since the last fiscal year company
update.
Controversies TR.ControvWorkingCondition Number of controversies published in the media linked to Market Cap
the company's relations with employees or relating to Classification
wages or wage disputes.
Controversies TR.RecentControvWorkingCondition Number of controversies linked to the company's relations Market Cap
with employees or relating to wages or wage disputes Classification
published since the last fiscal year company update.
Diversity TR.AnalyticBoardCulturalDiversity Percentage of board members that have a cultural Country
background different from the location of the corporate
headquarters.
Diversity TR.PolicyDiversityOpportunity Does the company have a policy to drive diversity and Industry
equal opportunity?
Diversity TR.TargetsDiversityOpportunity Has the company set targets or objectives to be achieved Industry
on diversity and equal opportunity?
Diversity TR.WomenEmployees Percentage of women employees. Industry
Diversity TR.NewWomenEmployees Percentage of new women employees. Industry
Diversity TR.WomenManagers Percentage of women managers Industry
Diversity TR.AnalyticBoardFemale Percentage of females on the board. Country
Diversity TR.AnalyticExecutiveMembersGenderDiversity Percentage of female executive members. Country
Inclusion TR.USLGBTEqualityIndex The score of the company in the HRC corporate equality Country
index from the Human Rights Campaign Foundation.
Inclusion TR.FlexibleWorkingHours Does the company claim to provide flexible working hours Industry
or working hours that promote a work-life balance?
Inclusion TR.DayCareServices Does the company claim to provide day care services for Country
its employees?
Inclusion TR.EmployeesWithDisabilities Percentage of employees with disabilities or special Country
needs.
Inclusion TR.HIVAIDSProgram Does the company report on policies or programs on Country
HIV/AIDS for the workplace or beyond?
People TR.PolicySkillsTraining Does the company have a policy to improve the skills Industry
Development training of its employees?
People TR.PolicyCareerDevelopment Does the company have a policy to improve the career Industry
Development development paths of its employees?
People TR.AvgTrainingHours Average hours of training per year per employee. Industry
Development
People TR.InternalPromotion Does the company claim to favor promotion from within? Industry
Development
People TR.MgtTraining Does the company claim to provide regular staff and Industry
Development business management training for its managers?
People TR.AnalyticTrainingCosts Training costs per employee in U.S. dollars Industry
Development
People TR.EmployeeSatisfaction The percentage of employee satisfaction as reported by Industry
Development the company.
Date of issue: Aug 2021Diversity & Inclusion Rating - Methodology 11 Refinitiv is one of the world’s largest providers of financial markets data and infrastructure, serving over 40,000 institutions in approximately 190 countries. It provides leading data and insights, trading platforms, and open data and technology platforms that connect a thriving global financial markets community – driving performance in trading, investment, wealth management, regulatory compliance, market data management, enterprise risk and fighting financial crime. Date of issue: Aug 2021
You can also read