DNA Methylation Proles of Immune Cells From Tuberculosis-Exposed Individuals Overlap With BCG-Induced Epigenetic Changes
←
→
Page content transcription
If your browser does not render page correctly, please read the page content below
DNA Methylation Profiles of Immune Cells From
Tuberculosis-Exposed Individuals Overlap With
BCG-Induced Epigenetic Changes
Isabelle Pehrson
Linköping University
Nina Idh
Linköping University
Clara Braian
Linköping University
Jakob Paues
Linköping University
Jyotirmoy Das
Linköping University
Maria Lerm ( maria.lerm@liu.se )
Linköping University
Research Article
Keywords: DNA methylation, tuberculosis, BCG, epigenetics, sputum induction
Posted Date: January 5th, 2022
DOI: https://doi.org/10.21203/rs.3.rs-1157082/v1
License: This work is licensed under a Creative Commons Attribution 4.0 International License.
Read Full License
Page 1/24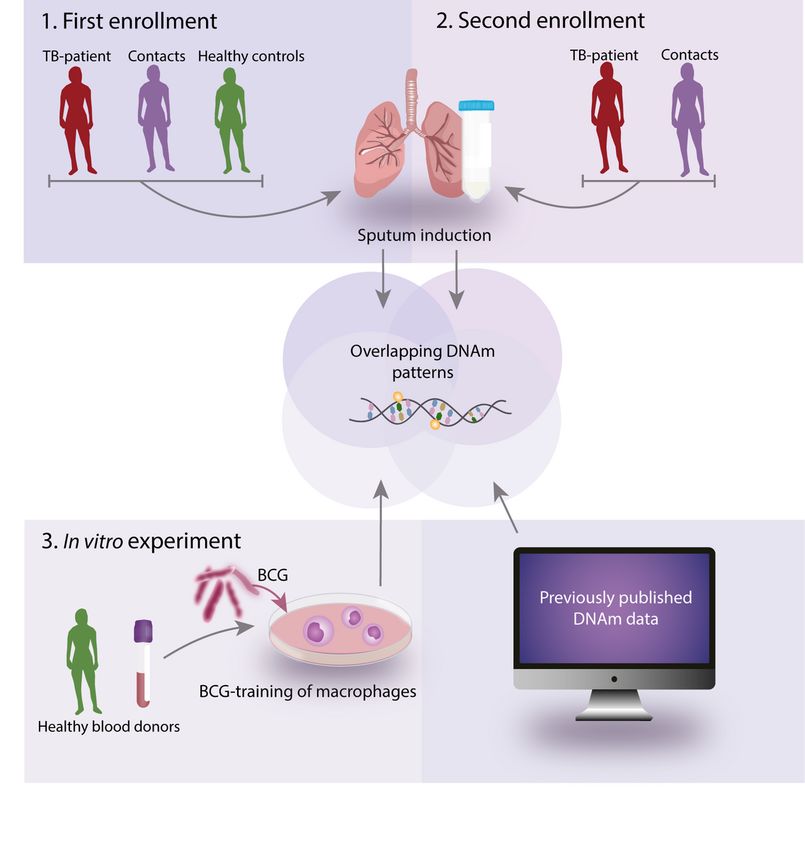
Abstract
The mechanism of protection of the only approved tuberculosis (TB) vaccine, Bacillus Calmette Guérin
(BCG) is poorly understood. In recent years, epigenetic modifications induced by BCG have been
demonstrated to reflect a state of trained immunity. The concept of trained immunity is now explored as
a potential prevention strategy for a variety of infections. Studies on human TB immunity are dominated
by those using peripheral blood as surrogate markers for immunity. Here, we instead studied the lung
compartment by obtaining induced sputum from subjects included in a TB contact tracing. CD3- and
HLA-DR-positive cells were isolated from the collected sputum and DNA methylome analyses performed.
Unsupervised cluster analysis revealed that DNA methylomes of cells from TB-exposed individuals and
controls appeared as separate clusters, and the numerous genes that were differentially methylated were
functionally connected. The enriched pathways were strongly correlated to previously reported epigenetic
changes and trained immunity in immune cells exposed to the BCG vaccine in human and animal
studies. We further demonstrated that similar pathways were epigenetically modified in human
macrophages trained with BCG in vitro. Altogether, our study demonstrates that similar epigenetic
changes are induced by M. tuberculosis and BCG.

Introduction
Tuberculosis (TB) is a pulmonary infection of pandemic rank and an expansion of the current toolkit for
diagnosis, prevention and treatment is critical for reaching the United Nations’ Sustainable Development
Goals for 2030 of ending the TB epidemic1. TB is caused by Mycobacterium tuberculosis, which transmit
via aerosols and target alveolar macrophages in exposed individuals2. In susceptible hosts, the bacteria
replicate inside the macrophages and use them as trojan horses in order to disseminate in the tissues 3.
Bacillus Calmette Guérin, a non-virulent derivative of Mycobacterium bovis, has been used for almost a
century as a vaccine against TB, with variable efficacy. Numerous studies have failed to provide
correlates of protection, leaving the vaccine mechanism elusive. In recent years, the concept of trained
immunity has evolved as an epigenetically encoded immune memory that can be triggered by a variety of
stimuli and is reflected in a reprogrammed immune state characterized by a higher magnitude of
response to subsequent pathogen challenges. The discovery of epigenetically regulated antimicrobial
defense mechanisms goes beyond the classical understanding of immune defense and opens up a new
field of research. Along this line, we have demonstrated that administration of the BCG vaccine to healthy
subjects induced profound epigenetic alterations in immune cells, which correlated with enhanced anti-
mycobacterial activity in macrophages isolated from the vaccinees4. The changes were reflected in the
DNA methylome, with the strongest response being recorded within weeks after vaccination4. Our
observation that BCG induces alterations of the DNA methylome of immune cells has later been
confirmed by others5,6. Since BCG vaccination reflects an in vivo interaction between immune cells and
viable mycobacteria, we here hypothesized that natural exposure to M. tuberculosis would induce similar
changes not only in TB patients, but also in individuals who have been exposed to TB. Analyses of DNA
methylomes of immune cells isolated from lungs and peripheral blood allowed us to identify distinct DNA

                                                 Page 2/24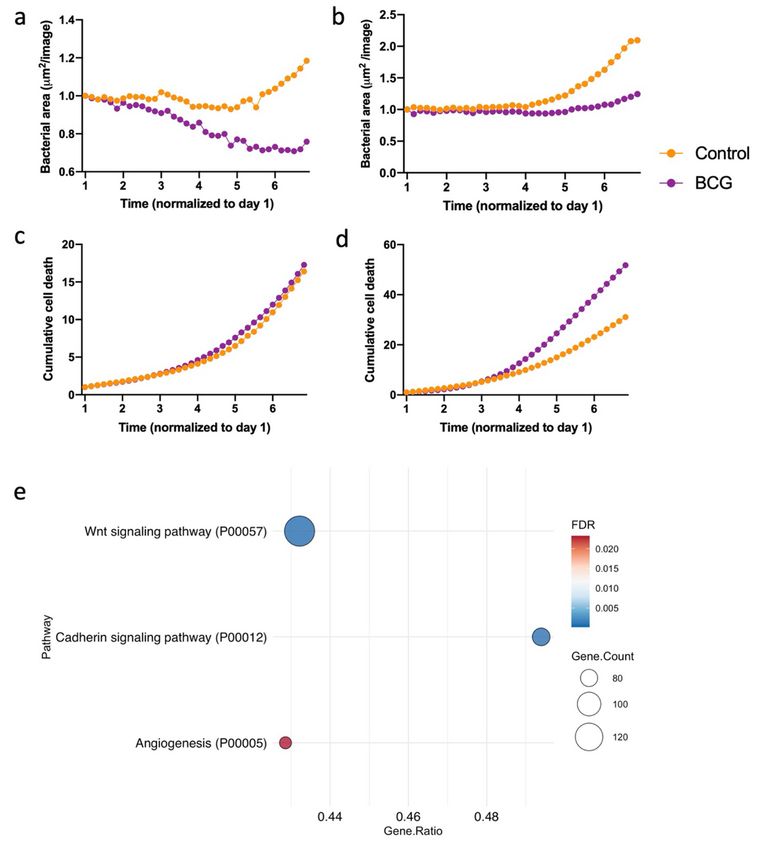
methylation (DNAm) signatures in TB-exposed individuals. Pathway analyses revealed strong overlaps
with previous studies on BCG-induced epigenetic signatures that could be correlated with protection
against M. tuberculosis. We therefore set up an experiment to scrutinize the anti-mycobacterial
mechanisms correlating with BCG-induced epigenetic reprogramming in human primary macrophages.
BCG-trained macrophages were subjected to DNA methylome analysis and in parallel monitored in a live
cell imaging system during exposure to M. tuberculosis. Again, the DNAm change in vitro highly
overlapped with the signatures of the TB-exposed individuals and the previously identified BCG-induced
epigenetic changes.
Results
Study design
To determine epigenetic changes in the immune cells in TB-exposed individuals, we recruited subjects
enrolled in a TB contact tracing at Linköping University Hospital, Sweden, according to standard contact
tracing routines (household contacts and persons with >8 hours of interaction with the index case). First,
we included one index case and three contact tracing subjects who were ethnicity-matched and not
relatives (Table 1). The patient with active tuberculosis (referred to as ‘index case’) was diagnosed with
drug-sensitive pulmonary TB and had completed two out of six months of standard treatment at the time
of sample collection. Age- and ethnicity-matched individuals were included as controls (Table 1). In the
second part of the study, we included three subjects (one TB patient and two subjects in other contact
tracings) who were not ethnicity-matched (Table 1). All included subjects except one (a TB contact) had
been BCG-vaccinated at least two years before participation (Table 1). Interferon-Gamma Release Assay
(IGRA) status was determined and among the exposed individuals, two were positive (including the index
case) and among the controls, one individual (C2) was classified as ‘borderline’- positive7 (Table 1). From
induced sputum, we used an established protocol for the separate isolation of HLA-DR-positive and CD3
positive cells8, whereas the PBMC fraction extracted from blood was kept as a mixed population. For the
in vitro experiment with BCG and M. tuberculosis exposure, human primary monocytes were collected
from blood samples from healthy blood donors and differentiated into macrophages (Fig. 1).
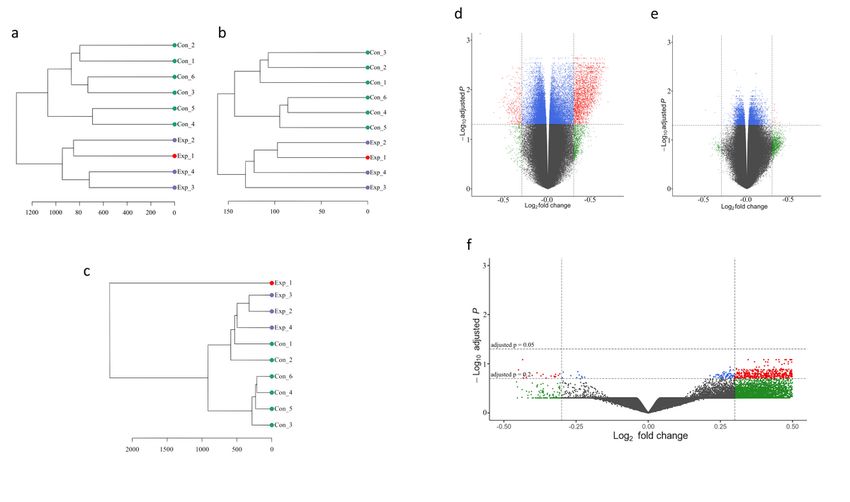
DNA methylome data from TB-exposed individuals form a
separate cluster
DNA isolation from the studied cell populations was followed by global DNAm analysis using the
Illumina 450K protocol. After curation of the data9, the datasets were subjected to unsupervised
hierarchical cluster analysis based on DNA CpG methylation β-values. This unsupervised approach
accurately clustered the participants into TB-exposed and controls based on the DNA methylome data
derived from both HLA-DR- and CD3-positive cell populations (Fig. 2a-b). On the other hand, in the PBMC-
derived dataset, the TB index case appeared outside the clusters and two of the controls clustered with
the other exposed individuals, one of them (“Con_2”) being the individual identified as IGRA borderline-
positive (Fig. 2c).
Page 3/24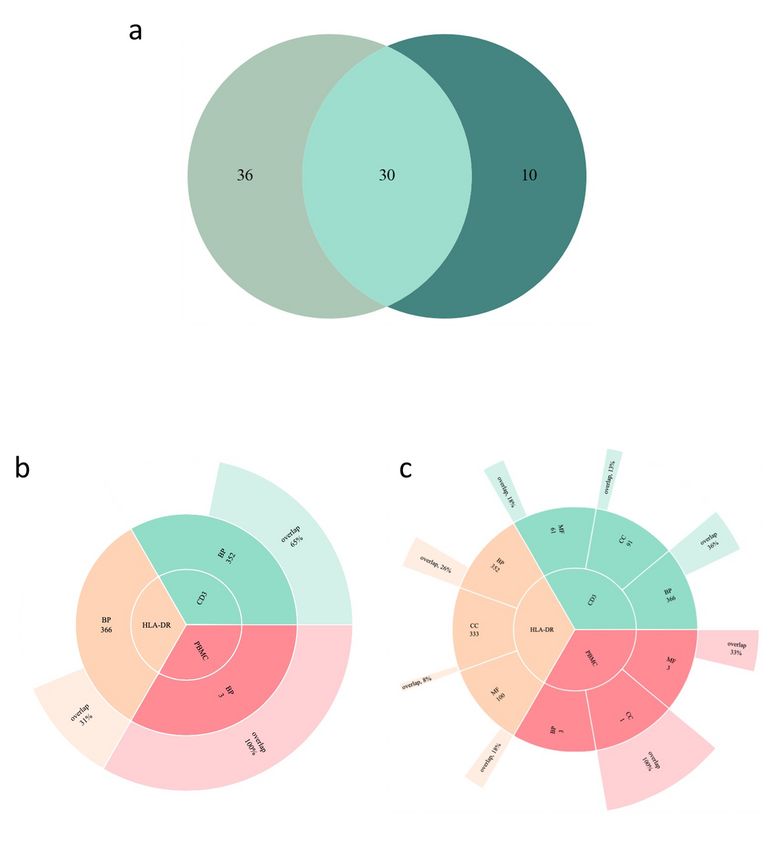
Next, we identified the differentially methylated CpG sites (DMCs) and differentially methylated genes
(DMGs) by comparing the TB-exposed and control groups for each cell population. To filter out the most
significantly altered DMGs in the dataset, the stringency criteria of log2>|0.3| fold increased or decreased
β-values and Benjamini-Hochberg (BH)-corrected p-value
In 2018, Hasso-Agopsowicz et al. described alterations in DNAm patterns in PBMCs from BCG-vaccinated
individuals, with concomitant enrichment in many immune-related pathways5. In order to compare that
study with ours, we performed PANTHER analysis with the 185 common DMGs and matched the
identified enriched pathways, revealing that 75% of those pathways were the same as in the present
study (Fig. 5a), further corroborating the relationship of the altered DNAm patterns induced through TB
exposure and BCG-induced changes. In a study by Kaufmann et al., BCG-induced alterations of the
epigenome in mice was correlated with protection against M. tuberculosis infection18. In order to
translate our human DNA methylome signature to the signature identified in the mouse study, we
searched for pathway overlaps between the two using Gene Ontology (GO) enrichment analysis (Suppl.
Fig. S2a-c). Figure 5b demonstrates that for our PBMC data, the GO terms “biological processes”
overlapped 100% with the mouse study (same cell population) and to 31% and 65% for HLA-DR- and CD3-
positive cells, respectively. In 2014, Saeed et al 19 demonstrated the induction of trained immunity
pathways by another immune-training agent, β-glucan. We assessed possible pathway overlap with that
study and although there were fewer overlaps as compared to the BCG-induced pathways described
above. Again, the strongest correlation was found in the PBMC fraction, in this case in the GO terms
“cellular components” (Fig. 5c).

To validate how well the 284 CpG sites corresponding to the 185 overlapping DMGs performed in an
unsupervised cluster analysis, we included one additional TB patient and two contacts, and collected
HLA-DR-positive cells from induced sputum, as the DNA methylome data from this cell type was clearly
outperforming the others with respect to accurate separation of the groups. Figure 6 shows a k means-
based dendrogram with a heatmap of the β values of the 284 CpG sites from both previous and new
subjects’ DNAm data, revealing a distinct separation of the subjects in accordance with TB exposure.

In vitro BCG training of macrophages induced DNAm
changes corresponding to exposure to TB
To investigate whether the BCG-induced epigenetic changes can be mimicked in vitro, we set up a BCG
training experiment with macrophages isolated from donor blood that were trained with BCG and
subsequently infected with the virulent M. tuberculosis strain H37Rv (expressing GFP) and monitored
during the course of infection. In a subset of donors, BCG-trained cells displayed an increased capacity to
kill M. tuberculosis (Fig. 7a-b) while cell viability was retained (Fig. 7c-d). DNAm analyses was performed
on DNA isolated from these donors’ macrophages 24 hours after BCG training. We identified 7471 DMGs
with the stringency criteria of DNAm difference > 30% and BH corrected p-value < 0.01. A PANTHER
pathway analysis based on the identified DMGs showed significant enrichment in the Wnt signaling
pathway, cadherin signaling pathways and angiogenesis, overlapping with the over-represented pathways
in the HLA-DR+ and CD3+ cells from the TB-exposed individuals (Fig. 7e).

Discussion

                                                 Page 5/24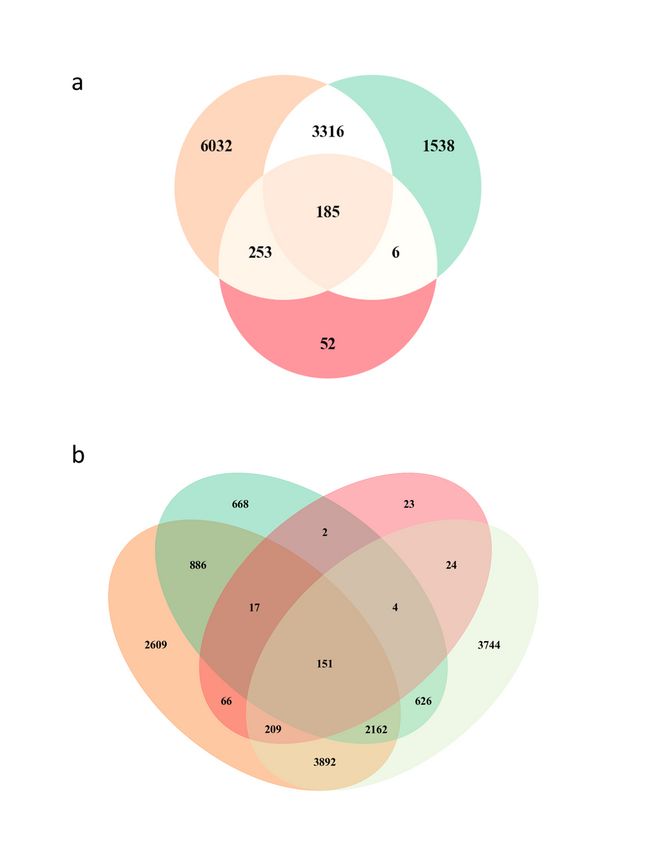
In this study, we present data suggesting that exposure to TB generates a distinct DNAm signature in
pulmonary immune cells. The signature was found not only in those with active or latent TB infection, but
also in individuals who are exposed but IGRA-negative. The finding that healthy, TB-exposed individuals
also carry the signature opens the possibility that the epigenetic alterations reflect a host-beneficial
reprogramming of the immune mechanisms rather than being induced by M. tuberculosis as a step to
evade the immune defense. This notion is supported by our observation that the DMGs identified in the
present study strongly overlapped with the epigenetic alterations identified in the in vitro BCG-trained
macrophages, and the previously reported DNAm changes induced during BCG vaccination, which
correlated with increased anti-mycobacterial capacity of macrophages4. In addition, we demonstrate that
the GO data derived from our dataset display a strong overlap with data from a study on protective BCG
vaccination in mice6.

BCG vaccination has convincingly been shown to induce heterologous immunity protecting against
childhood mortality from other causes than TB20,21. Based on our finding that natural TB exposure and
BCG vaccination trigger similar epigenetic changes we propose the hypothesis that a “beneficial
exposure” to TB exists, which protects against other infections through heterologous immunity. Along the
same line, it has been shown that a substantial fraction of individuals exposed to TB can be defined as
‘early clearers’, since they remain tuberculin skin test or IGRA negative22, suggesting effective eradication
of the infection22. Identifying these early clearers and understanding the biology behind their resistance
to TB infection could move the field forward towards novel strategies of TB prevention.

In concordance with the fact that macrophages constitute the main niche for mycobacterial replication,
the strongest enrichment of DNAm changes was observed in the HLA-DR-positive cell population, which
is dominated by alveolar macrophages. The pathways identified to be enriched in the HLA-DR-positive
population have been described in the context of trained immunity, BCG exposure and TB. For example,
activation of Hypoxia-Inducible Factor 1 α and glycolysis pathways (P00030 and P00024, respectively)
are hallmarks of macrophages that have undergone the epigenetic changes reflective of trained immunity
(reviewed in 23,24), which is induced in myeloid cells upon BCG-stimulation22,23. VEGF-release (P00056)
by macrophages has been shown to recruit immune cells during granuloma formation25. Further, vitamin
D has been shown to strengthen the anti-mycobacterial activity of macrophages11,26, and upregulation of
components of the vitamin D pathway is linked to the production of anti-microbial peptides12, providing a
possible effector mechanism for mycobacterial control. Recent literature on immune regulation through T
cell-derived acetylcholine27,28 attributes relevance to the acetylcholine receptor pathway identified among
the HLA-DR pathways.

Although macrophages and lymphocytes are not generally viewed as having many similarities, we found
34 of the identified pathways to overlap between HLA-DR- and CD3-positive cells. In data derived from the
CD3 and PBMC populations, both of which represent lymphocytes, overlaps were identified for glycolysis,
glutamate receptor and angiotensin II pathways. Interestingly, a metabolic shift towards increased
glycolysis, representative of the Warburg effect, has been strongly associated with trained immunity23.

                                                  Page 6/24
However, the literature is dominated by the view that this event takes place in trained myeloid cells, while
we identified this circuit in CD3 cells (T lymphocytes) and not in the HLA-DR cells (mainly macrophages).
The glutamate receptor is widely expressed on immune cells and has been described as having an
important regulatory role in T cells, which can also produce and release glutamate29. The role for
angiotensin II pathway in TB remains elusive, while Angiotensin II Converting Enzyme 2 has been in the
spotlight due to fact that the SARS-CoV2 virus utilizes it as a receptor for entry into host cells30. In the
PBMC population, which over all showed a weaker epigenetic response, we found the interferon-γ
signaling pathway, which has a well-established role in anti-mycobacterial defense (reviewed in 31),
among the reprogramed pathways. Finally, several studies have ascribed Wnt pathways
immunomodulating functions and induction during M. tuberculosis infection (reviewed in 14) and M1 and
M2 macrophages express distinct patterns of Wnt ligands.
Taken together, we present data supportive of mycobacteria exposure-induced DNAm changes that
correlate with previous findings from studies on BCG vaccination including TB protection and trained
immunity.
Materials And Methods
Study design and ethics
Patients with pulmonary TB, healthy participants with a history of TB-exposure and healthy controls, with
an age ranging from 18 to 53 years, were enrolled at Linköping University Hospital and Linköping
University, respectively. Included subjects (Table 1) donated peripheral blood and induced sputum
samples8 following oral and written informed consent (ethical approval obtained from the Regional
Ethics Review Board (EPN) in Linköping, no. 2016/237-31). The study protocol included questionnaires
on respiratory and overall health, the evaluation of IGRA-status and sputum samples for DNA extraction.
The subjects’ samples and questionnaires were not linked to any personal information at any stage of the
study. The sputum sample collections were performed in accordance with guidelines from the
Department of Respiratory Medicine at Linköping University Hospital. The IGRA samples (QuantiFERON-
TB Gold) were collected and analyzed by medical personnel according to the guidelines at the
Department of Clinical Microbiology at Linköping University Hospital. For in vitro experiments, de-
identified buffy coats were purchased from the blood facility at Linköping University Hospital. The buffy
coats were obtained from healthy blood donors, who gave written consent of research use for the blood
products.
Induced sputum and pulmonary immune cell isolation
Induced sputum is a well-tolerated, non-invasive method to collect cells from the surface of the bronchial
airways after inhalation of a hypertonic saline solution. The procedure of sputum induction takes
approximately 30 minutes and is both cost effective and safe with minimal clinical risks32. Sputum
specimens were collected as described by Alexis et al33, with the following modifications: premedication
Page 7/24with an adrenergic β2-agonist, salbutamol (Ventoline, 1ml 1mg/ml) was administrated before the
inhalation of hypertonic saline, using a nebulizer (eFlow, PARI). The subsequent steps of sputum
processing were adopted from Alexis et al. (2005)34 and Sikkeland et al35. The HLA-DR and CD3-positive
cells were isolated using superparamagnetic beads coupled with anti-human CD3 and Pan Mouse IgG
antibodies and HLA-DR/human MHC class II antibodies (Invitrogen Dynabeads, ThermoFisher, cat no.
11041 and 14-9956-82, respectively). An initial positive selection was done with CD3 beads followed by a
positive HLA-DR selection. Bead-coating and cell isolation were performed according to manufacturer’s
protocol.
PBMC isolation
PBMCs were isolated from whole blood (TB-exposed and controls) or from leukocyte rich fractions of
blood obtained from healthy volunteers (Linköping University Hospital blood bank, Linköping). Isolation
was performed by the method of density gradient centrifugation using Lymphoprep (Axis-Shield) and
Sepmate-50 tubes (Stemcell Technologies) according to manufacturer’s protocol. IGRA status was
determined on the whole-blood samples using QuantiFERON-TB Gold (Cellestis) following the
manufacturer’s instructions.
Cell culture and in vitro BCG training
Following PBMC isolation cells were seeded in cell culture treated flasks in Dulbecco’s Modified Eagle’s
Medium (DMEM, Invitrogen) with 25 mM hepes, 100 U/ml penicillin and 100 µg/ml streptomycin (PEST,
Gibco). Cells were incubated in 37 °C for 2 h before the non-adherent lymphocytes were washed away
using warm Krebs-Ringer Glucose buffer (made in house). Complete DMEM supplemented with 10%
pooled human serum, 2mM L-glutamine, 100 U/ml penicillin and 100 µg/ml streptomycin (all from Gibco)
was then added to the cells along with immune training agents, or medium only as negative control for
24h. For the DNA methylation analysis and data presented in figure 7a-d we used 10 µg/ml of BCG
(freeze dried M. bovis bacillus Calmette-Guérin Danish Strain). Training agents were washed off and the
cells were incubated for 6-7 days in complete medium with media change every 2-3 days. The cells were
washed with PBS followed by trypsinization and reseeding of 5000 cells/ well in a 384-well plate (Corning
Falcon) for infection experiments. DNAm analysis DNA was isolated at day 6 after training with BCG.
DNAm sequencing and data analysis
DNA from PBMCs, HLA-DR-positive, CD3-positive cells, and the cultured human primary macrophages
was extracted using the AllPrep DNA/RNA Mini Kit (Qiagen, Hilden, Germany) according to the
manufacturer’s instructions. Genome-wide DNAm analysis was performed using the
HumanMethylation450K BeadChip (Illumina, USA) array (for the HLA-DR, CD3, PBMC samples) and
reduced representation bisulfite sequencing (Diagenode ́s RRBS) read in Illumina’s HiSeq 2000 (for the
cultured human primary macrophages) at the Bioinformatics and Expression Analysis (BEA) Core Facility
at Karolinska Institute, Stockholm. The methylation profiles from the HumanMethylation450K BeadChip
analysis for each cell type were analyzed from the raw IDAT files in R (v4.0.2) using the minfi (v1.36.0)
with subset-quantile within array (SWAN) normalization36, 37 and ChAMP (v2.19.3) with beta-mixture
Page 8/24quantile normalization (BMIQ) packages38, 39. The type I and type II probes were normalized using the quantile normalization method. Using the default setup of the ChAMP package, following probes were filtered out: i) probes below the detection p-value (>0.01), ii) non-CpG probes, iii) multi-hit probes, and iv) all probes of X and Y chromosomes. Cell type heterogeneity was corrected for the PBMC cell types using the Houseman algorithm40 and batch effects were fixed using ComBat from the SVA package (v3.38.0). Differential methylation analysis was performed with the linear modeling (lmFit) using the limma package41 (v3.46.0) in a contrast matrix of the TB-exposed and TB-non-exposed (Control) individuals. All Differentially methylated CpGs (DMCs) were considered significant at the Bonferroni-Hochberg (BH) corrected p-value < 0.05 (for HLA-DR cell types),
chromosomal distribution of the DMGs. The interactive plots were generated using the plotly (v4.9.3)
package.

The heatmaps were generated from the filtered DMGs with their respective CpGs for each cell type using
the ComplexHeatmap (v2.6.2) package52. The clustering dendrogram in heatmaps were plotted using the
Euclidean distance matrix.

Pathway and functional enrichment analyses
We used the PANTHER database (PantherDB v15, 16)53 to identify the enriched pathways related to our
identified DMGs. In addition, to assess functional enrichment, we used the ReactomePA (v1.34.0)
package54 with 1000 permutations and the BH-corrected p-values. Within the package, GO and Kyoto
Encyclopedia of Genes and Genomes (KEGG) were used and using clusterProfiler55 (v3.18.1), we
performed KEGG pathway56 enrichment analysis (data not shown). To enhance the visualization and
better understanding of the enrichment result, GOplot57 (v1.0.2), another package was used. The pathway
enrichment was also calculated using the topology-based ontology methods using RontoTools58
(v2.18.0), SPIA59 (v2.42.0) and pathview60 (v1.30.1) was used to visualize the related pathways with the
KEGG pathway maps (data not shown).

Venn and overlap analyses
Venn analyses were performed to detect the DMGs overlapping between cell populations and between
studies. We constructed the Venn diagrams by using matplotlib-venn package
(https://github.com/konstantint/matplotlib-venn) using in-house python script. The overlap analyses
were calculated and plotted using the go.Sunburst function from plotly using an in-house python script.

Statistical analyses
All differences with a p-value < 0.05 were considered significant if not otherwise stated. We calculated
family-wise error rate (FWER) using the BH correction method. All analyses were performed in R (v4.0.2)
with the mentioned packages.

Declarations
Data Availability

The datasets generated and analysed during the current study are not publicly available due to
Intellectual property rights but are available from the corresponding author on reasonable request.

Acknowledgements

This study was funded through generous grants from Forskningsrådet Sydöstra Sverige (FORSS-
932096), the Swedish Research Council (2015-02593 and 2018-02961) and the Swedish Heart Lung
Foundation (20150709 and 20180613). J.D is a postdoctoral fellow supported through the Medical

                                                Page 10/24
Infection and Inflammation Center (MIIC) at Linköping University. We direct our gratitude to the staff at
Linköping University Hospital and the Vrinnevi Hospital in Norrköping for assistance in sample collection
and all the subjects for donating samples. The DNA methylome data were generated at the
Bioinformatics and Expression Analysis Core Facility at the Department of Biosciences and Nutrition,
which is supported by the Board of Research at the Karolinska Institute, Stockholm. The computations
were enabled by resources provided by the Swedish National Infrastructure for Computing (SNIC) at
Linköping University campus partially funded by the Swedish Research Council through grant agreement
no. 2018-05973.
Author contributions
M.L., N.I. and J.P. designed the study, I.P., N.I., C.B., and L.K., performed the laboratory work and the related
analyses, J.D. and M.L. designed and performed the bioinformatic analyses of the data, J.D. and L.K
wrote the scripts for analysis and created figures. N.I., I.P., J.D., L.K., C.B., and M.L wrote the manuscript.
J.D and M.L are co-authors of a patent application “Biomarker for detection of mycobacterial infection
and exposure” filed on February 2nd with the Swedish Patent Registry (no. 100692).
Additional information
Competing interests
The authors declare no competing interests.
References
1. Fitchett, J. R., MacPherson, P. & Corbett, E. L. Implementing the end TB strategy and the intersection
with the sustainable development goals, 2016-2030. Transactions of the Royal Society of Tropical
Medicine and Hygiene (2015) doi:10.1093/trstmh/trw010.
2. Donald, P. R. et al. Droplets, dust and Guinea pigs: An historical review of tuberculosis transmission
research, 1878-1940. Int. J. Tuberc. Lung Dis. (2018) doi:10.5588/ijtld.18.0173.
3. Davis, J. M. & Ramakrishnan, L. The Role of the Granuloma in Expansion and Dissemination of Early
Tuberculous Infection. Cell (2009) doi:10.1016/j.cell.2008.11.014.
4. Verma, D. et al. Anti-mycobacterial activity correlates with altered DNA methylation pattern in
immune cells from BCG-vaccinated subjects. Sci. Rep. 7, (2017).
5. Hasso-Agopsowicz, M., Scriba, T. J., Hanekom, W. A., Dockrell, H. M. & Smith, S. G. Differential DNA
methylation of potassium channel KCa3.1 and immune signalling pathways is associated with
infant immune responses following BCG vaccination. Sci. Rep. (2018) doi:10.1038/s41598-018-
31537-9.
6. Kaufmann, E. et al. BCG Educates Hematopoietic Stem Cells to Generate Protective Innate Immunity
against Tuberculosis. Cell (2018) doi:10.1016/j.cell.2017.12.031.
Page 11/247. Jonsson, J. et al. A borderline range for Quantiferon Gold In-Tube results. PLoS One (2017)
doi:10.1371/journal.pone.0187313.
8. Sikkeland, L. I. B., Kongerud, J., Stangeland, A. M., Haug, T. & Alexis, N. E. Macrophage enrichment
from induced sputum [3]. Thorax (2007) doi:10.1136/thx.2006.073544.
9. Das, J., Verma, D., Gustafsson, M. & Lerm, M. Identification of DNA methylation patterns
predisposing for an efficient response to BCG vaccination in healthy BCG-naïve subjects. Epigenetics
(2019) doi:10.1080/15592294.2019.1603963.
10. Ogryzko, N. V. et al. Hif-1α–Induced Expression of Il-1β Protects against Mycobacterial Infection in
Zebrafish. J. Immunol. 202, (2019).
11. Eklund, D. et al. Vitamin D enhances IL-1β secretion and restricts growth of Mycobacterium
tuberculosis in macrophages from TB patients. Int. J. Mycobacteriology (2013)
doi:10.1016/j.ijmyco.2012.11.001.
12. Liu, P. T. et al. Toll-like receptor triggering of a vitamin D-mediated human antimicrobial response.
Science (80-.). 311, 1770–1773 (2006).
13. Hölscher, C. et al. Chemical p38 MAP kinase inhibition constrains tissue inflammation and improves
antibiotic activity in Mycobacterium tuberculosis-infected mice. Sci. Rep. (2020)
doi:10.1038/s41598-020-70184-x.
14. Brandenburg, J. & Reiling, N. The Wnt blows: On the functional role of Wnt signaling in
mycobacterium tuberculosis infection and beyond. Frontiers in Immunology (2016)
doi:10.3389/fimmu.2016.00635.
15. Castro, R. C. et al. NOTCH1 and DLL4 are involved in the human tuberculosis progression and
immune response activation. Tuberculosis (2020) doi:10.1016/j.tube.2020.101980.
16. Eklund, D. et al. Human gene variants linked to enhanced NLRP3 activity limit intramacrophage
growth of mycobacterium tuberculosis. in Journal of Infectious Diseases (2014).
doi:10.1093/infdis/jit572.
17. Raffetseder, J. et al. Replication rates of mycobacterium tuberculosis in human macrophages do not
correlate with mycobacterial antibiotic susceptibility. PLoS One (2014)
doi:10.1371/journal.pone.0112426.
18. Kaufmann, E. et al. BCG Educates Hematopoietic Stem Cells to Generate Protective Innate Immunity
against Tuberculosis. Cell 172, 176-190.e19 (2018).
19. Saeed, S. et al. Epigenetic programming of monocyte-to-macrophage differentiation and trained
innate immunity. Science (80-.). (2014) doi:10.1126/science.1251086.
20. Mourits, V. P. et al. BCG-Induced Trained Immunity in Healthy Individuals: The Effect of Plasma
Muramyl Dipeptide Concentrations. J. Immunol. Res. (2020) doi:10.1155/2020/5812743.
21. Kleinnijenhuis, J. et al. Bacille Calmette-Guérin induces NOD2-dependent nonspecific protection from
reinfection via epigenetic reprogramming of monocytes. Proc. Natl. Acad. Sci. U. S. A. (2012)
doi:10.1073/pnas.1202870109.
Page 12/2422. Russell, D. G., Cardona, P. J., Kim, M. J., Allain, S. & Altare, F. Foamy macrophages and the
progression of the human tuberculosis granuloma. Nature Immunology (2009) doi:10.1038/ni.1781.
23. Benn, C. S., Fisker, A. B., Whittle, H. C. & Aaby, P. Revaccination with Live Attenuated Vaccines Confer
Additional Beneficial Nonspecific Effects on Overall Survival: A Review. EBioMedicine (2016)
doi:10.1016/j.ebiom.2016.07.016.
24. Thysen, S. M. et al. Neonatal BCG vaccination and child survival in TB-exposed and TB-unexposed
children: A prospective cohort study. BMJ Open (2020) doi:10.1136/bmjopen-2019-035595.
25. Verrall, A. J. et al. Early Clearance of Mycobacterium tuberculosis: The INFECT Case Contact Cohort
Study in Indonesia. J. Infect. Dis. (2019) doi:10.1093/infdis/jiz168.
26. Arts, R. J. W., Joosten, L. A. B. & Netea, M. G. Immunometabolic circuits in trained immunity.
Seminars in Immunology (2016) doi:10.1016/j.smim.2016.09.002.
27. Kumar, R. et al. Immunometabolism of Phagocytes During Mycobacterium tuberculosis Infection.
Frontiers in Molecular Biosciences (2019) doi:10.3389/fmolb.2019.00105.
28. Kleinnijenhuis, J. et al. Bacille Calmette-Guerin induces NOD2-dependent nonspecific protection from
reinfection via epigenetic reprogramming of monocytes. Proc. Natl. Acad. Sci. 109, 17537–17542
(2012).
29. Harding, J. S. et al. VEGF-A from Granuloma Macrophages Regulates Granulomatous Inflammation
by a Non-angiogenic Pathway during Mycobacterial Infection. Cell Rep. (2019)
doi:10.1016/j.celrep.2019.04.072.
30. Rao Muvva, J., Parasa, V. R., Lerm, M., Svensson, M. & Brighenti, S. Polarization of Human Monocyte-
Derived Cells With Vitamin D Promotes Control of Mycobacterium tuberculosis Infection. Front.
Immunol. (2020) doi:10.3389/fimmu.2019.03157.
31. Cox, M. A. et al. Beyond neurotransmission: acetylcholine in immunity and inflammation. Journal of
Internal Medicine (2020) doi:10.1111/joim.13006.
32. Cox, M. A. et al. Choline acetyltransferase–expressing T cells are required to control chronic viral
infection. Science (80-.). (2019) doi:10.1126/science.aau9072.
33. Ganor, Y. & Levite, M. The neurotransmitter glutamate and human T cells: Glutamate receptors and
glutamate-induced direct and potent effects on normal human T cells, cancerous human leukemia
and lymphoma T cells, and autoimmune human T cells. J. Neural Transm. (2014)
doi:10.1007/s00702-014-1167-5.
34. Ganor, Y. & Levite, M. The neurotransmitter glutamate and human T cells: Glutamate receptors and
glutamate-induced direct and potent effects on normal human T cells, cancerous human leukemia
and lymphoma T cells, and autoimmune human T cells. J. Neural Transm. 121, 983–1006 (2014).
35. Kuhn, J. H., Li, W., Radoshitzky, S. R., Choe, H. & Farzan, M. Severe acute respiratory syndrome
coronavirus entry as a target of antiviral therapies. Antiviral Therapy (2007).
36. Lake, M. A., Ambrose, L. R., Lipman, M. C. I. & Lowe, D. M. ’ ‘Why me, why now?’ Using clinical
immunology and epidemiology to explain who gets nontuberculous mycobacterial infection. BMC
Med. (2016) doi:10.1186/s12916-016-0606-6.
Page 13/2437. Das, J., Idh, N., Sikkeland, L. I. B., Paues, J. & Lerm, M. DNA methylome-based validation of induced
sputum as an effective protocol to study lung immunity: construction of a classifier of pulmonary
cell types. bioRxiv (2021) doi:10.1101/2021.03.12.435086.
38. Ugarte-Gil, C., Elkington, P. T., Gotuzzo, E., Friedland, J. S. & Moore, D. A. J. Induced sputum is safe
and well-tolerated for TB diagnosis in a resource-poor primary healthcare setting. American Journal
of Tropical Medicine and Hygiene (2015) doi:10.4269/ajtmh.14-0583.
39. Alexis, N., Soukup, J., Ghio, A. & Becker, S. Sputum phagocytes from healthy individuals are
functional and activated: A flow cytometric comparison with cells in bronchoalveolar lavage and
peripheral blood. Clin. Immunol. (2000) doi:10.1006/clim.2000.4911.
40. Alexis, N. E. et al. In vivo particle uptake by airway macrophages in healthy volunteers. Am. J. Respir.
Cell Mol. Biol. (2006) doi:10.1165/rcmb.2005-0373OC.
41. Rueden, C. T. et al. ImageJ2: ImageJ for the next generation of scientific image data. BMC
Bioinformatics (2017) doi:10.1186/s12859-017-1934-z.
42. Schindelin, J. et al. Fiji: An open-source platform for biological-image analysis. Nature Methods
(2012) doi:10.1038/nmeth.2019.
43. Maksimovic, J., Gordon, L. & Oshlack, A. SWAN: Subset-quantile within array normalization for
illumina infinium HumanMethylation450 BeadChips. Genome Biol. (2012) doi:10.1186/gb-2012-13-
6-r44.
44. Aryee, M. J. et al. Minfi: A flexible and comprehensive Bioconductor package for the analysis of
Infinium DNA methylation microarrays. Bioinformatics (2014) doi:10.1093/bioinformatics/btu049.
45. Teschendorff, A. E. et al. A beta-mixture quantile normalization method for correcting probe design
bias in Illumina Infinium 450 k DNA methylation data. Bioinformatics (2013)
doi:10.1093/bioinformatics/bts680.
46. Morris, T. J. et al. ChAMP: 450k Chip Analysis Methylation Pipeline. Bioinformatics 30, 428–430
(2014).
47. Houseman, E. A., Molitor, J. & Marsit, C. J. Reference-free cell mixture adjustments in analysis of DNA
methylation data. Bioinformatics (2014) doi:10.1093/bioinformatics/btu029.
48. Ritchie, M. et al. limma powers differential expression analyses for RNA-sequencing and microarray
studies | Nucleic Acids Research | Oxford Academic. limma powers Differ. Expr. Anal. RNA-
sequencing microarray Stud. (2015).
49. Andrews S. FastQC A Quality control tool for high throughput sequence data. Babraham Bioinfo
(2018).
50. Langmead, B. & Salzberg, S. L. Fast gapped-read alignment with Bowtie 2. Nat. Methods (2012)
doi:10.1038/nmeth.1923.
51. Krueger, F. & Andrews, S. R. Bismark: A flexible aligner and methylation caller for Bisulfite-Seq
applications. Bioinformatics (2011) doi:10.1093/bioinformatics/btr167.
Page 14/2452. Li, H. et al. The Sequence Alignment/Map format and SAMtools. Bioinformatics (2009)
doi:10.1093/bioinformatics/btp352.
53. Gaspar, J. M. & Hart, R. P. DMRfinder: Efficiently identifying differentially methylated regions from
MethylC-seq data. BMC Bioinformatics (2017) doi:10.1186/s12859-017-1909-0.
54. Akalin, A. et al. MethylKit: a comprehensive R package for the analysis of genome-wide DNA
methylation profiles. Genome Biol. (2012) doi:10.1186/gb-2012-13-10-R87.
55. Galili, T. dendextend: An R package for visualizing, adjusting and comparing trees of hierarchical
clustering. Bioinformatics (2015) doi:10.1093/bioinformatics/btv428.
56. Paradis, E. & Schliep, K. Ape 5.0: An environment for modern phylogenetics and evolutionary
analyses in R. Bioinformatics (2019) doi:10.1093/bioinformatics/bty633.
57. Blighe, K, S Rana, and M. L. EnhancedVolcano: Publication-ready volcano plots with enhanced
colouring and labeling. (2018).
58. Anand, L. & Rodriguez Lopez, C. M. ChromoMap: An R package for Interactive Visualization and
Annotation of Chromosomes. bioRxiv (2019) doi:10.1101/605600.
59. Gu, Z., Eils, R. & Schlesner, M. Complex heatmaps reveal patterns and correlations in
multidimensional genomic data. Bioinformatics (2016) doi:10.1093/bioinformatics/btw313.
60. Thomas, P. D. et al. PANTHER: A library of protein families and subfamilies indexed by function.
Genome Res. 13, 2129–2141 (2003).
61. Yu, G. & He, Q. Y. ReactomePA: An R/Bioconductor package for reactome pathway analysis and
visualization. Mol. Biosyst. (2016) doi:10.1039/c5mb00663e.
62. Yu, G., Wang, L. G., Han, Y. & He, Q. Y. ClusterProfiler: An R package for comparing biological themes
among gene clusters. Omi. A J. Integr. Biol. (2012) doi:10.1089/omi.2011.0118.
63. Kanehisa, M. KEGG: Kyoto Encyclopedia of Genes and Genomes. Nucleic Acids Res. (2000)
doi:10.1093/nar/28.1.27.
64. Walter, W., Sánchez-Cabo, F. & Ricote, M. GOplot: An R package for visually combining expression
data with functional analysis. Bioinformatics (2015) doi:10.1093/bioinformatics/btv300.
65. Luo, W., Friedman, M. S., Shedden, K., Hankenson, K. D. & Woolf, P. J. GAGE: Generally applicable
gene set enrichment for pathway analysis. BMC Bioinformatics (2009) doi:10.1186/1471-2105-10-
161.
66. Voichita, C., Ansari, S. & Draghici, S. ROntoTools: The R Onto-Tools suite.
https://bioconductor.riken.jp/packages/3.10/bioc/vignettes/ROntoTools/inst/doc/rontotools.pdf
(2019).
67. Tarca, A. L. et al. A novel signaling pathway impact analysis. Bioinformatics (2009)
doi:10.1093/bioinformatics/btn577.
68. Luo, W. & Brouwer, C. Pathview: an R/Bioconductor package for pathway-based data integration and
visualization. Bioinformatics 29, 1830–1831 (2013).
Page 15/24Tables
Table 1. Demographic data of the participants in the first and second recruitment.
† The standard deviation of the mean values is added to the age, height, weight and BMI.
* Borderline-positive.
Characteristics TB-exposed (n = Controls (n = TB-exposed (n = 3)
4) 6)
Mean age (year)† 36±12 27±6 30.7±15.8
Mean height (cm)† 173±4 176±7 171±2.5
Mean weight (kg)† 69±8 77±16 72±14
Mean Body Mass Index (BMI)† 23±3 24±5 24.6±4.2
Sex (male/female) 1/3 4/2 2/1
Smoking (current/previous/never) 0/1/3 0/0/6 2/1/0
BCG (yes/no) 3/1 6/0 2/1
IGRA-positive/IGRA-negative 2/2 1*/5 ND
TB patient/contact 1/3 0/0 1/2
Figures
Page 16/24Figure 1
Schematic overview of the project workflow. Sputum and blood were isolated from TB-exposed
individuals and controls and the DNA methylomes were analyzed for the different cell types.
Macrophages were isolated from healthy blood donors and exposed to the Bacillus Calmette–Guérin
(BCG) vaccine in vitro. The BCG-exposed macrophages were subjected to DNA methylome analysis. TB,
tuberculosis; DNAm, DNA-methylation; BCG, Bacillus Calmette-Guérin.
Page 17/24Figure 2 DNA methylome analyses of immune cells from TB-exposed individuals. Dendrograms of the unsupervised hierarchical clustering of the DNAm b-values of from a. HLA-DR, b. CD3 and c. PBMCs. “Con”: green=controls, “Exp”: purple=TB-exposed, red=TB index case. The scale defines the clustering Euclidean distance. PBMCs, peripheral blood mononuclear cells. DNA methylome analyses of immune cells from TB-exposed individuals. Volcano plots of DMGs from d. HLA-DR, e. CD3 and f. PBMCs. Red dots represent DMGs above cut-offs (±0.3 Log2 fold change and BH- corrected p-value < 0.05,
Figure 3

PANTHER pathway analysis of the identified DMGs with the cut-offs for the different cell populations
given in Figure 2. Dot plots show the gene ratio, gene counts and FDR-corrected p-value for a. HLA-DR
(top 20 pathways), b. CD3 (total 17 pathways). c. PBMC (top 20 pathways).

                                                Page 19/24
Figure 4
Venn analyses comparing DMGs, pathways and GO terms between different datasets. a. Overlapping
DMGs derived from the HLA-DR (orange), CD3 (green) and PBMC (red) DNA methylomes. b. Overlapping
DMGs from this study and from our previous work on BCG induced DMGs (light green).
Page 20/24Figure 5
Pathway overlap with other studies’ results. a. Venn diagram describing the number of Panther pathways
overlapping between the ones derived from the 185 common DMGs in this study (dark green) and Hasso-
Agopsowicz et al. (human BCG vaccine study, light green) a. Sunburst Plot describing the overlap of
enriched GO biological processes emerging from a comparison between the GO data derived from the
185 common DMGs (Figure 4a) and Kaufmann et al (BCG study performed in mouse PBMCs). c.
Page 21/24Sunburst Plot describing the overlap of enriched GO biological processes emerging from a comparison
between the GO data derived from the 185 common DMGs and Saeed et al (study on trained immunity
induced by b-glucan).
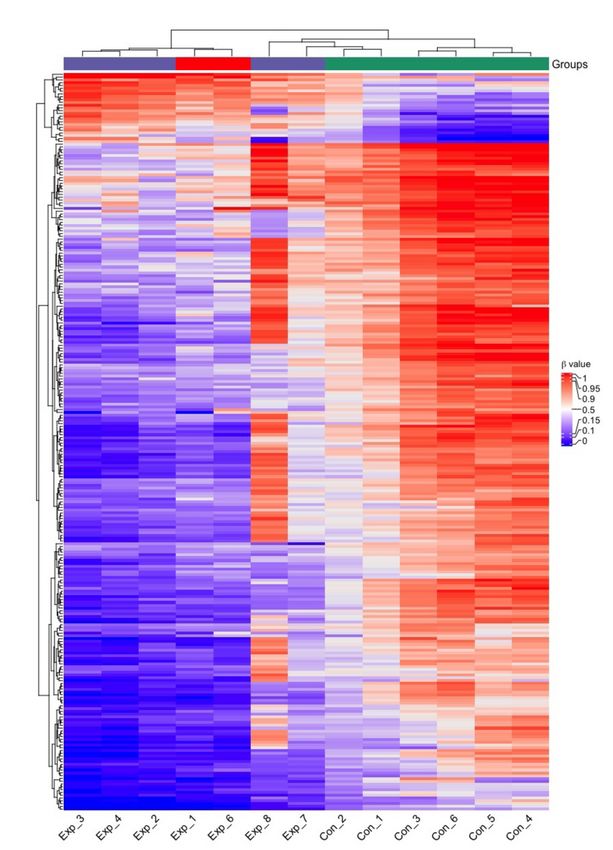
Figure 6
Page 22/24Heatmap of the HLA-DR-derived β values of the signature’s 284 CpG sites of the 6 initial subjects (Exp_1-4
and Con_1-6) and the three additional exposed subjects (Exp_6-8). Purple=exposed, red=TB index case,
green=controls.
Figure 7
Page 23/24Macrophages were BCG-trained (purple) or left untreated (orange) before infection with M. tuberculosis
(H37rv-GFP) or DNAm analysis. a-b. Total bacterial area (µm²/image) measured by green fluorescence
over time. c-d. Cumulative cell death measured by the red fluorescent DRAQ7 DNA stain marking the
nuclei of non-viable cells. a-d shows data from one donor separately with the median of two replicates
per timepoint.e. PANTHER pathway analysis of the identified DMGs from DNA methylation analysis in the
human primary macrophages exposed to BCG compared to controls. Dot plots show the gene ratio, gene
counts and FDR-corrected p-value for 3 significantly over-represented pathways.
Supplementary Files
This is a list of supplementary files associated with this preprint. Click to download.
SupplementaryInformation.docx
Page 24/24You can also read