District of Sooke Economic Analysis - Urbanics Consultants Ltd. Prepared by Urbanics Consultants Ltd.
←
→
Page content transcription
If your browser does not render page correctly, please read the page content below
District of Sooke Economic Analysis

                        District of Sooke
                   Economic Analysis

                             Prepared by Urbanics Consultants Ltd.
                     Suite 1207- 409 Granville St Vancouver, BC, V6C 1T2

                               Urbanics Consultants Ltd.
                                              i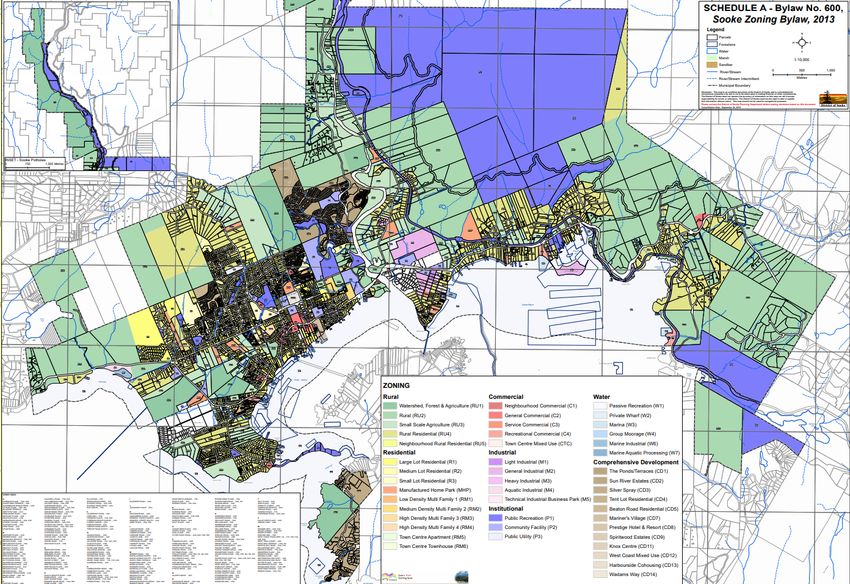
District of Sooke Economic Analysis

                                       District of Sooke
                                      ECONOMIC Analysis

                                      District of Sooke, British Columbia

                                                Prepared for:
                                               District of Sooke

                                               December 2019

We acknowledge that the District of Sooke is located on the unceded traditional territory
                               of the T'Sou-ke Nation.

                                                Prepared by:
                                          Urbanics Consultants Ltd.
                                      Suite 1207 – 409 Granville Street,
                                           Vancouver BC, V6C 1T2

                                                      ii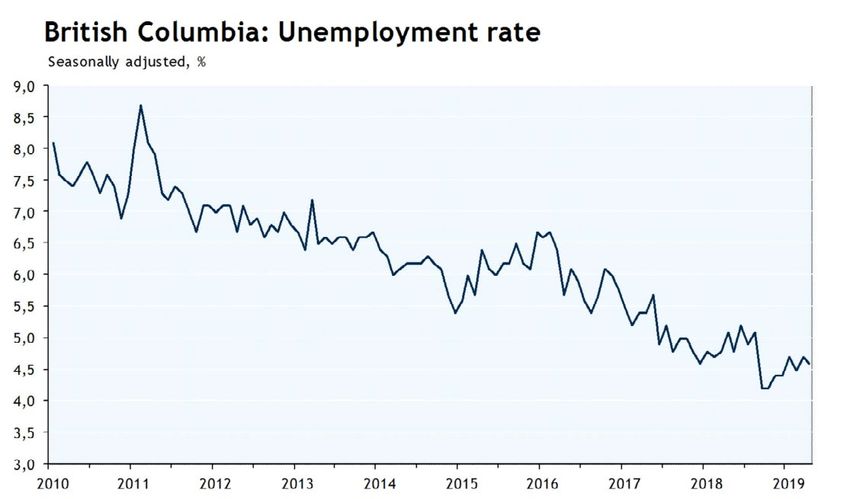
District of Sooke Economic Analysis
Executive Summary
Urbanics Consultants Ltd. was commissioned by the District of Sooke to carry out an economic
analysis, that will provide a solid background on economic development trends, especially as it
relates to housing policy.
With regards to demographic and macroeconomic trends, the Consultant has the following
findings:
Provincial economy in BC remains strong and will likely continue outperforming the
Canadian average.
Southern tip of Vancouver Island remains an attractive place to live and work due to
affordability and quality of life considerations.
Population growth rates in neighboring markets (30-40 minutes drive) of Langford,
Colwood and Saanich is some of the highest in Canada.
Low education levels hold back the viability of attracting high pay high value add
companies.
Most workers (71%) commute out of town for employment opportunities.
Median incomes are comparable to BC and CRD.
With regards to the employment lands inventory and commercial market dynamics, the
Consultant has the following findings:
Plentiful pre-zoned employment lands exist in Sooke.
Significant public land reserves also exist.
Significant portion of industrial and commercial lands are underdeveloped, and
underutilized.
Commercial rents are quite high for such a small community with small population and
commercial services base.
Vacancies are low.
Property taxes are competitive.
Regulatory environment is conducive to business development.
DCC rates are higher than and uncompetitive with neighboring jurisdictions.
With regards to forecast of employment lands (both industrial and commercial retail/office)
required by 2036, the Consultant has the following findings:
Low scenario projects approximately 8 hectares of new employment lands required by
2036.
Median scenario projects approximately 13 hectares of new employment lands required
by 2036.
High scenario projects approximately 23.5 hectares of new employment lands required by
2036.
iii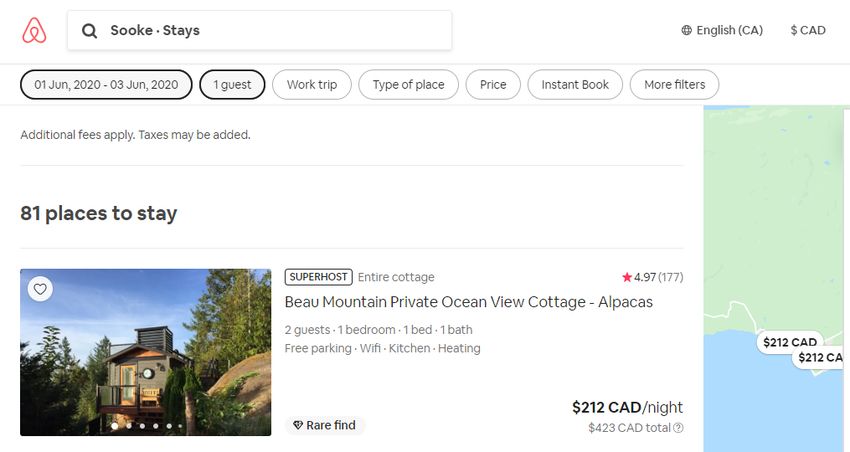
District of Sooke Economic Analysis
In conclusion, the Consultant finds that:
The demand for industrial land use out to 2036 ranges between as little as 4 hectares
(low industrial employment capture, and high industrial job density) to as much as 13.4
hectares (representing high employment capture and low industrial job density). The
median estimate is approximately 7 hectares.
The demand for commercial land use out to 2036 ranges between as little as 4
hectares (low commercial employment capture, and high commercial job density) to
as much as 10.1 hectares (representing high commercial employment capture and low
commercial job density). The median estimate is approximately 6 hectares.
There is 32 hectares of M2 zoned land that is under utilized. In total there is
approximately 41 hectares of under-utilized industrial land with 12.39 hectares of
vacant industrial land.
There is 8.8 hectares of C2 zoned land that is under utilized, as well as 8.67 hectares
of C4 “Commercial Recreation” underutilized. In total there is approximately 22
hectares of under-utilized commercial land as well as 7.2 hectares of vacant
commercial land.
There is no projected shortage of industrial or commercial land as the industrial and
commercial land inventory indicates that there is more vacant employment land than
total warranted demand by 2036 under a “median scenario” projection. In addition,
there are significant employment land parcels that are host to limited levels of activity
and are considered “under-utilized”. These parcels can be subject to intensification in
the coming years as market conditions warrant it. That said, the Consultant estimates
that the supply of vacant employment lands will be completely exhausted by 2036.
Growth industries will be healthcare, warehousing and wholesale trade, filming,
tourism and recreation.
Short-term rentals comprise approximately 3-5% of rental housing stock, or 1-2% of
total housing stock. It is most likely that they contribute in a small way to increasing
rents and prices.
Recommendations as to the next steps to be pursued by the District of Sooke can be found on
the last few pages in chapter 7. An appendix relating to the development analysis on Lot A is
also included at the end of this report.
iv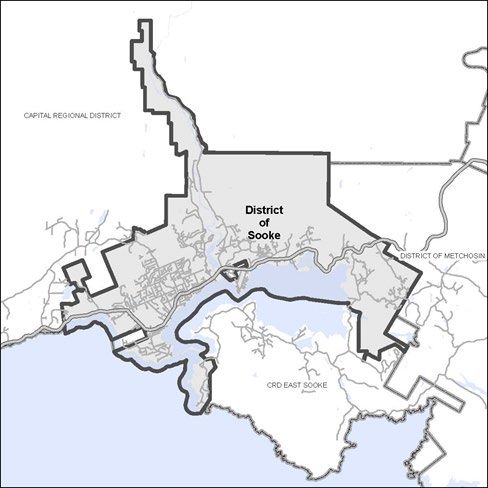
District of Sooke Economic Analysis

Table of Contents
Executive Summary .................................................................................................................iii

List of Figures ..........................................................................................................................vi

List of Tables ............................................................................................................................vi

1.    Introduction ....................................................................................................................... 1
               Objectives.................................................................................................................. 1
               Structure .................................................................................................................... 1
               Limitations ................................................................................................................. 3

2.    Economic Base Analysis .................................................................................................. 4
               Provincial Economy ................................................................................................... 4
               Location ..................................................................................................................... 5
               Demographics ........................................................................................................... 7
               Conclusions ..............................................................................................................12
3.    Employment Land Inventory ...........................................................................................13
               Employment Land Supply .........................................................................................13
               Market characteristics ...............................................................................................19
               Conclusions ..............................................................................................................22
4.    Employment and Industry Profile ...................................................................................23
               Biggest employers ....................................................................................................23
               NAICS Comparisons.................................................................................................23
               Employment Trends..................................................................................................25
               Employment Projections ...........................................................................................26
               Conclusions ..............................................................................................................32

5.    Stakeholder Phone Interviews ........................................................................................34

6.    SWOT Analysis ................................................................................................................36

7.    Conclusion .......................................................................................................................39
               Short-Term Rentals ..................................................................................................39
               Findings and Recommendations...............................................................................42
Appendix 1: Housing Development Analysis........................................................................45
      A.1.1 Development issues..................................................................................................45
      A.1.2 Lot A (6671 Wadams Way) .......................................................................................46

                                                                      v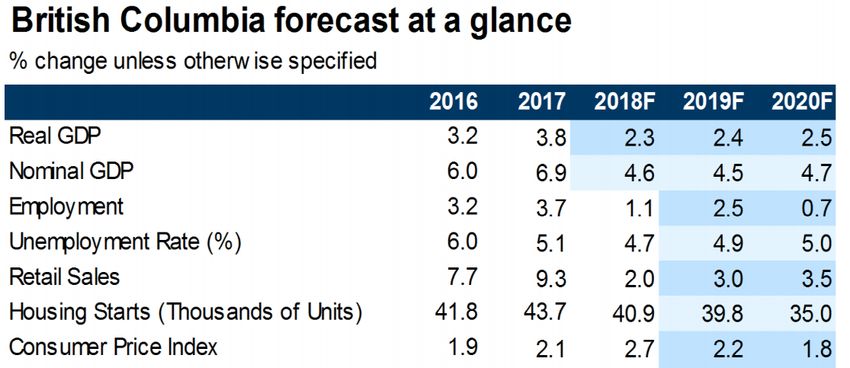
District of Sooke Economic Analysis

List of Figures
Figure 1: British Columbia Unemployment Rate (%) .................................................................. 4
Figure 2 District of Sooke Boundaries Map ................................................................................ 6
Figure 3: Sooke Population Trends 2001-2016 .......................................................................... 7
Figure 4: Income Cohort Distribution .........................................................................................10
Figure 5: Zoning Map of Sooke .................................................................................................14
Figure 6: M2 Industrial zoning definition ....................................................................................16
Figure 7: C2 Zoning definition ...................................................................................................17
Figure 8: P1 Zoning definition ...................................................................................................18
Figure 9: Airbnb Listings in Sooke .............................................................................................40
Figure 10: June 2019 Sooke Airbnb listings ..............................................................................41

List of Tables
Table 1: BC Economic Indicators and Forecast.......................................................................... 5
Table 2: Employment by major sectors, 2006 – 2016 ................................................................. 6
Table 3: Sooke Population Composition by Age Cohort ............................................................. 8
Table 4: Commuting Status of Sooke Residents ........................................................................ 9
Table 5: Household Income Comparisons.................................................................................. 9
Table 6: Median Household Income Comparison ......................................................................10
Table 7: Highest certificate, diploma or degree for the population aged 25 to 64 years in private
households ...............................................................................................................................11
Table 8: Projected Population Growth .......................................................................................12
Table 9: Employment Land Base Inventory ...............................................................................15
Table 10: Industrial Land Supply ...............................................................................................16
Table 11: Commercial Land Supply ..........................................................................................17
Table 12: Public Land Inventory ................................................................................................19
Table 13: 2019 Property Tax Mill Rates ....................................................................................20
Table 14: Comparison of Commercial Property DCC rates .......................................................21
Table 15: Comparison of Industrial Property DCC rates ............................................................21
Table 16: NAICS comparison ....................................................................................................25
Table 17: Constant Share Employment Projections ..................................................................27
Table 18: Constant Share Net Job Gains - 2036 .......................................................................28
Table 19: Shift Share Employment Percentages .......................................................................29
Table 20: Shift Share Employment Projections .........................................................................30
Table 21: Shift Share Net Job Gains - 2036 ..............................................................................31
Table 22: Job Capture Scenarios ..............................................................................................32
Table 23: Industrial Employment Land Needs Conversion ........................................................33
Table 24: Commercial Employment Land Needs Conversion....................................................33

                                                                    vi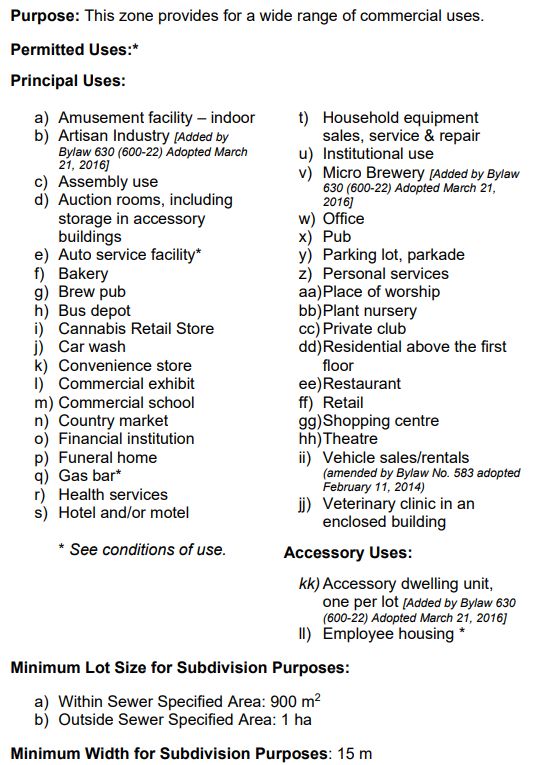
District of Sooke Economic Analysis

1. Introduction
Urbanics Consultants Ltd. has been retained by the District of Sooke to carry out an economic
analysis, with special consideration made on the viability and impacts of short-term rental
accommodations on the broader economic vitality of the Sooke District and the prospects for job
creation and affordable housing provision.

The District of Sooke has witnessed high growth in population over the last decade. This growth
has been accompanied by a variety of housing issues in the community, which we have recently
addressed in our housing report from October 2019. Economic development has generally lagged
population growth as Sooke’s new residents are primarily drawn from an older demographic with
limited consumer expenditure potential and lower labour force participation.

                 Objectives
The main objectives of the study are to:

    •   Review existing studies and research related to economic policies pursued by the District
        of Sooke;
    •   Analyze population, socio-economic, and employment trends to develop a comprehensive
        demographic and socio-economic profile of the community;
    •   Compare and Contrast the employment and industry profiles of Sooke with neighboring
        regions, and the Province of BC;
    •   Develop an inventory of employment lands in the District and identify its market
        characteristics;
    •   Produce forecast for future employment trends and identify key growth sectors;
    •   Provide recommendations to help encourage the development of high pay industries that
        can provide the means for which residents can afford to live and work in the District.

The final recommendations will provide targets on the need for additional employment lands by
type and tenure over the next 20 years.

                 Structure
In terms of report structure, the following serves as a brief description:

                 Introduction
The introduction provides the overall objectives of the study, the approach, and the report
structure and the limitations of the study.

                 Economic Base Analysis
This chapter will provide information about demographic, socioeconomic, and geostrategic factors
that impact the employment and industry profile of the District of Sooke. An examination of

                                                  1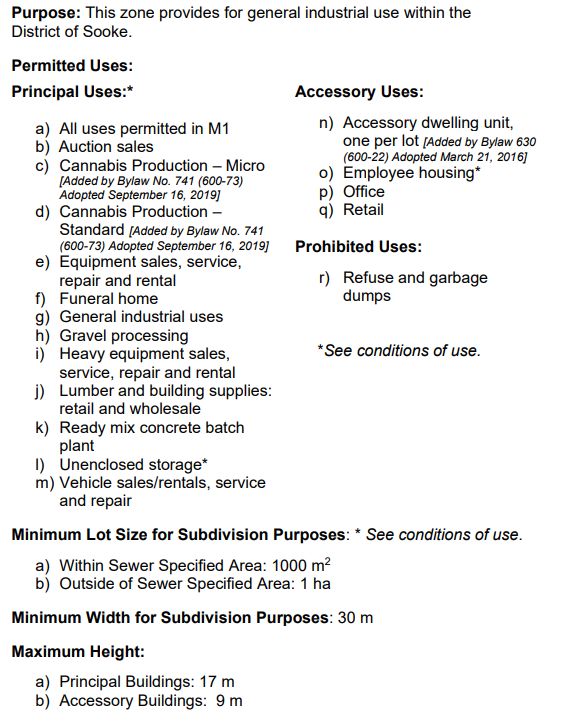
District of Sooke Economic Analysis

historical employment and income growth trends associated with the District will also be
conducted. The Consultant will identify key growth industries and make general observations
related to the type of commercial/ industrial space that might be required over the next 20 years.

                 Employment land inventory
This chapter will focus on identifying baseline business, employment and industrial activity and
provide commentary as to the supply of employment lands available in the District. Market
characteristics such as rents, taxes, land costs, vacancy will be compared with neighboring
jurisdictions. The Consultant will summarize opportunities and challenges for growth. Strategies
for intensification of uses on employment lands near public transit facilities will be explored, and
changes to make the District more business friendly will be identified.

                 Employment and Industry Profile
This chapter will identify biggest employers, employment trends, as well as provide a major
employment sector comparison. Special consideration will be made to NAICS 1 employment
category composition and industry profile in the District as it relates to neighboring markets. The
Consultant will also use the constant-share method and the shift-share method. These methods
rely on provincial and or regional level employment projections to estimate future employment
growth in a municipality or sub-region. Reconciliation of these methods will provide the most likely
employment growth projection for the District. Based on the above employment growth projection,
the Consultant will identify key growth industries and make general observations related to the
type of commercial/ industrial space that might be required over the next 20 years.

                 Stakeholder Phone Interviews
This chapter will summarize inputs received by a variety of stakeholder interviews.

                 SWOT Analysis
Based on preliminary research and the stakeholder engagement methods the Consultant will
identify the strengths, weaknesses, opportunities, and threats related to the economic
environment of the District of Sooke.

                 Findings and Recommendations
The Consultant will provide an assessment of the projected employment land use and retail lands
demand in relation to the current employment land supply. The projections will be used to examine
the adequacy of the current capacity of the employment lands to accommodate the future
demands. The Consultant will also examine specialty types of employment use which may be
well-positioned for growth and examine the policy framework impacting them.

1
 The North American Industry Classification System (NAICS) is used by the United States, Canada, and
Mexico to classify businesses by industry. Each business is classified into a six-digit NAICS code number
based on the majority of activity at the business.

                                                   2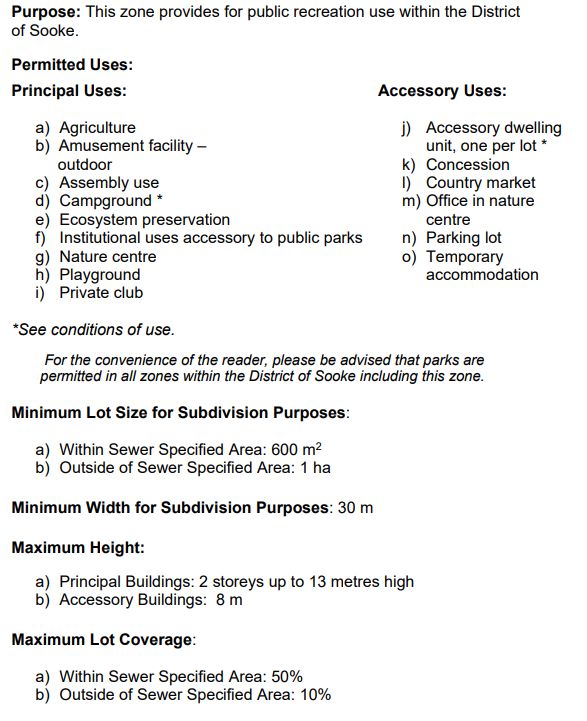
District of Sooke Economic Analysis

The Consultant will examine results of the above assessment against existing District policies,
and make recommendations with regards to appropriate strategies, land use regulations, and
public policy approaches to managing and enhancing the supply of employment lands in the
District.

                 Limitations
Background data for this study was obtained from a variety of public (federal, provincial, regional,
and municipal) and private sector sources as well as from field work conducted by the Consultant
during the period June to November 2019.

Similar to other studies of this nature, a number of forecasts and assumptions regarding the state
of the economy, the state of future competitive influences, and population projections have had
to be made. These assumptions are made with great care and are based on the most recent and
reliable information available. Should any assumptions noted in this study be undermined by the
course of future events, we recommend that the study’s findings be re-examined.

While specific assumptions may be noted throughout the report, the following general
assumptions also apply:
   • Real GDP growth and other national and local economic indicators for the area will not
      significantly differ from the projections indicated in the study over the course of the study
      period.
   • No unforeseen economic or political events will occur within the study period on a national,
      provincial, or local level, which would significantly alter the outcomes of the study’s
      analyses. Short-term fluctuations are likely to occur, but long-term gradual growth rates
      should prevail.
   • Actual population growth rates will be relatively consistent with the historical growth rates
      in the region.
   • The demand and market analyses are based on estimates, assumptions and other
      information developed from the Consultants experience, research of the various markets
      and background knowledge.
   • Due to the small population base and commercial facilities in Sooke, there is a thin market
      to analyze as it relates to statistical information relating to vacancies, commercial rents
      and business permits.

                                                 3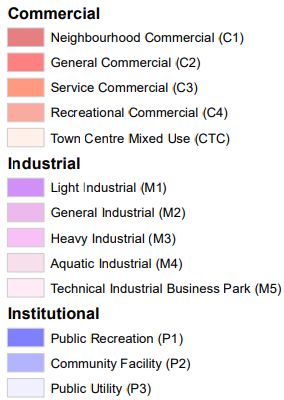
District of Sooke Economic Analysis

2. Economic Base Analysis
The economic base analysis focuses on the strength and characteristics of the provincial
economy as it relates to the local context. Geographic advantages of the District will be weighed
against disadvantages in the context of attracting businesses and increasing investment and jobs.
A review of the demographic conditions in the District will also be included.

                 Provincial Economy 2
After leading all provinces in growth in 2016 and 2017, the BC economy slowed its pace over the
past year to a still-robust rate of 2.3% (third-fastest rate among the provinces). The policy-induced
housing correction contributed strongly to this slowing, which had ripple effects across several
housing-sensitive industries, particularly in the services and manufacturing sectors. The labour
market continued to be very strong. Job creation was healthy, and the unemployment rate stood
as the lowest among the provinces at 4.7%. In the context of Canada and BC, this means that
the economy is at “full employment” and upward wage pressure should be evident.

Figure 1: British Columbia Unemployment Rate (%)

Source: Statistics Canada, RBC Economic Research Provincial Forecast June 2019.

Declining sales of building materials, furniture, and motor vehicles are clear signs that the housing
downturn is weighing on BC consumers who have become more cautious. This is in stark contrast
to their exuberant confidence in the recent past when rapidly rising housing wealth fueled a four-

2
 BRITISH COLUMBIA – As housing slumps, business investment takes over, RBC Provincial Outlook,
June 2019

                                                      4
District of Sooke Economic Analysis
year long retail sales boom in the province. Retail sales growth has declined from 9.3% in 2017
to only 2% in 2018.
Table 1: BC Economic Indicators and Forecast
Source: Statistics Canada, RBC Economic Research Provincial Forecast June 2019.
Despite a soft housing market and more cautious consumers, BC’s economy remains strong. A
surge in spending on major capital projects will likely pick up the slack. Businesses plan to boost
their capital expenditures by nearly $4 billion (up 13%) this year—the biggest increase ever in
dollar terms. The ramping-up of construction of the $40-billion LNG Canada megaproject in
Kitimat will generate a groundswell of activity in the province. Commercial real estate is also on
an upswing—driving non-residential investment 21% above 2018 levels in the first quarter of
2019. Activity in the non-residential construction will keep overall economic growth near the 2.5%
mark in 2019 and 2020— strong enough to uphold BC’s top-tier provincial growth ranking.
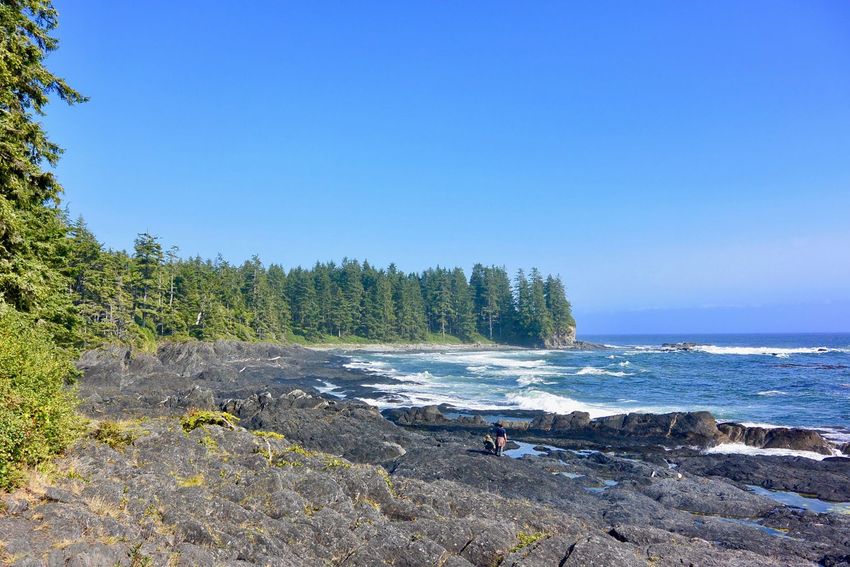
Location
The District of Sooke is located in British Columbia, Canada, on the southern tip of Vancouver
Island. Sooke rests along the coast, overlooking Salish Sea and Sooke Basin, and flanks the
banks of the Sooke River. Sooke overlooks the Juan de Fuca Strait and Olympic Mountain range
and encompasses approximately 5800 hectares of land. The District of Sooke is located within
the Capital Regional District (CRD), approximately 45 kilometres from Greater Victoria along
scenic Highway 14, also known as the Pacific Marine Circle Route, and is 20 kilometres west of
the City of Langford.
The District has an excellent reputation as a place with a high-quality of life, and its proximity to a
scenic coast and riverfront ensures small-town charm. Sooke is a popular tourist destination for
outdoor enthusiasts and others that appreciate spectacular natural beauty.
5District of Sooke Economic Analysis
Figure 2 District of Sooke Boundaries Map
Source: District of Sooke
Forestry and commercial fishing markets were historically the backbone of the local economy, but
both markets have lost prominence in the region in the past several decades. In recent times,
most of the major economic sectors of the local economy have remained relatively stable as a
percentage of the total labour force. Public services, manufacturing and innovation, and trade
services dominate the local economy as measured by share of labour force employed.
Table 2: Employment by major sectors, 2006 – 2016
Major Economic Sectors Sooke CRD BC
2006 2011 2016 2006 2011 2016 2006 2011 2016
545 570 550 26,040 24,935 24,935 290,330 298,775 332,210
Tourism
(10%) (10%) (11%) (14%) (13%) (13%) (13%) (13%) (14%)
310 250 210 11,070 10,860 10,695 138,040 149,070 153,120
Business, finance and mgmt
(6%) (4%) (4%) (6%) (6%) (5%) (6%) (6%) (6%)
2,005 2,360 1,805 70,075 77,225 78,760 584,795 672,885 691,215
Public services
(38%) (39%) (37%) (37%) (40%) (40%) (27%) (29%) (28%)
1,300 1,400 1,215 39,540 39,195 41,040 614,155 596,335 645,340
Manufacturing and innovation
(24%) (23%) (25%) (21%) (20%) (21%) (28%) (26%) (27%)
985 1,190 980 33,285 34,315 35,090 455,890 475,500 493,640
Trade services
(18%) (20%) (20%) (18%) (18%) (18%) (21%) (21%) (20%)
180 220 185 8,945 8,210 8,695 109,895 112,745 112,335
Other services
(3%) (4%) (4%) (5%) (4%) (4%) (5%) (5%) (5%)
5,325 5,990 4,945 188,955 194,740 199,215 2,928,630 2,305,310 2,427,860
Statistics Canada –Census 2006, National Household Survey 2011 and Census 2016
6District of Sooke Economic Analysis
As per the 2016 Census, the public services sector (37 percent of the total labour force) accounts
for the highest share of Sooke’s labour force, with the second largest sector being manufacturing
and innovation (25 percent). Interestingly, the share of the Sooke workforce employed in tourism
in 2016 (11%) is lower than for CRD (13%) and BC (14%).
Demographics
Similar to the demographic trends across the country, British Columbia’s demographic trends
point toward slight declines in birth rates, slight increases in life expectancy, growing net
interprovincial migration, and increasing net international migration. These trends, along with the
aging of BC’s population have resulted in a steady population growth in the province from 3.9
million in 2001 to 4.65 million by 2016, which translates into an annual growth rate of roughly
1.16% during 2001 - 2016 (Census 2001 and Census 2016).
In comparison to the regional, provincial, and national population growth trends, the population in
Sooke significantly increased from 2001 to 2016. The increase in the Capital Regional District’s
population went from 325,755 to 383,360 at an annual rate of 1.2% (Census 2001 and Census
2016). The population in the District of Sooke increased from 8,165 in 2001 to 13,000 in 2016, at
a much higher rate of 3.2% as compared to the 1.2% for the Region and 1.16% for the Province.
Figure 3: Sooke Population Trends 2001-2016
Source: Urbanics Consultants Ltd. and Census 2001 – 2016
It is during this period the District has displayed a decrease of the working age population (15-64
age group) as a share of the total population from 68 percent to 66 percent. The age groups under
7District of Sooke Economic Analysis
15 years old have decreased and the population 65 and over increased from 13 percent to 17
percent of the total population.
Table 3: Sooke Population Composition by Age Cohort
Population 2001 2006 2011 2016
1,795 1,870 2,215 2,327
Under 15 years
(21%) (19%) (19%) (18%)
5,830 6,620 7,770 8,528
15 to 64 years
(67%) (68%) (68%) (66%)
1,110 1,210 1,455 2,145
65 years and over
(13%) (12%) (13%) (17%)
Total 8,735 9,700 11,440 13,000
Population growth rate
Period (5 years) 11% 18% 13.6%
Annual 2.2% 3.6% 2.7%
Source: Urbanics Consultants Ltd. and Census 2001 – 2016
Based on the above-mentioned historical population growth trends, the community is likely to
witness a continued decline in the share of its working age population, while the population under
15 years old also continues to shrink. The aging of the working age population and the declining
under-15 population during the next few decades will likely result in the continued increase of the
population over 65 years old.
Further, the declining share of its younger population suggests that fewer younger families are
moving to the District. These demographic trends are generally not positive for a jurisdiction
wishing to increase business investment and attract new employers. An older population profile
and a dearth of children and young families also portends declines in retail sales, harming the
viability of small and medium sized community-oriented businesses like restaurants, apparel
stores, and grocers. Successful implementation of a growth-oriented economic development
strategy may yield new employers relocating to Sooke, which bring with them new employees
and their families. This can help stem the greying population scenario.
The table below demonstrates two main commuting patterns for residents of Sooke, the CRD and
British Columbia. Due in part to the limited number of employers in Sooke, only 25 percent of
Sooke workers work within the community (defined as Census Subdivision of Residence). This is
significantly lower than the CRD (37 percent), and even lower than British Columbia (49 percent).
Employed residents that commute out of the community is 71 percent, which makes Sooke
primarily a bedroom and lifestyle community of the Greater Victoria area. However, many people
interviewed or surveyed indicated there are residents who want to work locally but find little to no
opportunity to do so.
8District of Sooke Economic Analysis
Table 4: Commuting Status of Sooke Residents
Commuting Status Sooke CRD BC
Commute within census subdivision (CSD) of residence 25% 37% 49%
Commute to a different census subdivision (CSD) within census division 71% 60% 46%
(CD) of residence
Commute to a different census subdivision (CSD) and census division
2% 2% 5%
(CD) within province or territory of residence
Commute to a different province or territory 2% 1% 1%
Source: Urbanics Consultants Ltd. and Census 2016
Table below compares the total annual household income of the District of Sooke, Capital
Regional District, and British Columbia based on the 2016 Census. The total household income
is the sum of the total incomes of all members of that household before income taxes and
deductions. It includes income from:
• employment income from wages, salaries, tips, commissions and net income from self-
employment;
• income from government sources, such as social assistance, child benefits, employment
insurance, old age security pension, pension plan benefits and disability income;
• income from employer and personal pension sources, such as private pensions and
payments from annuities and RRIFs;
• income from investment sources, such as dividends and interest on bonds, accounts,
GICs and mutual funds; and,
• other regular cash income, such as child support payments received, spousal support
payments (alimony) received and scholarships.
Table 5: Household Income Comparisons
Sooke CRD BC
Household income (2015)
# % # % # %
Under $5,000 75 1% 3455 2% 43,415 2%
$5,000 to $9,999 70 1% 2210 1% 27,140 1%
$10,000 to $14,999 130 2% 5135 3% 55,745 3%
$15,000 to $19,999 190 4% 6730 4% 77,565 4%
$20,000 to $29,999 425 8% 13400 8% 151,065 8%
$30,000 to $39,999 460 9% 14200 9% 156,475 8%
$40,000 to $49,999 440 8% 14430 9% 155,170 8%
$50,000 to $59,999 395 8% 13590 8% 143,475 8%
$60,000 to $79,999 735 14% 23705 15% 255,195 14%
$80,000 to $99,999 700 13% 19705 12% 210,770 11%
$100,000 to $124,999 665 13% 18110 11% 198,140 11%
$125,000 to $149,999 430 8% 12490 8% 138,420 7%
$150,000 and over 530 10% 13120 8% 271,290 14%
5,245 100% 160,280 100% 1,883,865 100%
Under $30,000 890 17% 30,930 19% 354,930 19%
$30,000 to $59,999 1,295 25% 42,220 26% 455,120 24%
$60,000 to $99,999 1,435 27% 43,410 27% 465,965 25%
$100,000 and over 1,625 31% 43,720 27% 607,850 32%
Source: Statistics Canada 2016 Census
9District of Sooke Economic Analysis
Sooke contained a smaller proportion of households with an annual total income of less than
$30,000 in 2015 (Table 5) as compared to the CRD and British Columbia. Roughly 17 percent of
total households in Sooke had an annual total income lower than $30,000 as compared to 19
percent for the CRD and 19 percent for the Province. The community contained a lower share of
households (25 percent) with annual total income in the range of $30,000 to $59,999 as compared
to 26 percent for the CRD; the municipality has a higher percent than the Province (24%).
Figure 4: Income Cohort Distribution
Source: Statistics Canada 2016 Census
The table below provides the median income of economic families and households in the
community as a share of the overall Provincial median income for each of the categories.
Table 6: Median Household Income Comparison
Median income in 2015 Comparison to BC (%)
Sooke CRD BC Sooke CRD
Economic families
Couple-only Family $ 77,605 $ 86,885 $ 80,788 96% 108%
Couple-with-children $ 107,520 $ 117,510 $ 111,736 96% 105%
Lone-parent Family $ 46,016 $ 54,039 $ 51,056 90% 106%
Family income in 2015 $ 85,811 $ 92,455 $ 88,451 97% 105%
1 person households $ 32,469 $ 37,429 $ 35,701 91% 105%
2 or more person households $ 86,763 $ 91,630 $ 88,466 98% 104%
Household income in 2015 $ 71,296 $ 69,995 $ 69,995 102% 100%
Source: Statistics Canada 2016 Census
The table above shows that the overall median family income in the District is 97% of the
Provincial median family income. In addition, the community’s median income is:
10District of Sooke Economic Analysis
• 96% of the Provincial median income for couple-only families;
• 96% of the Provincial median income for couple-with-children families; and,
• 90% of the Provincial median income for lone-parent families.
The table also suggests that the overall median household income in the District is 102% of the
Provincial median household income. The median income of economic families in the District is
slightly higher than the CRD and significantly higher than the Province. Thus, a large proportion
of households in the District are earning higher incomes than the CRD and the Province.
The education level of District of Sooke for postsecondary certificate, diploma, or degree is 55%
of the District’s population, significantly lower than the CRD (likely due to the concentration of
provincial employees) and the same as British Columbia. Sooke and the CRD do not closely
resemble each other in the educational levels attained in their populations. The education level
reflects a significant proportion of the working age population that may not have the skills at this
point to work in middle to high income jobs other than the manufacturing and trade services
industries.
It is also possible that the lower rates of education levels can be partly attributed to Sooke not
having enough jobs that match the skillset of people with higher levels of education. The District’s
proximity location to more populous cities (namely, Victoria, Langford and Saanich) could
contribute to “brain-drain”, which is the emigration of highly trained people to another economic
sector for more appropriate career opportunities, better pay or overall living conditions.
Table 7: Highest certificate, diploma or degree for the population aged 25 to 64 years in private households
Education Level Sooke CRD BC
No certificate, diploma or degree 12% 7% 16%
Secondary (high) school diploma or equivalency certificate 32% 25% 29%
Postsecondary certificate, diploma or degree 55% 68% 55%
Apprenticeship or trades certificate or diploma 12% 9% 9%
College, CEGEP or other non-university certificate or diploma 27% 22% 18%
University certificate or diploma below bachelor level 1% 3% 4%
University certificate, diploma or degree at bachelor level or above 15% 34% 25%
Source: Urbanics Consultants Ltd. and Census 2016
Sooke is a predominantly middle-income community with a smaller portion of people in poverty
or with low incomes than the CRD or the province. A key problem for any high-paying new
industries that wish to develop in Sooke is the shortage of high skill or highly educated workers.
Population Projections
According to BC Stats, the population of the Capital Regional District in 2018 was 413,406 and
its projected population for 2031 is 469,806; this translates to an annual population growth rate of
0.9 percent. The population projections in this report used the Census 2016 population counts for
the base year (2016) and the age cohort and gender-based population growth rates the Sooke
School District for the period 2001 - 2031 (P.E.O.P.L.E 2018, BC Stats, August 2019) to project
the population for the District of Sooke. These population projections are expected to incorporate
11District of Sooke Economic Analysis
all the components of population growth in the region such as fertility and mortality as well as
economic migration generated by economic growth and decline.
Given that the rapid rate of population growth in smaller communities eventually slows down as
populations hit certain sizes, the following table provides a projection for Sooke’s population
profile by 2036. Shaded cells represent the Consultant’s projections.
Table 8: Projected Population Growth
Source: Urbanics Consultants Ltd., PEOPLE 2018, BC Stats, Census Canada
The working age share of the population declines from 65% to 58%, but in absolute numbers it
should still be expected to increase by almost 3500 from 2016 to 2036. This is similar to the raw
numerical growth of the senior demographic which is projected to grow by 3400.
Conclusions
The conclusions from this chapter are as follows:
• Provincial economy in BC remains strong and will likely continue outperforming the
Canadian average
• Southern tip of Vancouver Island remains an attractive place to live and work due to
affordability and quality of life considerations
• Population growth rates in neighboring markets (30-40 minutes drive) of Langford,
Colwood and Saanich is some of the highest in Canada
• Low education levels hold back the viability of attracting high pay high value add
companies
• Most workers (71%) commute out of town for employment opportunities.
• Median incomes are comparable to BC and CRD
12District of Sooke Economic Analysis
3. Employment Land Inventory
The Employment land inventory will focus on the following:
• Review and assess previous studies, economic reports, District plans as well as any other
relevant documents.
• Draft baseline measures for employment, business activity and employment lands
capacity.
• Identify the following:
- Current employment and employment lands (retail, office, industrial, city-owned)
supply,
- Employment capacity,
- Methods to assign jobs to different land uses,
- Market characteristics such as rents, land costs, vacancy etc,
• Summarize opportunities and challenges for growth.
• Review and compare with similar sized municipalities:
- Property taxes (especially commercial and industrial),
- Employment lands capacity and availability,
- Employment land supply targets, including retail land supply targets,
- Permit activity for all type of commercial and industrial uses,
- Intensification of use in employment lands in close proximity to public transit
facilities,
- Distribution of retail use by type (large format, urban format etc.),
- Land prices and rents,
- Licensing and fees,
- Identify changes to make the District more business friendly.
Employment Land Supply
The zoning for employment lands in Sooke is quite comprehensive, with 5 zones for commercial
and 5 for industrial as well as 3 for institutional.
13District of Sooke Economic Analysis
Figure 5: Zoning Map of Sooke
Source: Urbanics Consultants Ltd. and District of Sooke
The purpose of this section would be to explore the total available commercial and industrial land.
The employment land base in Sooke is catalogued in the table below. Under utilization is defined
14District of Sooke Economic Analysis
as parcels wherein the building value is less than 50% of the total value (i.e. The land value is
greater than improvements value of the lot).
Table 9: Employment Land Base Inventory
Source: Urbanics Consultants Ltd. and District of Sooke
Industrial land supply
The total industrial land supply that is currently zoned and available in the District of Sooke is
56.61 hectares or 140 acres. Over 80% of industrial zoned land is M2, which is “General
Industrial” defined as per figure below.
15District of Sooke Economic Analysis
Figure 6: M2 Industrial zoning definition
Source: District of Sooke Bylaw No. 600, Sooke Zoning Bylaw, 2013
It should be noted that M2 zoning is quite an expansive and flexible zoning designation, which
bodes well for the ability of the District to attract a range of manufacturing, warehousing and
industrial industries.
Table 10: Industrial Land Supply
Zoning Area(HA) # of Parcels Land Utilization (hectares) Number of Parcels
Vacant Under-Utilized Adequately-Utilized Vacant Under-Utilized Adequately-Utilized
M1 1.56 3.00 1.56 0.00 0.00 3.00 0.00 0.00
M2 45.97 21.00 10.28 32.12 3.05 6.00 9.00 4.00
M3 1.56 9.00 0.55 1.02 0.37 2.00 4.00 3.00
M4 7.52 4.00 0.00 7.52 0.00 0.00 4.00 0.00
M5 0.00 0.00 0.00 0.00 0.00 0.00 0.00 0.00
Total 56.61 37.00 12.39 40.66 3.42 11.00 17.00 7.00
Source: Urbanics Consultants Ltd. and District of Sooke
Given that 32 hectares of M2 zoned land is under utilized, it is fair to conclude there is
significant capacity for additional industrial product as of now. In total there is approximately 41
hectares of under-utilized industrial land and 12 hectares of vacant industrial land.
Commercial land Supply
The total commercial land supply that is currently zoned and available in the District of Sooke is
40.22 hectares or 100 acres. Almost 50% of commercial zoned land is C2, which is “General
Commercial” defined as per figure below.
16District of Sooke Economic Analysis
Figure 7: C2 Zoning definition
Source: District of Sooke Bylaw No. 600, Sooke Zoning Bylaw, 2013
Table 11: Commercial Land Supply
Zoning Area(HA) # of Parcels Land Utilization (hectares) Number of Parcels
Vacant Under-Utilized Adequately-Utilized Vacant Under-Utilized Adequately-Utilized
CTC 3.47 12.00 2.08 1.29 0.10 6.00 5.00 1.00
C1 3.67 13.00 0.71 2.37 0.08 1.00 10.00 1.00
C2 19.78 94.00 3.51 8.82 6.53 9.00 51.00 22.00
C3 3.34 13.00 0.62 1.09 1.63 1.00 5.00 7.00
C4 9.95 47.00 0.25 8.67 0.04 1.00 36.00 6.00
Total 40.22 179.00 7.18 22.23 8.39 18.00 107.00 37.00
Source: Urbanics Consultants Ltd. and District of Sooke
It should be noted that C2 zoning is quite an expansive and flexible zoning designation, which
bodes well for the ability of the District to attract a range of retailing, personal service and
institutional/financial industries.
Given that 8.8 hectares of C2 zoned land is under utilized, as well as 8.67 hectares of C4
“Commercial Recreation” underutilized it fair to conclude there is significant vacant capacity for
17District of Sooke Economic Analysis
additional commercial product as of now. In total there is approximately 22 hectares of under-
utilized commercial land and 7 hectares of vacant commercial land.
Municipal land supply
The total municipal land in the District of Sooke is 1515 hectares or approximately 3740 acres.
Almost 96% of that land is zoned P1, which is “Public Recreation” defined as per figure below.
Figure 8: P1 Zoning definition
Source: District of Sooke Bylaw No. 600, Sooke Zoning Bylaw, 2013
18District of Sooke Economic Analysis
Table 12: Public Land Inventory
Zoning Area(HA) # of Parcels
P1 1452.58 173.00
P2 53.13 32.00
P3 9.68 8.00
Total 1515.39 213.00
Source: Urbanics Consultants Ltd. and District of Sooke
It should be noted that P1 zoning is quite an expansive recreation-oriented designation, which
bodes well for the ability of the District to attract a potential major traffic generating
recreation facility. In addition, there is a lot of public land which could potentially be
subdivided and sold off for redevelopment into commercial, industrial, and even residential
uses in the future, if demand warrants it and the District receives elector approval. Local
governments may dispose of properties for a number of reasons so long as the disposition is
within the regulatory requirements of the Local Government Act and Community Charter.
Market characteristics
Rents
Due to the limited scale of the Sooke commercial market, it has been difficult to assess
commercial rents for office or retail. Given the cursory review of existing retail listings, the
Consultant has identified only 1 retail storefront available, with asking rents of $18 per square
foot, and triple net gross rent of $29 per square foot. This is quite high for a semi rural and small
market but is in keeping with the escalating rents in Sooke for all other land uses and the low
vacancies that prevail currently. For comparison purposes, retail units in a high visibility
intersection (McCallum and Millstream) in Langford are listed for $35 per square foot, while prime
Victoria retail lease rates are approaching $45 per square foot.
Vacancies
Industrial Vacancies are at a historic low in Sooke and a new industrial park in Otter Point
is opening up to take advantage of any new industrial business formation. Despite its proximity
to the District of Sooke, the Sooke Business Park lies just outside of the boundaries on the
north west edge, and inside the boundaries of the Juan de Fuca Planning Area of the CRD. It is
offering serviced quarter acre lots from as low as $179,900. The park has over 50 acres of
land. This project is a result of a partnership between Three Point Properties and Ian Laing
Properties. The development site is minutes from the Westshore and approximately 45
minutes from downtown Victoria. The Otter Point area of Vancouver Island is experiencing
rapid growth with a sizeable number of residential developments now being proposed for the
area. There are already a few companies operating from the Sooke Business Park – such as
West Coast Super Storage, All Grit Sand Blasting, Brytar Contracting and Timber Jim Milling.
19District of Sooke Economic Analysis
Given the extent of this site, it is likely to draw most of the new industrial or business facilities
making it a competitor to the development of industrial land in the District of Sooke.
Taxes
A comparison of property tax mill rates is provided in table below.
Table 13: 2019 Property Tax Mill Rates
Source: Urbanics Consultants Ltd., property mill rates Sooke, Colwood, Langford, Saanich
Sooke does not have a major industrial tax classification, however, the light industry class
experiences mill rates of 26.9, which is approximately midway of Saanich’s 12.6 and Colwood’s
39.5. There may exist some opportunity to lower light industry mill rates in an effort to be
competitive with Langford or Saanich. For Business/Commercial mill rates, Sooke is positioned
in quite a competitive manner, at the second lowest with 15 vs. Langford’s 13.7. In general, the
Consultant does not recommend any changes to the business/commercial mill rate, but a gradual,
measured lowering of the light industry mill rate may prove wise in terms of improving the
attractiveness of Sooke, and enticing more industrial oriented firms to relocate to the District.
Licensing and fees, DCCs
The District of Sooke has streamlined its business licensing regime.
The District of Sooke became a participant in the Intermunicipal Business Licence Agreement in
2001. This agreement permits a holder of an Intermunicipal Business Licence to carry on the
business authorized by the licence within the boundaries of any of the Participating Municipalities.
The District of Sooke has issued 348 Intermunicipal Business Licences. 3
A business that is not located within the District of Sooke, usually a business based on the
mainland, is able to conduct business in the District when the purchase a Non-Resident Business
Licence. This licence is only valid in the municipality in which it was purchased. Currently, there
are 26 Non-Resident Business Licences. In 2018, the District of Sooke was one of the early
municipalities that adopted the InterCommunity Business Licence Bylaw, which further reduced
3
Bylaw Services - May 13, 2019 - RPT -2019-0033 File No. 4320,
https://sooke.civicweb.net/document/30277
20District of Sooke Economic Analysis
red tape and permitted mobile businesses to ply their trade annually in other participating
Vancouver Island communities for a reasonable fee of $170.00. The District of Sooke has issued
four of these Licences to date. This licence option has received positive feedback. All businesses
operating within the District of Sooke are required to hold a valid Business Licence. Those
businesses with addresses outside of the District boundaries are required to hold either
an Intermunicipal, Inter-Community or a Non-Resident Business Licence, as appropriate.
A comparison of Development Cost Charges (DCC) per square meter of developed gross floor
area for Commercial and Industrial land uses between Sooke, Colwood, Langford and Saanich is
included below.
Table 14: Comparison of Commercial Property DCC rates
Comparison of Commercial Property DCC rates
Sooke Colwood Langford Saanich
Wastewater $ 20.79 $ 12.37 $ 5.20 $ 17.86
Roads $ 48.70 $ 7.48 $ 55.78 $ 55.09
Total $ 69.49 $ 19.85 $ 60.98 $ 72.95
Source: Urbanics Consultants Ltd., https://sooke.civicweb.net/document/4006,
https://colwood.civicweb.net/document/194,
https://www.langford.ca/assets/Bylaws/Land~Use/DCC%20Bylaw%20No.%201700.pdf,
https://www.saanich.ca/assets/Local~Government/Documents/Engineering/dcc-handout-info-session-201807.pdf
Table 15: Comparison of Industrial Property DCC rates
Comparison of Industrial Property DCC rates
Sooke* Colwood Langford** Saanich
Wastewater $20.79 $ 6.19 $ 11.55 $ 8.42
Roads $48.70 $ 7.48 $ 7.97 $ 16.30
Total $ 69.49 $ 13.67 $ 19.52 $ 24.72
* Sooke has same fees for Commercial and Industrial
** Langford has water DCC's for industrial based on Hectares not sq m, converted on a 0.25 FSR assumption
Source: Urbanics Consultants Ltd., https://sooke.civicweb.net/document/4006,
https://colwood.civicweb.net/document/194,
https://www.langford.ca/assets/Bylaws/Land~Use/DCC%20Bylaw%20No.%201700.pdf,
https://www.saanich.ca/assets/Local~Government/Documents/Engineering/dcc-handout-info-session-201807.pdf
21District of Sooke Economic Analysis
Sooke’s DCC fees are some of the highest, especially for Industrial. Sooke is uncompetitive with
neighboring districts and municipal governments. Some of this is due to Sooke’s high cost
structure for infrastructure servicing due to its more rural and sprawled out nature as well as
the excess costs due to maintaining its own wastewater treatment facility.
The Consultant is aware of the District’s current work on an update on the DCC bylaw policies
and would advise the District leadership to:
• In the long term take steps to tighten up development boundaries and lower the DCC fees
in order to attract more commercial development.
• Encourage densification and intensification of land uses as well as more mixed-use
developments in the Town Centre and surrounding neighbourhoods.
• Review the lessons and agreements that led to the formation of the Langford and
Metchosin 300 acre Business Park.
Conclusions
The conclusion from the Employment Lands Inventory analysis is as follows:
• Plentiful pre-zoned employment lands exist in Sooke
• Large public land reserves also exist
• A significant portion of industrial and commercial lands are underdeveloped,
and underutilized
• Rents are quite high for a small community with a small population and commercial
services base
• Vacancies are low
• Property taxes are competitive
• The regulatory environment is conducive to business development
• DCC rates are high and uncompetitive with neighboring jurisdictions for a variety of
reasons.
22District of Sooke Economic Analysis
4. Employment and Industry Profile
This chapter will
• Determine and present an index of Sooke’s largest employers, and their share of total
employment.
• Present a breakdown of employment by NAICS code.
• Study Sooke’s employment base to determine which industries are present.
• Project the future employment numbers for the District as well as attendant warranted
commercial and industrial land needs.
Biggest employers
The top employers within Sooke are listed below according to the local Chamber of Commerce
and Worklink BC in no particular order:
• Ayre Manor
• Village Foods
• Western Foods
• The Prestige
• Coast Capital/Western Financial Group
• Hub Insurance
• Shoppers Drug Mart
• District of Sooke
Small businesses are generally referred to as less than 100 employees; all the businesses in the
District of Sooke fall into this category. About 79 percent of businesses have less than 10
employees. Healthcare will be an increasingly in-demand industry sector for jobs across the
Capital Regional District, due to the aging population.
NAICS Comparisons
The North American Industry Classification System (NAICS) is used by the United States,
Canada, and Mexico to classify businesses by industry. Each business is classified into a six-digit
NAICS code number based on the majority of activity at the business. A NAICS comparison
approach reveals the relative strength or weakness of a local markets different industries and can
provide clues as to what growth sectors may exist, and what sectors may lag.
The findings of the NAICS comparison is as follows:
• Sooke has a greater percentage of its workforce (18.7%) employed in goods producing
industries such as agriculture, mining, utilities, construction and manufacturing than the
CRD (12%), but roughly similar levels to the province of BC (19%). This is primarily driven
by relative advantage in manufacturing as well as rapid construction boom recently
experienced.
• Retail trade comprises 13.3% of the workforce in Sooke compared to only 11.6% in CRD
and 11.7% in BC. This is a soft indicator that the District may be home to either too much
retailing facilities per capita, or that retail facilities are not achieving high productivity and
23District of Sooke Economic Analysis
efficiency from employees. A secondary conclusion that can be drawn from this
observation is that the disproportionately large segment of the labour force employed in
retail sales is a factor in lowering median incomes since retail jobs have lower average
wages than professional and industrial, skilled labour positions.
• Sooke has a significantly lower share of workforce employed in transportation and
warehousing (3.6%) than the CRD (3.8%) and BC (5.3%), which is surprising given that
its manufacturing, construction, agriculture and mining sector shares are significantly
larger than the CRD. There may be opportunity for growth in this sector.
• Information and cultural services sector also employs a lesser share of workers in Sooke
(1.8%) than in CRD (2.1%) or BC (2.8%).
• Finance, insurance, real estate, education, professional and technical services sectors are
all underrepresented in the Sooke workforce compared to CRD and BC, which is
understandable given the relatively lower average education levels in the District.
• The Sooke healthcare sector (13.2%) is slightly smaller than the CRD (13.5%), but larger
than BC’s (11.2%) which reflects the demographic realities of the differing population age
pyramids. This is likely to be a growing sector in the future as well given the continued
growth of the senior population, which is projected to double in 20 years.
• Arts, entertainment, recreation, accommodation and food services combined account for
9.3% of workforce in Sooke. This is compared to 12% in CRD, and 10.9% in BC. It is
surprising that it is this low given the latent recreation and hospitality opportunities that
exist and can be leveraged in Sooke. This is a potential growth sector as well.
24You can also read