Digital communication and the city. Analysis of the websites of the most visited cities in the world in the COVID-19 era
←
→
Page content transcription
If your browser does not render page correctly, please read the page content below
RLCS, Revista Latina de Comunicación Social, 81, 81-108
      [Research] https://www.doi.org/10.4185/RLCS-2023-1845 | ISSN 1138-5820 | Year 2023

        Digital communication and the city.
        Analysis of the websites of the most
          visited cities in the world in the
                   COVID-19 era
                   Comunicación digital y ciudad.
   Análisis de las páginas web de las ciudades más visitadas en el
                  mundo en la era de la COVID-19

Laura Cervi.
Universitat Autónoma de Barcelona. Spain.
laura.cervi@uab.cat

Santiago Tejedor Calvo.
Universitat Autónoma de Barcelona. Spain.
santiago.tejedor@uab.cat

Kelly Robledo-Dioses.
Universitat Autónoma de Barcelona. Spain.
kelly.robledo@uab.cat

          How to cite this article / Normalized reference.
          Cervi, L., Tejedor Calvo, S., & Robledo-Dioses, K. (2023). Digital communication and the city.
          Analysis of the websites of the most visited cities in the world in the COVID-19 era. Revista Latina de
          Comunicación Social, 81, 81-108. https://www.doi.org/10.4185/RLCS-2023-1845

ABSTRACT
Nowadays, cities are competing to become the global community’s choice in investment, trade, tourism,
and partnerships. In this context, the redefinition of their communication strategy, especially at the
digital level, has become an urgent challenge. On the other side, COVID-19 has directly impacted all
facets of life and, particularly in the world of travel and tourism, has transformed into a communication
crisis for cities. On this basis, this paper, using a methodology already proven on websites of different
thematic areas, presents a descriptive, explanatory, and exploratory research on the websites of the
26 most visited cities in the world. Conceiving websites as the nerve center of cities communication
strategy, the study has applied an analysis tool based on six variables (usability, interactivity, information
offered, content typology and updating, social networks and transmedia content, and accessibility) and

Received: 14/07/2022. Accepted: 19/09/2022. Published: 02/01/2023.		                                        81
RLCS, Revista Latina de Comunicación Social, 81, 81-108
      [Research] https://www.doi.org/10.4185/RLCS-2023-1845 | ISSN 1138-5820 | Year 2023

organized around 75 thematic categories. This made it possible to deepen among other topics, on how
the city is shown through its digital channels, what and how it tells the story, and, very relevantly, how
cities have tackled COVID-19 related information on their websites. The research highlights, among
other aspects, a trend towards the mediatization of processes following routines typical of cybermedia,
warning of the need to increase the role of websites as informative spaces on COVID-19.

Keywords: Most visited cities; City communication; Websites; Cybermedia; Tourism; COVID-19;
Digital communication.

RESUMEN
Hoy en día, las ciudades compiten por convertirse en la elección de la comunidad mundial en materia
de inversiones, comercio, turismo y asociaciones. En este contexto, la redefinición de su estrategia
de comunicación, especialmente a nivel digital, se ha convertido en un reto urgente. Por otro lado,
la COVID-19 ha impactado directamente en todas las facetas de la vida y, particularmente, en el
mundo de los viajes y el turismo, se ha transformado en una crisis de comunicación para las ciudades.
Basados en esto, el presente trabajo, utilizando una metodología ya probada en sitios web de diferentes
áreas temáticas, presenta una investigación descriptiva, explicativa y exploratoria de los sitios web
de las 26 ciudades más visitadas del mundo. Concibiendo los sitios web como el centro neurálgico
de la estrategia de comunicación de las ciudades, el estudio ha aplicado una herramienta de análisis
basada en seis variables (usabilidad, interactividad, información ofrecida, tipología y actualización
de contenidos, redes sociales y contenidos transmedia, y accesibilidad) y organizada en torno a 75
categorías temáticas. Esto permitió profundizar, entre otros temas, en cómo se muestra la ciudad a
través de sus canales digitales, qué cuenta y cómo lo cuenta y, de forma muy relevante, cómo las
ciudades han abordado la información relacionada con la COVID-19 en sus webs. La investigación
destaca, entre otros aspectos, una tendencia a la mediatización de los procesos siguiendo rutinas propias
de los cibermedios, advirtiendo de la necesidad de incrementar el papel de las webs como espacios
informativos sobre la COVID-19.

Palabras clave: Ciudades más visitadas; Comunicación de la ciudad; Websites; Cibermedios; Turismo;
COVID-19; Comunicación digital.

1.   Introduction

Nowadays, cities are competing to become the global community’s choice in investment, trade,
tourism, and partnerships (De San Eugenio-Vela et al., 2020), therefore they increasingly need to
develop efficient communication tools, enabling them to project a positive image (Qi, 2021; Ünüvar et
al., 2019) and allowing them to connect them with multiple stakeholders (Mansilla & Milano, 2019).

In particular, in a context marked by a growing mediatization of society (Pérez-Tornero, 2020; Hjarvard,
2017), the use of Internet and digital technologies has radically revolutionized communication: social
media technologies have led to a change in the control of content creation processes, from a Web 1.0
mainly controlled by organizations towards the more inclusive approach of Web 2.0, which to a large
extent is an expression of interaction and participation of the end user (Cervi, 2019). Cities, like any
other entity, therefore, have to adapt their communication strategies to the particularities of the new
scenario (Kavaratzis & Kalandides, 2015; Novy & Colomb, 2019).

According to many authors, such as Vinyals-Mirabent et al. (2019) Vilenskii & Smirnova, (2020) and
Gretzel et al. (2020), although digital communication is composed of a wide range of strategies, web
pages should considered the main information space and the reference point in cities’ communicative
strategies.

Received: 14/07/2022. Accepted: 19/09/2022. Published: 02/01/2023.		                                  82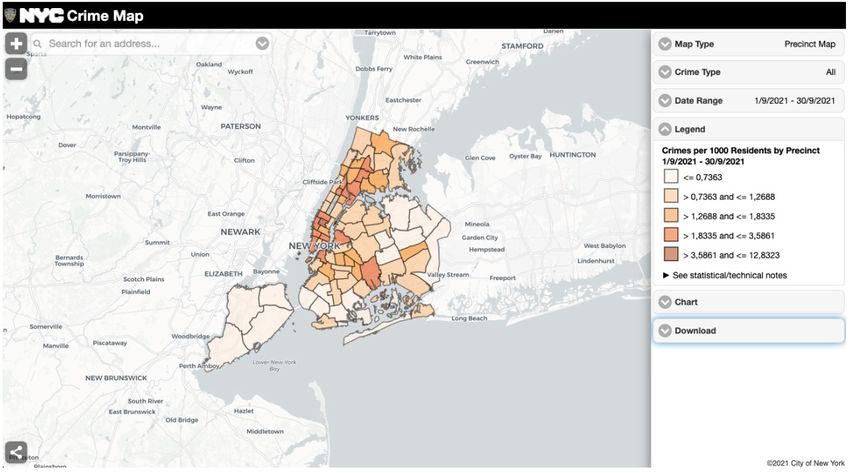
RLCS, Revista Latina de Comunicación Social, 81, 81-108
      [Research] https://www.doi.org/10.4185/RLCS-2023-1845 | ISSN 1138-5820 | Year 2023

On the other side, the planetary COVID-19 pandemic that has impacted all facets of people’s daily lives
– from social interaction habits (Prime et al., 2020) to new mental health issues (Kola et al., 2021) –
completely changing global economy (Keshky et al., 2020), not only has shown its main repercussions
in the field of travel and mobility (McKibbin & Fernando, 2020) generating a global “travel fear”
(Zheng et al., 2021) that has generated massive loss, especially in the tourism sector (Global Tourism
Economy Research Centre, 2020; World Tourism Organization, 2020), it has also engendered what the
World Health Organization has defined an “infodemic” (Eysenbach, 2020) characterized by rumors
and misinformation (Kumar & Nayar, 2020) and a climate of growing uncertainty and distrust, that
have forced institutions to tackle these events from a crisis communication perspective (Hantrais et
al., 2020).

    1.1. City branding

It is known that the concept of brand, understood as the symbolic representation of companies that
reflect the core values and philosophy of organizations against competitors (Anholt, 2006) can also be
applied to places (Keller & Richey, 2006).

Currently, more and more cities are striving for branding and marketing themselves to attract investors,
tourists, residents and workforce (Kavaratzis, 2005; Hospers, 2010), therefore city branding represents
one of the key features of contemporary global urban economy (Amore & Roy, 2020; Amore, 2019),
and has become a much-researched feature in urban tourism (Pearce, 2015).

According to Pasquinelli et al. (2021), branding conceptualizations can be summarized into two macro-
areas of scholarship: the first is focused on brand planning and communication, based on the design
and projection of the competitive identity and aimed to raise interest and attract tourists and place
users through differentiation and uniqueness (Qu et al., 2011); the second signals progressive attention
to a stakeholder-based view of place brands with a focus on the analysis of open, social, and shared,
multidirectional processes creating the meanings of the place brand, which is conceived as in constant
change and evolution (Kavaratzis & Kalandides 2015; Anholt, 2007).

Aligning with this second understanding, we consider that cities can use branding as a way to unite
relevant stakeholders around new competitive urban identities (Mansilla & Milano, 2019) and
communicate their message to target audiences (Gilboa et al., 2015), acknowledging that there is
mounting concern as to whether city marketing actually fulfils its purpose (Heeley, 2015).

As previously mentioned, websites are gradually establishing as the fundamental tool for communication
(Gretzel et al., 2020), both towards the exterior (companies, general public) and the interior (Vinyals-
Mirabent et al., 2019; Vilenskii & Smirnova, 2020) allowing the provision of a complete and
homogeneous set of information concerning both the overall characteristics of the city, opportunities,
description of support systems, etc.

At the same time, tourism and management literature alike (Ugur & Akbıyık, 2020) are drawing
increasing attention to the pandemic impacts on cities, identifying crisis management and crisis
communication as the fundamentals to steer emotional attachment with stakeholders (Hang et al.,
2020): along the same line, we understand that cities website should be the embryonic core (Tejedor et
al., 2022) for crisis communication, in this case for the communication of content related to COVID-19.

In this sense, agreeing with De San Eugenio-Vela et al. (2020), we understand that city branding is
rather distant from corporate branding, especially when it comes to crisis communication, since, as
already underlined by Anholt (2010) it should always embed a long-term strategy of local development,
combining market forces with the particular interests of local human capital.
Received: 14/07/2022. Accepted: 19/09/2022. Published: 02/01/2023.		                                83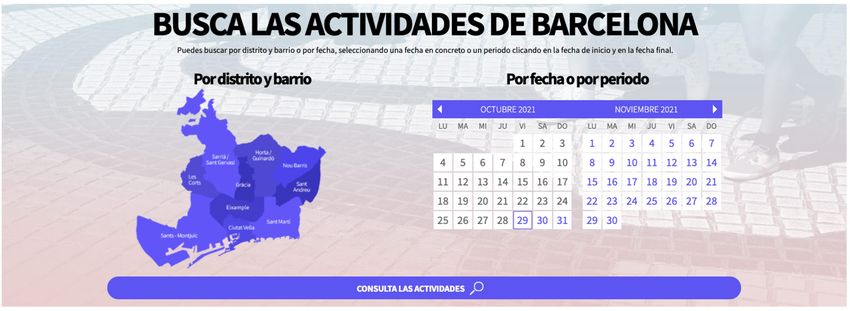
RLCS, Revista Latina de Comunicación Social, 81, 81-108
          [Research] https://www.doi.org/10.4185/RLCS-2023-1845 | ISSN 1138-5820 | Year 2023

2.       Objectives

Based on what we have seen, we understand that the cities are facing the double challenge to adapt
their communication strategies to the new media landscape and to face this unexpected pandemic
from the organizational (Rawaf et al., 2020; Sharifi & Khavarian-Garmsir, 2020) and communicative
perspective (Górska et al., 2022; Caldevilla-Domínguez et al., 2021). Aligning with Ritchie and Jiang
(2019) and McCartney et al. (2021) who advocate that future research should not only investigate cities
capabilities to emerge from a crisis, but also the ability to create future opportunities (Sigala, 2020) and
resilience (Filimonau & Coteau, 2020), this research analyzes the websites of the 26 most visited cities
in the world to display their main characteristics, communicative resources, strength and weaknesses,
deepening on how they deal with COVID-19 related information. In this sense our study not only
contributes to the broader knowledge about cities digital communication strategies but is also timely,
as it engages with the current ‘intrapandemic’ era debate about city resilience (McCartney et al., 2021).

3.       Methodology

To determine the sample of city websites to be analyzed, three of the most influential rankings
(Nathaniel & Adedoyin, 2020) have been selected - Euromonitor's International 100 City Destinations,
Mástercard's Global Destination Cities Index and Statista's World Ranking of the 20 most visited
cities- acknowledging that they identify the most visited cities in the world, using different criteria:

The first one includes data on international travelers visiting a city for at least 24 hours and excluding
domestic visitors, day-trippers and cruise passengers. Since in 2020, due to COVID-19, no winners
were published, we use data from 2019.

Mastercard's Global Destination Cities Index ranks 200 cities based on a proprietary analysis of
publicly available visitor volume and spending data. As in the previous case, the latest study published
by the Global Destination Cities Index dates from 2019.

The top 20 positions in this ranking exactly match, both in order and in numbers, the Global Ranking
of the 20 most visited cities by international tourists in 2018, published by Statista in September 2021,
which has been selected for the availability of the data.

In order to take advantage of the data from each of these rankings, we proceeded to create a list that
includes all the cities that each one presents in its top 20. After merging the first 20 places of each of
the rankings, the following list containing 26 cities has been obtained (Table 1). It is worth mentioning
that the order followed in this list is random.

Table 1. Worldwide most visited cities

           City              Country                 WebPage
     1     Hong Kong         Hong Kong, China        https://www.gov.hk/en/residents/
     2     Bangkok           Thailand                https://main.bangkok.go.th/
     3     London            United Kingdom          https://www.cityoflondon.gov.uk/
     4     Macau             Macau, China            https://www.gov.mo/en/
     5     Singapure         Singapore               https://www.gov.sg/
     6     Paris             France                  https://www.paris.fr/

Received: 14/07/2022. Accepted: 19/09/2022. Published: 02/01/2023.		                                    84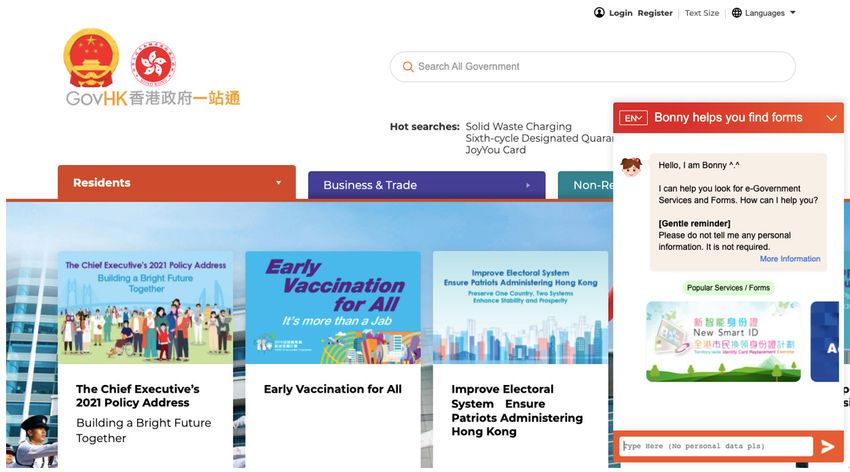
RLCS, Revista Latina de Comunicación Social, 81, 81-108
        [Research] https://www.doi.org/10.4185/RLCS-2023-1845 | ISSN 1138-5820 | Year 2023

   7    Dubai                United Arab Emirates    https://www.dm.gov.ae/
   8    New York City        US                      https://www1.nyc.gov/
   9    Kuala Lumpur         Malaysia                https://www.dbkl.gov.my/
  10    Istanbul             Turkey                  http://www.istanbul.gov.tr/
  11    Delhi                India                   https://delhi.gov.in/
  12    Antalya              Turkey                  http://www.antalya.gov.tr/
  13    Shenzhen             China                   http://www.sz.gov.cn/en/
  14    Mumbai               India                   https://mumbaicity.gov.in/
  15    Phuket               Thailand                https://www.phuket.go.th/webpk/default.php
  16    Rome                 Italy                   https://www.comune.roma.it/web/it/welcome.page
  17    Tokyo                Japan                   https://www.metro.tokyo.lg.jp/english/index.html
  18    Pattaya              Thailand                https://pattaya.go.th/
  19    Taipei               Taiwan, China           https://english.gov.taipei/
  20    Mecca                Saudi Arabia            https://mecca.net/
  21    Seoul                South Korea             http://english.seoul.go.kr/
  22    Osaka                Japan                   https://www.city.osaka.lg.jp/
  23    Milan                Italy                   https://www.comune.milano.it/
  24    Barcelona            Spain                   https://www.barcelona.cat/es/
  25    Palma de Mallorca    Spain                   https://www.palma.cat/portal/PALMA/home.jsp?codResi=1
  26    Bali                 Indonesia               https://www.baliprov.go.id/web/

                                        Source: Own elaboration.

The study, as previously stated, aims at answering the following research questions:

   1.    What are the defining characteristics of the websites of the most visited cities in the world in
   		    terms of content and access to information, visibility and usability?
   2.    What structural or content strengths and weaknesses are identified in these websites?
   3.    What interactive resources play a prominent role?
   4.    What kind of connection exists with other types of platforms, especially with social networks?
   5.    How do these website deal with COVID-19 related information?

In order to do so our research follows the Horus methodological approach, which has already been
successfully tested in other areas (Tejedor et al., 2020), as it inscribes itself within the broader "Horus
Project: Diagnosis of websites according to thematic areas", promoted by the Gabinete de Comunicación
y Educación (2005SGR00520) to analyze the characteristics of different websites.

Specifically, the research, grouncded on previous methodological framework built by Codina (2000;
2003), Tejedor (2010), Calvo-Calvo (2014) Cobos & Recoder (2019) and Codina & Pedraza Jiménez
(2016) identifies six main variables (see Table 2): usability, interactivity and relationship with users,
information presented, content typology and updating, presence in social networks and transmedia
content strategy, and accessibility. The variables are analyzed through 75 indicators (see Table 3),
which has been assessed by three coders using binary scoring (0/1) noting the presence or absence of
specific items, with 0 being "no" and 1 for "yes".

A first intercoder reliability test was implemented on a subset of the data (10%) to identify codes that
required refinement. The final intercoder reliability test, applied to the full dataset, met the kappa >0.80

Received: 14/07/2022. Accepted: 19/09/2022. Published: 02/01/2023.		                                    85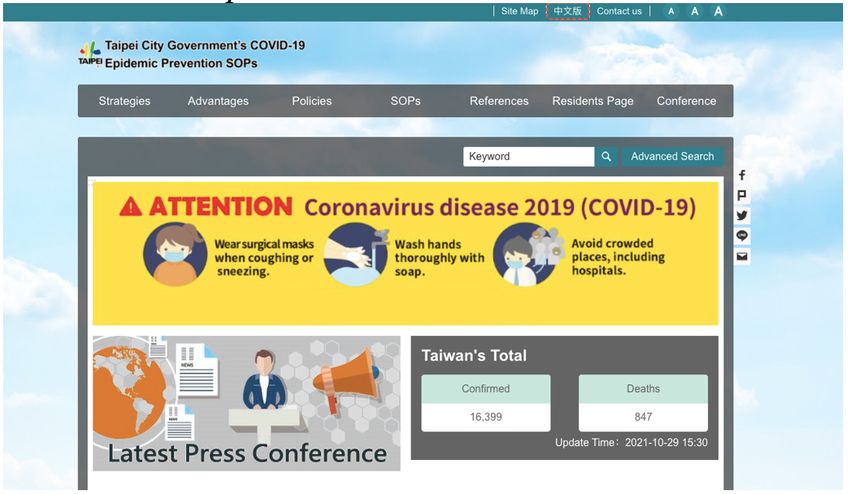
RLCS, Revista Latina de Comunicación Social, 81, 81-108
      [Research] https://www.doi.org/10.4185/RLCS-2023-1845 | ISSN 1138-5820 | Year 2023

standard for all the variables (Cohen, 1960). In addition, the web analysis dedicates a special section to
the analysis of the information referred to the COVID-19 pandemic on cities websites.

 Table 2. Research Variables and description

                  Research variable     Variable description
             1.   Usability             Intuitive handling and easy navigation through the page.
                  Interactivity and     Types of virtual exchanges between the city’s website and
             2.   relationship with     Internet users.
                  users
                  Information           Presence or not of relevant information for the user (about
                  offered               the city and about the website).
                                        3.1. Information on COVID-19. Focus on information
             3.
                                        about COVID-19 because of its impact on life and tourism
                                        in the cities.

                  Content typology      Types of content published and frequency of publication.
             4.
                  and updating
                  Social networks and   Presence in social networks and transmedia content strategy
             5.
                  transmedia content
                  Accessibility         Capacity of the website to respond effectively to users with
             6.
                                        special needs.

                                         Source: Own elaboration.

 Table 3. Research variables of study and indicators stablished for each one

Received: 14/07/2022. Accepted: 19/09/2022. Published: 02/01/2023.		                                   86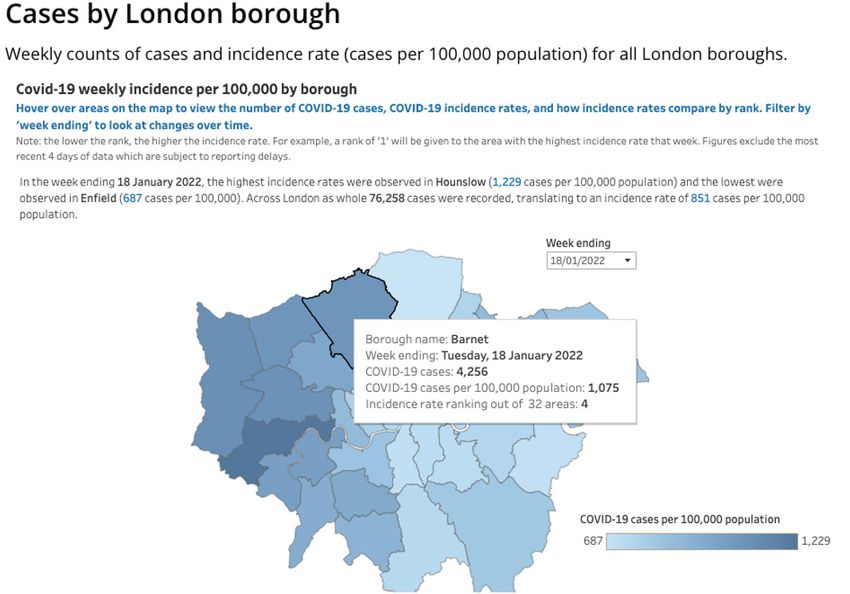
RLCS, Revista Latina de Comunicación Social, 81, 81-108
      [Research] https://www.doi.org/10.4185/RLCS-2023-1845 | ISSN 1138-5820 | Year 2023

Received: 14/07/2022. Accepted: 19/09/2022. Published: 02/01/2023.		                       87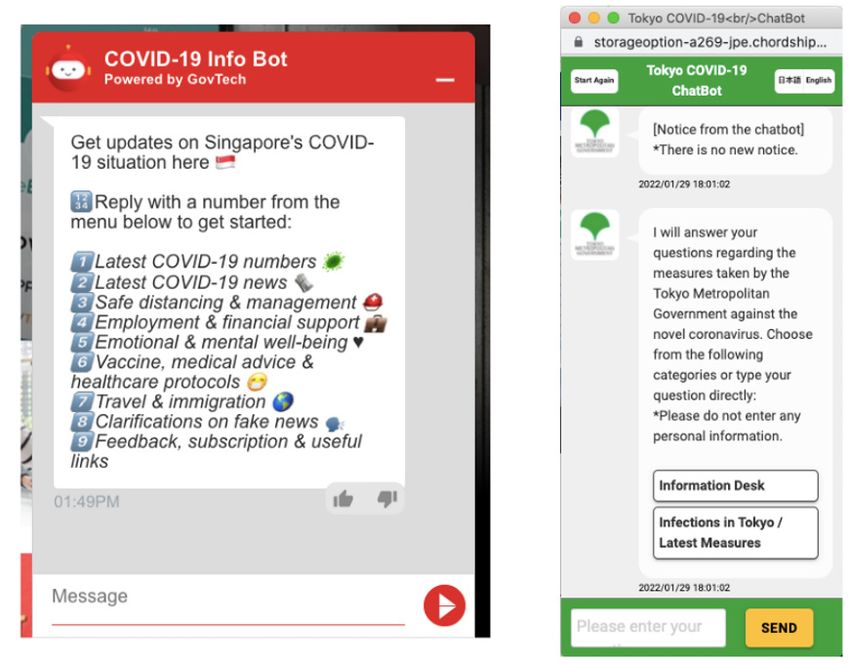
RLCS, Revista Latina de Comunicación Social, 81, 81-108
[Research] https://www.doi.org/10.4185/RLCS-2023-1845 | ISSN 1138-5820 | Year 2023
Source: Own elaboration from Codina (2000; 2003), Tejedor (2010),
Calvo-Calvo (2014) and Cobos & Recoder (2019).
4. Results
4.1. Usability
As shown in Figure 1, we can see that "Usability" is an aspect that has a high percentage of compliance
by the websites that make up the sample. The nine variables analyzed are fulfilled, at least, by more than
half of the websites. The aspects of presence of internal links to other sections of the city governance
website and the fact that the links describe the URL or the name of the linked website stand out as
being fulfilled by 100% of the websites.
Figure 1: Web pages’ usability analysis
Source: Own elaboration.
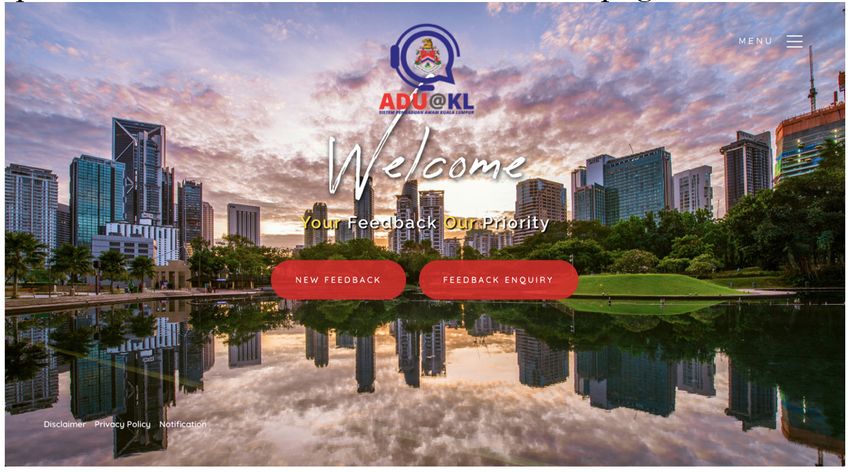
Also noteworthy is the high percentage of websites that include the content search tool (96.15%),
which allows users to make their navigation more useful and faster. A particular case in this regard is
the website of the Dubai city government, which allows content search through audio (Figure 2).
Figure 2: Dubai’s system of voice search
Source: https://www.dm.gov.ae/
Received: 14/07/2022. Accepted: 19/09/2022. Published: 02/01/2023. 88
RLCS, Revista Latina de Comunicación Social, 81, 81-108
      [Research] https://www.doi.org/10.4185/RLCS-2023-1845 | ISSN 1138-5820 | Year 2023

In terms of "Usability", the use of external links to the website and that the main navigation menu is
kept open on all pages also stand out with 92.31% of the websites that do so. Also with a high percen-
tage, most of the websites (88.46%) have a download time of less than 5 seconds with DSL.

It is also important to highlight that 69.23% of the analyzed website allow to choose between different
languages, a vital aspect when dealing with the websites of the cities that receive the most tourists
worldwide. In a slightly lower percentage, 61.54% of the websites have a site map. This point is con-
sidered relevant for websites so that the user does not get lost among the large amount of content they
can offer. Finally, 57.69% of the websites indicate the size, format and/or download time of the files
they host.

Finally, we have observed that all the analyzed web pages use Responsive Web Design (RWD). RWD
is an approach that considers that design and development should respond to the user's behavior and
environment based on screen size, platform, and orientation (Perakakis & Ghinea, 2017).), in order
to enrich the users’ experience. Accordingly, all the web pages under scrutiny adapt dynamically and
automatically adjust for different screen sizes, proportions, and orientations (Parlakkiliç, (2022).

In the same vein, acknowledging that today two billion people access the internet from their smartpho-
nes only. By 2025, that number is expected to jump to 72.5% (Rothe et al., 2022) Mobile-first design,
a design philosophy that aims to create better user experiences by beginning the design process with
mobile devices in mind first, often prioritizing the smallest of screens, is becoming crucial to all suc-
cessful web design (Kim et al., 2021). In our study, all the analyzed webpages display a Mobile-first
design, revealing that cities understand the importance of mobile communications.

    4.2. Interactivity and relationship with users

Regarding "Interactivity and relationship with users", as shown in Figure 3, it was found that most
of the analyzed websites (92.31%) provide contact data such as telephone, postal address and/or fax
of general information of the city governance. However, when it comes to providing the same data,
but for specific areas of city governance, the percentage is lower (69.23%). Likewise, 69.23% of the
websites provide the mail for consultation or request of general information, while 57.69% provide the
mails for request or consultation with the specific services of the city governance.

                 Figure 3: Analysis of interactivity and relationship with users

                                      Source: Own elaboration.

Received: 14/07/2022. Accepted: 19/09/2022. Published: 02/01/2023.		                                 89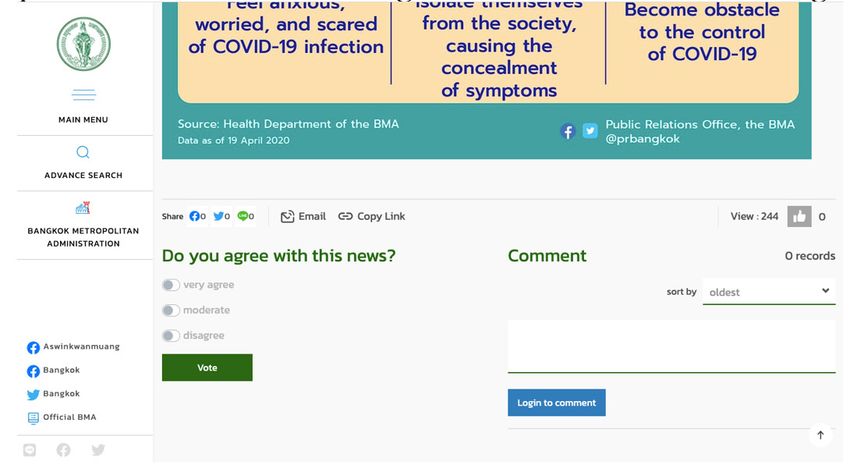
RLCS, Revista Latina de Comunicación Social, 81, 81-108
      [Research] https://www.doi.org/10.4185/RLCS-2023-1845 | ISSN 1138-5820 | Year 2023

It is worth noting that more than half of the websites analyzed (61.54%) offer a suggestion box. One
of the websites that works very well in this aspect is the Kuala Lumpur governance website (Figure
4), which has developed a specific space where users can provide feedback on the website.

                       Figure 4: Users’ feedback space in Kuala Lumpur web

                                  Source: https://www.dbkl.gov.my/

Another aspect of "Interactivity and relationship with users" analyzed was the possibility of requesting
an appointment through the website to carry out procedures in the city government, which showed
that only 39.77% of the websites do so. Finally, it was also found that, with respect to the possibility
of doing procedures online, this is only available on 34.62% of the websites. The Paris governance
website is a good example of these points analyzed, as it allows some procedures to be carried out
online and also some payments.

    4.3. Information offered

In relation to the "Information presented" on the websites analyzed (Figure 5), it was found that 80.77%
of them present access data to the city government building, such as the exact address. However,
only some (11.54%) show the map of the government building, thus providing information that helps
citizens to better locate themselves within the place.

                            Figure 5: Analysis of the information offered

                                      Source: Own elaboration.

Received: 14/07/2022. Accepted: 19/09/2022. Published: 02/01/2023.		                                90
RLCS, Revista Latina de Comunicación Social, 81, 81-108
[Research] https://www.doi.org/10.4185/RLCS-2023-1845 | ISSN 1138-5820 | Year 2023
Figure 5 also shows that almost all the websites analyzed (92.31%) show the portfolio of services
offered by the city government by area. In addition, most of the websites (88.46%) make a presentation
of the city government, either through a governor's letter, the description of the institution's mission
and vision, etc. Likewise, 73.08% of the websites offer the government's organization chart, and in
a lower percentage (65.38%) present the personnel of the different areas with position and name. It
was also found that only 38.46% of the websites present the annual report/s or report/s of the city
government, with this percentage we are facing an exercise of transparency that is lacking.
Figure 6: Analysis of the information offered (II)
Source: Own elaboration.
Continuing with "Information presented", Figure 6 shows that almost all of the websites (96.15%)
host a section on government news, city news or other topics of general interest to citizens. It is also
seen that the majority (92.31%) offer information that serves as a guide for citizens. In the same
percentage 92.31% of the websites provide information on the activities taking place in the city, an
example of this is the website of the government of Barcelona, which uses a dynamic graphic to
present this data (Figure 7).
Figure 7: Presentation of the activities of the city of Barcelona through a dynamic graphic
Source: https://www.barcelona.cat/es/
Received: 14/07/2022. Accepted: 19/09/2022. Published: 02/01/2023. 91RLCS, Revista Latina de Comunicación Social, 81, 81-108
[Research] https://www.doi.org/10.4185/RLCS-2023-1845 | ISSN 1138-5820 | Year 2023
Figure 6 also shows that a large number of websites (80.77%) present information on user services
provided by the city government. In a smaller percentage, 70.83% of the websites have a section or
provide information that serves as advice for their citizens or tourists. In addition, 65.38% provide
information on how to make a complaint to the city government or give it a suggestion. And in the
same percentage (65.38%), there are many websites that allow the user of the website to know what
their rights and duties are in such digital environment, presenting, for example, their privacy policies.
Figure 8: Space dedicated exclusively to the publication of information related to COVID-19,
developed by the Taipei City Government website
Source: https://english.gov.taipei/covid19/
Within the information presented by the websites analyzed, it was convenient to identify if they
present information related to the Coronavirus pandemic. In this regard, it was found that more than
half of the websites (65.38%) dedicate a section to COVID-19 (Figure 6). An example of this is the
website of the Taipei city government (Figure 9), which has developed a specific space, linked to
the platform, in which it elaborates on the subject, providing numerical data on contagion, policies
applied in the city, press releases, among others. We will go into more detail on this topic later on.
Figure 6 also shows that almost half of the websites (46.15%) have a press or communication section of
the city government. Below this, 23.08% provide information on office hours. Likewise, only 15.38%
provide information on how to get to the offices, showing, for example, the transportation lines. Lastly,
none of the web sites provides information related to local cafeterias.
4.3.1 Information on COVID-19
Based on the afore mentioned 65.38% of websites that have a section or section dedicated to COVID-19,
the information shown in such spaces was examined in greater depth (Figures 9 and 12). Thus, it was
found that more than half of the group of websites that dedicate a space to COVID-19 (52.94%) have
created a complete web page on the topic, which has been linked to the city's website. Examples of this
are the Taipei website mentioned above (Figure 9), also the websites of Barcelona, Bangkok, New York,
Shenzhen, among others. Of the remaining websites in the group, 47.06% devote a significant amount
of space and/or a complete section to the topic, and only 5.88%, although they provide information on
the topic, do not do so in a significant amount of space.
Received: 14/07/2022. Accepted: 19/09/2022. Published: 02/01/2023. 92RLCS, Revista Latina de Comunicación Social, 81, 81-108
[Research] https://www.doi.org/10.4185/RLCS-2023-1845 | ISSN 1138-5820 | Year 2023
Figure 9: Information on COVID-19 presented on the websites
Source: Own elaboration.
Figure 9 also shows that a large part of the group of websites that dedicate space to the COVID-19
topic present updated information (82.35%). Likewise, 64.71% of these websites provide exclusive
communication channels for COVID-19 related queries. In this regard, the websites of Singapore and
Tokyo stand out, which have developed exclusive chatbots to engage in conversation on the subject
(Figure 10).
Figure 10: “COVID chatbots” developed in Singapore and Tokio’s webpages
Source: https://www.gov.sg/ and https://www.metro.tokyo.lg.jp/english/index.html
The fact of using digital resources to bring information on COVID-19 closer to citizens is also reflected
in the use of interactive graphics by some of the websites (29.41%), as is the case of the website of
the city of London (Figure 11).
Received: 14/07/2022. Accepted: 19/09/2022. Published: 02/01/2023. 93RLCS, Revista Latina de Comunicación Social, 81, 81-108
[Research] https://www.doi.org/10.4185/RLCS-2023-1845 | ISSN 1138-5820 | Year 2023
Figure 11: Information on COVID-19 in an interactive format on the City of London website
Source: https://www.cityoflondon.gov.uk/
Within the group of websites that dedicate space to COVID-19, we also analyzed how information
related to city/country rules and traveler entry requirements is presented. A sharp contrast was found
between the two types of data, as while city/country rules on pandemic protection are displayed on
94.12% of the group's websites, COVID-19 related entry requirements are only visible on 23.53% of
the group's websites (Figure 12).
Figure 12: Information on COVID-19 related to the rules in force in the area and the entry
requirements for travelers
Source: Own elaboration.
We also delved into how each of these two topics are developed. Thus, it was found that of the
group of websites presenting the rules in force in the city/country related to COVID-19, the majority
(87.50%) developed the information on the website itself, while the remaining (12.50%) only offered
links that redirected to websites of other institutions.
Finally, of the group of websites that present the requirements for travelers entering the city/country,
75% distinguish travelers according to their country of origin, as is the case of the Hong Kong website
(Figure 13). It was also found that, of this group of websites, only 25% distinguish rules according to
Received: 14/07/2022. Accepted: 19/09/2022. Published: 02/01/2023. 94RLCS, Revista Latina de Comunicación Social, 81, 81-108
[Research] https://www.doi.org/10.4185/RLCS-2023-1845 | ISSN 1138-5820 | Year 2023
type of travel. Lastly, half of the websites in this group provide information on entry requirements on
the same website, while the other 50% only offer links that redirect to websites of other institutions.
Figure 13: Entry requirements for travelers to Hong Kong published on the city's website
Source: https://www.coronavirus.gov.hk/eng/index.html
4.4. Content typology and updating
The analysis of the websites in relation to the "Typology and updating of contents" (Figure 14) shows
that 92.31% of the websites have updated information that is less than one month old considering the
date of revision. However, only 19.23% present the date the website was updated. It was also found that
only 38.46% of the websites highlight keywords using bold type, an important resource in the digital
environment for text optimization.
Figure 14: Analysis of the typology and update of the contents of the websites of the city
governments
Source: Own elaboration.
Received: 14/07/2022. Accepted: 19/09/2022. Published: 02/01/2023. 95RLCS, Revista Latina de Comunicación Social, 81, 81-108
[Research] https://www.doi.org/10.4185/RLCS-2023-1845 | ISSN 1138-5820 | Year 2023
In addition to the above, Figure 14 shows that in all the websites analyzed (100%) there is textual and
photographic content, basic resources present in digital platforms. In addition, 92.31% host multimedia
content, for example, the "Crime Map" hosted on the website of the New York City government
(Figure 15).
Figure 15: “Crime Map”, multimedia map hosted on the New York City government website
Source: https://www1.nyc.gov/
Likewise, in Figure 14 we can see that audiovisual content (videos) is present in 76.92% of the websites
analyzed, for example, the website of the government of the city of Rome allows live videos of the
sessions of the administration to be viewed. On the other hand, audio content (podcasts) is present in
only a quarter of the websites analyzed (26.92%). Forums or chats are only available in 11.54% of the
websites; an example of this is the "Bonny" chat on the website of the government of the city of Hong
Kong, which provides help in searching for e-government forms and services (Figure 16).
Figure 16: “Bonny”, the Hong Kong city government website chat
Source: https://www.gov.hk/en/residents/
Received: 14/07/2022. Accepted: 19/09/2022. Published: 02/01/2023. 96RLCS, Revista Latina de Comunicación Social, 81, 81-108
[Research] https://www.doi.org/10.4185/RLCS-2023-1845 | ISSN 1138-5820 | Year 2023
Figure 16 shows that 61.54% of the websites analyzed allow their contents to be promoted through
social networks. Below this percentage, 23.08% of websites offer the option of subscribing to a
newsletter, as is the case, for example, with the websites of the governments of Milan, Paris, and Rome.
It was also found that only 3.85% of websites offer the option of commenting on their publications.
In this line, the website of the government of the city of Bangkok (Figure 17), which in addition
to allowing comments, offers the option of indicating agreement or disagreement with the content,
giving "likes", and the number of views of the publication, stands out.
Figure 17: Possibility to indicate agreement or disagreement with the published content, option
available on the Bangkok City Government website
Source: https://main.bangkok.go.th/
Also in a low percentage, as shown in Figure 14, 3.85% of the websites host 360 videos or photographs.
This can be seen in the website of the government of the city of Seoul (Figure 18). And to finish with
this section, it was found that none of the websites have gamified content or augmented reality content.
Figure 18: Presence of 360 videos on the Seoul city government website
Source: http://english.seoul.go.kr/
Received: 14/07/2022. Accepted: 19/09/2022. Published: 02/01/2023. 97RLCS, Revista Latina de Comunicación Social, 81, 81-108
[Research] https://www.doi.org/10.4185/RLCS-2023-1845 | ISSN 1138-5820 | Year 2023
4.5. Social networks and transmedia content
As can be seen in Figure 19, in relation to "Presence in social networks and transmedia content
strategy", it was found that most of the websites analyzed (69.23%) are present in some social network
and provide links to these from their own platform. This percentage coincides, naturally, with the
69.23% of websites that develop a transmedia content strategy.
Figure 19: Analysis of the presence in social networks and transmedia content strategy on the
websites of city governments
Source: Own elaboration.
Likewise, Figure 19 shows that 73.08% of the websites analyzed have a presence on Facebook and the
same percentage (73.08%) on Twitter. It can also be seen that more than half of the websites analyzed
(57.69%) have their own channel on YouTube, and the same percentage (57.69%) have a profile on
Instagram. However, only 3.85% of the websites have a profile on TikTok, such as the Singapore city
government website.
4.6. Accessibility
On the sample of websites, it was applied the automatic Web Accessibility Test (WAT), a tool developed
by the Information and Communications Technology Center (http://www.tawdis.net), wich aim is to
check the level of accessibility achieved in the design and development of web pages in order to access
to all persons irrespective of their characteristics.
According to the results provided by WAT, all the websites analysed have a variable number of problems
and warnings, at ‘perceivable’, ‘operable’, ‘understandable’ and ‘robust’ level (Figure 20). Specifically,
where most problems and warnings are detected is at the 'perceivable' level, meaning that information
and user interface components on websites are not presented in a way that can be perceived.
Received: 14/07/2022. Accepted: 19/09/2022. Published: 02/01/2023. 98RLCS, Revista Latina de Comunicación Social, 81, 81-108
[Research] https://www.doi.org/10.4185/RLCS-2023-1845 | ISSN 1138-5820 | Year 2023
Figure 20: Analysis of accessibility on the websites of city governments
Source: Own elaboration, according to the results provided by WAT.
At the 'operable' level is where the second most problems and warnings are found, as the user interface
and navigation components are not operable. These are followed by problems and warnings at the
'robust' level, meaning that web content is not robust enough to be reliably interpreted by a wide
variety of user agents. Finally, although fewer in number, problems and warnings were also detected
at the 'understandable' level, as the information and handling of the user interface is not presented in
an understandable way.
With all these items identified, the evaluation places the entire sample analyzed in a WAI-AA register,
which means that they occupy the intermediate position in the WAT evaluation. It is worth noting that
the websites where the fewest problems and warnings were found are those of the city of London (43),
Taipei (91) and Tokyo (99); while the websites where the most problems and warnings were detected
are those of Mecca (3626), Phuket (1143) and Palma de Mallorca (639).
5. Discussion and conclusions
Our analysis of the websites of the 26 most visited cities in the world contributes to the global
understanding of how cities are implementing digital communication strategies by confirming what
already pointed out by Vinyals-Mirabent et al. (2019), Vilenskii and Smirnova, (2020) and Gretzel et
al. (2020): websites are the core of cities digital communication.
Our study, in addition, allows us to establish a series of conclusions of great value, both for the
construction of a general diagnosis of the digital strategy of these platforms and to warn of possible
trends in the communicative exploitation of the websites.
As said, firstly, the study detects the great corporate, communicative and functional value that the
website has in each analyzed case. The navigation proposals continue to opt for a reading of the
screen from a general logic and, as pointed out by Pérez-Tornero (2020), there is a commitment to
the mediatization of the processes with the aim of connecting with the target public. The commitment
to a permanent main navigation menu that appears available throughout the browsing process, a
generalized trend in most of the cases studied, underlines the will to take advantage of the main frame
of the screens with contents and allow the user to access from any section to another section of the
website. The permanent updating of contents anticipates a tendency to bring these websites closer to
the logic of cybermedia (Salaverría, 2017; Tejedor et al., 2020) and underlines a dialogic will.
Received: 14/07/2022. Accepted: 19/09/2022. Published: 02/01/2023. 99RLCS, Revista Latina de Comunicación Social, 81, 81-108
[Research] https://www.doi.org/10.4185/RLCS-2023-1845 | ISSN 1138-5820 | Year 2023
In this sense we can observe that ICTs are still not fully exploited and technologies such as gamification
or more interactive tools are not fully implemented.
Accordingly, future research should deepen on the possibilities of this type of technological development,
in a context where Internet user profiles increasingly demand greater protagonism and yearn to be able
to participate and immerse themselves in browsing experiences that give them a leading role.
In this sense we noticed, in most cases a lack of interactive governance opportunities that would be
particularly helpful for both interior and exterior stakeholders.
Linked to the previous point, cities presence in social networks, especially Facebook, Youtube,
Instagram and Twitter, is good. However, the relevance of further study of this type of platforms and,
especially, their inclusion within a general strategy that connects them with the main corporate website
is once again raised.
Finally, as for the crisis communication aspect related to COVID-19, we can appreciate how cities do
not seem fully prepared to create a global strategy to tackle this emergency.
In this sense, not only our results align with previous findings, for example those of Qui and colleagues
(2020), but also suggest that cities shoud be place at the center of the fight against a pandemic (Sharifi,
& Khavarian-Garmsir, 2020).
Acknowledging thar clearer communication and information dissemination are required to ensure
campaigns and public policies are coherent, transparent and contextualized, there is therefore an
important lesson to learn: as we have seen in our analysis, the case of Tokyo Singapore stand out
and can be considered as best practices. Both Tokyo and Singapore applied the lessons from past
pandemics and had the investigative capacities, health systems and, more importantly, used ICTS, such
as chatbots, to keep a constant communication flows with citizens.
In this sense, many authors suggest to build and strengthen pandemic preparedness indexes (Kentikelenis
& Seabrooke, 2022): we suggest that a pandemic preparedness index at the city level may further assist
in strengthening pandemic preparedness and responses. In addition these indexes should focus on
communicative tool, and specifically cities’ webpages, as the main option to keep citizens informed.
Therefore, we can conclude, together with Gretzel et al. (2020) that cities should make an effort to
transform this crisis into an opportunity to develop a new communicative strategy, able to strengthen
their relationship with stakeholders by creating a new, more open, dialogic relationship with both
visitors and residents.
Future studies, thus, should focus on looking at how applications and technologies used during the
COVID pandemic are kept functioning and/or are used for other communicative purposes by cities.
On another level, as pointed out by –among others- Davidson and colleagues (2019) city networks of
late have transcended beyond municipal collaborations towards more complex networked governance
arrangements that provide cities with significant opportunities.
As such, these new forms of cross-national networking are potentially framing and reframing urban
governance and strategy, and the way we conceive of cities, and their policies and politics, in an age of
planetary urbanization (Meagher et al., 2021).
Received: 14/07/2022. Accepted: 19/09/2022. Published: 02/01/2023. 100RLCS, Revista Latina de Comunicación Social, 81, 81-108
[Research] https://www.doi.org/10.4185/RLCS-2023-1845 | ISSN 1138-5820 | Year 2023
Accordingly, if both sharing best practices and connecting local decision makers with other cities to
share knowledge, experience and, where possible, resources have become critically important during
a crisis: therefore, it is seminal for cities to articulate themselves in networks and/or to exploit the
existing networks to organize themselves and offering a more resilient response to the current and
(possible) future crises.
As shown by Acuto and Rayner (2016), the potentials of improved coordination mechanisms across
cities could provide platforms for urban centered strategies on responding to pandemics.
The C40 network, established in 2005 with 95 affiliated cities in 2022, to address the effective delivery
in urban-focused climate initiatives’ has acted as a catalyst to help cities interact with others collectively
(Acuto & Rayner, 2016) make a perfect example: during COVID-19 pandemic C40 launched a
dedicated COVID-19 portal that includes a knowledge hub to better support city governments through
knowledge sharing, dissemination, and peer networks.
6. References
Acuto M, & Rayner S. (2016). City networks: breaking gridlocks or forging (new) lock-ins?
International Affairs, 92(5), 1147-1166. https://doi.org/10.1111/1468-2346
Amore, A. (2019). Tourism and Urban Regeneration: Processes Compressed in Time and Space.
Routledge.
Amore, A., & Roy, H. (2020). Blending foodscapes and urban touristscapes: international tourism and
city marketing in Indian cities. International Journal of Tourism Cities, 6(3), 639-655.
https://doi.org/10.1108/IJTC-09-2019-0162
Anholt, S. (2006). The Anholt-GMI city brands index: how the world sees the world’s cities. Place
Branding, 2(1), 18-31. https://doi.org/10.1057/palgrave.pb.5990042
Anholt, S. (2007). Competitive Identity: The New Brand Management for Nations, Cities and Regions.
Palgrave Macmillan.
Anholt, S. (2010). Places: Identity, image and reputation. Palgrave Macmillan.
Caldevilla-Domínguez, D., Barrientos-Báez, A., & Padilla-Castillo, G. (2021). Twitter as a tool for
citizen education and sustainable cities after COVID-19. Sustainability, 13(6), 3514.
https://doi.org/10.3390/su13063514
Calvo-Calvo, M. A. (2014). Calidad y características de los sitios web de los hospitales españoles de
gran tamaño. Rev. Española Doc. Científica, 37(1), e032.
https://doi.org/10.3989/redc.2014.1.1049
Cervi, L. (2019) Travellers’ virtual communities: A success story. Universitas, Revista de Ciencias
Sociales y Humanas, 30, 97-125. https://doi.org/10.17163/uni.n30.2019.05
Cobos Urbina, E., & Recoder Sellarés, M. J. (2019). Modelo de análisis web para centrales nucleares:
estudio del caso de España. Estudios sobre el Mensaje Periodístico, 25(2), 727-745.
https://doi.org/10.5209/esmp.64799
Received: 14/07/2022. Accepted: 19/09/2022. Published: 02/01/2023. 101RLCS, Revista Latina de Comunicación Social, 81, 81-108
[Research] https://www.doi.org/10.4185/RLCS-2023-1845 | ISSN 1138-5820 | Year 2023
Codina, L. (2000). Evaluación de recursos digitales en línea: Conceptos, indicadores y métodos. Rev.
Española Doc. Científica, 23, 9-44. https://doi.org/10.3989/redc.2000.v23.i1.315
Codina, L. (2003). Hiperdocumentos: Composición, estructura y evaluación. In: Díaz, J., & Salaverría,
R. (Eds.), Manual de Redacción Ciberperiodística, 141-194. Ariel.
Codina, L., & Pedraza-Jiménez, R. (2016). Características y componentes de un sistema de análisis de
medios digitales: El SAAMD. In: Pedraza-Jiménez, R. Codina, L., & Guallar, J. (Eds.), Calidad
en Sitios Web. Método de Análisis General, E-commerce, Imágenes, Hemerotecas y Turismo,
15-39. Editorial UOC.
Cohen, J. (1960). A coefficient of agreement for nominal scales. Educational and psychological
measurement, 20(1), 37-46. https://doi.org/10.1177/001316446002000104
Davidson, K., Coenen, L., & Gleeson, B. (2019). A decade of C40: Research insights and agendas for
city networks. Global Policy, 10(4), 697-708. https://doi.org/10.1111/1758-5899.12740
De San Eugenio-Vela, J., Ginesta X., & Kavaratzis, M. (2019). The critical role of stakeholder
engagement in a place branding strategy: a case study of the Empordà brand. European
Planning Studies, 28(7), 1393-1412. https://doi.org/10.1080/09654313.2019.1701294
Eysenbach, G. (2020). How to Fight an Infodemic: The Four Pillars of Infodemic
Management. Journal of medical Internet research, 22(6), e21820.
https://doi.org/10.2196/21820
Filimonau, V., & Coteau, D. D. (2020). Tourism resilience in the context of integrated destination and
disaster management (DM2). International Journal of Tourism Research, 22(2), 202-222.
https://doi.org/10.1002/jtr.2329
Gilboa, S., Jaffe, E.D., Vianelli, D., Pastore, A., & Herstein, R. (2015). A summated rating scale for
measuring city image. Cities, 44, 50-59. https://doi.org/10.1016/j.cities.2015.01.002
Global Tourism Economy Research Centre. (2020). UNWTO/GTERC Asia tourism trends - 2020
edition. UNWTO. https://doi.org/10.18111/9789284422258
Górska, A., Dobija, D., Grossi, G., & Staniszewska, Z. (2022). Getting through COVID-19 together:
Understanding local governments' social media communication. Cities, 121, 103453.
https://doi.org/10.1016/j.cities.2021.103453
Gretzel, U., Fuchs, M., Baggio, R., Hoepken, W., Law, R., Neidhardt, J., Pesonen, J., Zanker, M., &
Xiang, Z. (2020). e-Tourism beyond COVID-19: A call for transformative research. Inf.
Technol. Tour, 22, 187-203. https://doi.org/10.1007/s40558-020-00181-3
Hang, H., Aroean, L., & Chen, Z. (2020). Building emotional attaching during COVID-19. Annals of
tourism research, 83, 103006. https://doi.org/10.1016/j.annals.2020.103006
Hantrais, L., Allin, P., Kritikos, M., Sogomonjan, M., Anand, P., Livingstone, S., Williams, M., &
Innes, M. (2020). COVID-19 and the digital revolution. Contemporary Social Sciences, 16(2),
256-270. https://doi.org/10.1080/21582041.2020.1833234
Received: 14/07/2022. Accepted: 19/09/2022. Published: 02/01/2023. 102RLCS, Revista Latina de Comunicación Social, 81, 81-108
[Research] https://www.doi.org/10.4185/RLCS-2023-1845 | ISSN 1138-5820 | Year 2023
Heeley, J. (2015). Urban destination marketing in contemporary Europe – what does ‘good’ look like?
International Journal of Tourism Cities, 1(1), 36-49. https://bit.ly/3SuI5Rb
Hjarvard, S. (2017). The Mediatization of Society. Nordicom Review, 29(2) 102-131.
https://doi.org/10.1515/nor-2017-0181
Hospers, G. (2010). Making sense of place: from cold to warm city marketing. Journal of Place
Management and Development, 3(3), 182-193. https://doi.org/10.1108/17538331011083925
Kavaratzis, M. (2005). Place branding: a review of trends and conceptual models. The Marketing
Review, 5(4), 329-342. https://doi.org/10.1362/146934705775186854
Kavaratzis, M., & Kalandides, A. (2015). Rethinking the place brand: The interactive formation of
place brands and the role of participatory place branding. Environment and Planning A:
Economy and Space, 47(6), 1368-1382. https://doi.org/10.1177/0308518X15594918
Keller, K. L., & Richey, K. (2006). The importance of corporate Brand personality traits to a successful
21st century business. Journal of Brand Management, 14, 74-81.
https://doi.org/10.1057/palgrave.bm.2550055
Kentikelenis, A. E., & Seabrooke, L. (2022). Governing and Measuring Health Security: The Global
Push for Pandemic Preparedness Indicators. Global Policy, 13(4) https://bit.ly/3SB5a4Q
Keshky, E., El Sayed, M., Basyouni, S. S., & Al Sabban, A. M. (2020). Getting through COVID-19:
The pandemic’s impact on the psychology of sustainability, quality of life, and the global
economy-A systematic review. Frontiers in Psychology, 11, 3188.
https://doi.org/10.3389/fpsyg.2020.585897
Kim, H., Rossi, R., Sarma, A., Moritz, D., & Hullman, J. (2021). An automated approach to reasoning
about task-oriented insights in responsive visualization. IEEE transactions on visualization and
computer graphics, 28(1), 129-139. https://doi.org/10.1109/TVCG.2021.3114782
Kola, L., Kohrt, B. A., Hanlon, C., Naslund, J. A., Sikander, S., Balaji, M., ... Patel, V. (2021). COVID-
19 mental health impact and responses in low-income and middle-income countries:
reimagining global mental health. The Lancet Psychiatry, 8(6), 535-550.
https://doi.org/10.1016/S2215-0366(21)00025-0
Kumar, A., & Nayar, K. R. (2020). COVID 19 and its mental health consequences. Journal of Mental
Health, 30(1), 1-2. https://doi.org/10.1080/09638237.2020.1757052
Mansilla, J. A., & Milano, C. (2019). Becoming Centre: tourism placemaking and space production in
two neighborhoods in Barcelona. Tourism Geographies.
https://doi.org/10.1080/14616688.2019.1571097
McCartney, G., Pinto, J., & Liu, M. (2021). City resilience and recovery from COVID-19: The case
of Macao. Cities, 112, 103-130. https://doi.org.10.1016/j.cities.2021.103130
McKibbin, W. J., & Fernando, R. (2020). The global macroeconomic impacts of COVID- 19: Seven
scenarios. SSRN, 19. https://doi.org/10.2139/ssrn.3547729
Received: 14/07/2022. Accepted: 19/09/2022. Published: 02/01/2023. 103RLCS, Revista Latina de Comunicación Social, 81, 81-108
[Research] https://www.doi.org/10.4185/RLCS-2023-1845 | ISSN 1138-5820 | Year 2023
Meagher, K., Achi, N., Bowsher, G., Ekzayez, A., & Patel, P. (2021). Exploring the role of City
Networks in supporting urban resilience to COVID-19 in conflict-affected settings. Open
Health, 2(1), 2021, 1-20. https://doi.org/10.1515/openhe-2021-0001
Nathaniel, S. P, & Adedoyin, F. F. (2020). Tourism development, natural resource abundance, and
environmental sustainability: Another look at the ten most visited destinations. J Public
Affairs, 22, e2553. https://doi.org/10.1002/pa.2553
Novy, J. & Colomb, C. (2019). Urban tourism as a source of contention and social mobilisations: A
critical review. Tourism Planning & Development, 16(4), 358-375.
https://doi.org/10.1080/21568316.2019.1577293
Parlakkiliç, A. (2022). Evaluating the effects of responsive design on the usability of academic
websites in the pandemic. Education and Information Technologies, 27(1), 1307-1322.
https://doi.org/10.1007/s10639-021-10650-9
Pasquinelli, C., Trunfio, M., Bellini, N. & Rossi, S. (2021). Sustainability in Overtouristified Cities?
A Social Media Insight into Italian Branding Responses to COVID-19 Crisis. Sustainability,
13(4), 1848. https://doi.org/10.3390/su13041848
Pearce, D. G. (2015). Urban management, destination management and urban destination
management: a comparative review with issues and examples from New Zealand. International
Journal of Tourism Cities, 1(1), 1-17. https://doi.org/10.1108/ijtc-08-2014-0002
Perakakis, E., & Ghinea, G. (2017). Smart enough for the web? A responsive web design approach to
enhancing the user web browsing experience on smart TVs. IEEE Transactions on Human-
Machine Systems, 47(6), 860-872. https://doi.org/10.1109/THMS.2017.2726821
Pérez-Tornero, J. M. (2020). La Gran Mediatización I: El tsunami que expropia nuestras vidas. UOC
Press.
Prime, H., Wade, M., & Browne, D. T. (2020). Risk and resilience in family well-being during the
COVID-19 pandemic. American Psychologist, 75(5), 631.
https://doi.org/10.1037/amp0000660
Qi, J. (2021). Beijing as Smart City: Promotion of International Communication Center. Philosophy
Study, 11(2), 143-148. https://doi.org/10.17265/2159-5313/2021.02.008
Qiu, R., Park, J., Li, S., & Song, H. (2020) Social costs of tourism during the COVID-19 pandemic.
Annals of tourism research, 84, 102994. https://doi.org/10.1016/j.annals.2020.102994
Qu, H., Kim, L. H., & Im, H. H. (2011). A model of destination branding: Integrating the concepts of
the branding and destination image. Tourism Management, 32(3), 465-476.
https://doi.org/10.1016/j.tourman.2010.03.014
Rawaf, S., Yamamoto, H. Q., & Rawaf, D. (2020). Unlocking towns and cities: COVID-19 exit
strategy. Eastern Mediterranean Health Journal, 26(5), 499-502.
https://doi.org/10.26719/emhj.20.028
Received: 14/07/2022. Accepted: 19/09/2022. Published: 02/01/2023. 104You can also read