Diel cycle of sea spray aerosol concentration over vast areas of the tropical Pacic Ocean and the Caribbean Sea
←
→
Page content transcription
If your browser does not render page correctly, please read the page content below
Diel cycle of sea spray aerosol concentration over
vast areas of the tropical Paci c Ocean and the
Caribbean Sea
J. Michel Flores ( ores@weizmann.ac.il )
Weizmann Institute of Science https://orcid.org/0000-0003-3609-286X
Guillaume Bourdin
University of Maine
Alexander Kostinski
Michigan Technological University https://orcid.org/0000-0003-1033-615X
Orit Altaratz
Weizmann Institute of Science
Guy Dagan
Atmospheric, Oceanic and Planetary Physics, Department of Physics, University of Oxford
Fabien Lombard
Sorbonne Université https://orcid.org/0000-0002-8626-8782
Nils Haëntjens
School of Marine Sciences, University of Maine
Emmanuel Boss
University of Maine
Matthew Sullivan
The Ohio State University
Gabriel Gorsky
Observatoire Océanologique de Villefranche
Naama Lang-Yona
Weizmann Institute of Science https://orcid.org/0000-0002-2650-2127
Miri Trainic
Weizmann Institute of Science
Sarah Romac
CNRS, Station Biologique de Roscoff https://orcid.org/0000-0003-3785-6972
Christian Voolstra
University of Konstanz https://orcid.org/0000-0003-4555-3795
Yinon Rudich
Weizmann Institute of Science https://orcid.org/0000-0003-3149-0201
Assaf Vardi
Page 1/25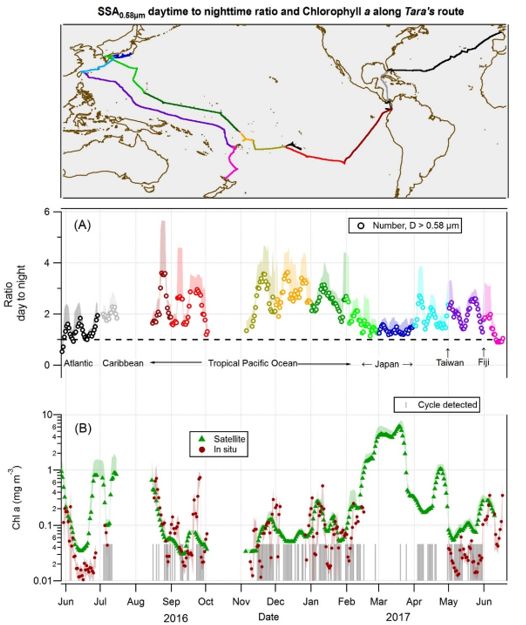
Weizmann Institute of Science https://orcid.org/0000-0002-7079-0234
Ilan Koren
Weizmann Institute of Science https://orcid.org/0000-0001-6759-6265
Article
Keywords: Sea Spray Aerosol, Diel Cycle, Bubble-bursting Dynamics
DOI: https://doi.org/10.21203/rs.3.rs-74373/v1
License: This work is licensed under a Creative Commons Attribution 4.0 International License.
Read Full License
Page 2/25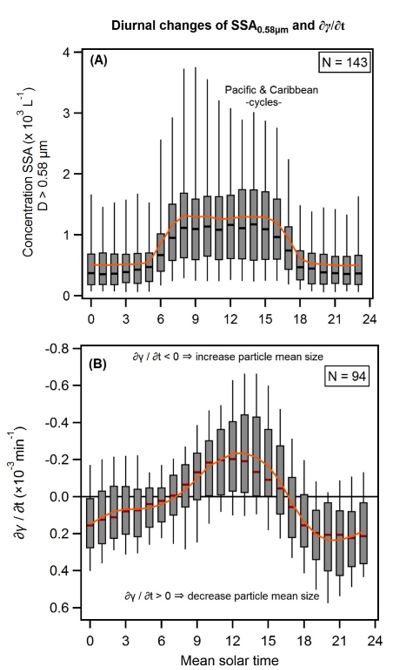
Abstract
Ocean-atmosphere interactions such as sea spray aerosol (SSA) formation have a major role in the
climate system, but a global-scale assessment of this micro-scale process is highly challenging. We
measured high-resolution temporal patterns of SSA number concentration over the Atlantic Ocean,
Caribbean Sea, and the Paci c Ocean covering 42,000 km of open ocean waters. We discovered a
ubiquitous 24-hour rhythm to the number concentration, clearly seen for particle diameters > ~ 0.58 µm,
with spikes at dawn and drops at dusk throughout the Paci c Ocean and Caribbean Sea, showing more
than doubling of the SSA number concentration during the day than at night. No correlation with surface
winds, atmospheric radiation, pollution nor oceanic physical properties were found. Instead, parallel diel
patterns in particle sizes detected in near-surface waters, attributed to variations in the size of particles
smaller than ~ 1 µm, point to microbial day-to-night modulation of bubble-bursting dynamics as the
cause of the SSA cycle.

Main Text
Sea spray aerosols (SSA), generated at the ocean surface by wind-driven processes, have a major effect
on climate as they impact atmospheric chemistry, Earth’s radiative balance, cloud formation and rain
properties 1–5. As ocean waves break, SSA form when bubbles burst and create lm and jet droplets 6. At
strong winds (above ~9 m s-1), spume drops 7 can be torn off the wave crest. SSA production depends on
the physical8 and chemical9,10 properties of the ocean surface as these, together with wind stress,
determine the bubble’s bursting dynamics and, therefore, the quantity, size, and composition of the
emitted drops. The emitted drops’ transport, in turn, depends on the atmospheric marine boundary layer
(AMBL) conditions such as the wind, pro les of relative humidity (RH) and temperature, instability, and
rain1. Understanding the processes that control SSA ux into the atmosphere are essential to better
understand the climate system, weather, and accurate ocean-atmosphere models. Yet, these are not well
understood2, daily patterns, for example, have been only explored with arti cial bubbling10,11, and global-
scale coverage is generally restricted to remote sensing daytime measurements.

In this study, we quanti ed and explored diurnal patterns of the number concentration of SSA (NSSA) in
high spatial and temporal resolution along 42,000 km over the Atlantic Ocean, Caribbean Sea, and Paci c
Oceans, measured aboard the schooner Tara during the Tara Paci c Expedition 12–14. Aerosol size
distributions (for optical diameters of 0.25 – 32 µm at RH
majority of the route. We discuss the origin of the aerosols and their approximate chemical signature; (ii)
we explore how atmospheric and oceanic environmental factors affect NSSA_0.58µm and show they are not
responsible for the diel cycle; (iii) we show that the identi ed NSSA_0.58µm diel cycles were accompanied by
parallel diel patterns of the size of seawater particles; and (iv) we hypothesize that microbial processes at
the ocean surface that in uence bubble-bursting dynamics are the most probable cause of the observed
diel cycle in aerosol number concentration.

Diel pattern in SSA number concentration

We explored temporal patterns of the number concentration of SSA (NSSA) and found a distinct 24-hour
pattern in NSSA, clearly seen for particles with optical diameters above ~0.58 µm (NSSA_0.58µm ; Fig. 1 and
see Fig. S1 for the diameter determination). We also found day-to-night ratios of NSSA_0.58µm > 1 on the
vast majority of the route (Fig. 1 and Fig. 2), with an average ratio of 2.3 (±0.6) over the tropical Paci c
Ocean.

The diel NSSA_0.58µm changes follow a de nite pattern: from midnight to dawn the NSSA_0.58μm is stable, it
begins rising ~06:00 MST (mean solar time; all data was converted from UTC to MST, see Methods),
within 30 min after sunrise and begins returning to pre-dawn values at ~17:00 MST, with 18:00 MST
NSSA_0.58µm remaining stable overnight. Out of a total of 268 days of measurements, clear NSSA_0.58µm
diel cycles (see Methods for the de nition) were detected in 143 days, predominantly in the pristine
Paci c Ocean and the Caribbean Sea (Fig. 2 and Fig. S2). These cycles had average night (19:00 to 05:00
MST) and day (from 07:00 to 17:00 MST) NSSA_0.58µm values of 515 (±16) L-1 and 1282 (±34) L-1,
respectively (Fig. 3A). The hours from 05:00 to 07:00 and from 17:00 to 19:00 were excluded to avoid
strong uctuations of the ratio. The NSSA_0.58µm diel cycles were identi ed both while sailing in
oligotrophic waters in the open ocean (Fig. 1A) and in island stopovers near coral reefs (Fig. S2 and Fig.
S3), suggesting that islands (and Tara’s) daily processes do not interfere with the cycles (see
Supplementary information S1).

The 58 days where no de nite diel cycle was readily apparent (using the strict de nition; see Methods for
details) in the Paci c Ocean (Fig. S2), still showed higher average daily concentration (784 ±56 L-1)
compared to the night values (606 ±49 L-1; see Fig. S2A). The NSSA_0.58µm diel cycle was not detected in
the 23 days across the Atlantic Ocean (with 4518(±776) L-1 in the daytime and 4553 (±357) L-1 at night;
Fig. S2B), nor in the 9 day leg from Fiji to New Zealand (with 4518 (±776) L-1 in the daytime and 4553
(±357) L-1 at nighttime; Fig. S2D). Around Japan the cycle was identi ed only for a few days (Fig. S2C).
However, high aerosol concentrations are likely to obscure the diel cycle in those regions. The Atlantic
Ocean has generally higher background aerosol concentration

                                                   Page 4/25
due to high mineral dust load (2,11,15) and the regions near Japan and New Zealand were highly polluted
(11). And, we also found an inverse relationship between the day-to-night ratio of the NSSA_0.58µm and the
background aerosol concentration (taken as the nighttime concentration; see Fig. S4).
We determined the measured SSA to be of marine origin based on back trajectory analysis and scanning
electron microscopy. The calculated back trajectories (using HYSPLIT 16,17) proved that the vast majority
of the air masses spent at least 48 hours over the ocean (Fig. 1). In addition, for the period where clear
NSSA_0.58µm diel patterns are seen in the western Paci c (Fig. 1A), we obtained an approximate chemical
signature of aerosols collected on lters with average D > 0.58 μm. We used SEM-EDX analysis and a
similar particle classi cation scheme as described in Laskin et al. 18 (Fig. 1B; a total of 15.5 days were
analyzed between 3 – 17 May, 2017, but for clarity only 11 days are shown. See Table S1 for the other
days and Methods for the classi cation scheme). We found sea salt particles comprised between 50 –
100% of the total particles by number. Up to 1000 km (May 9) away from Keelung, Taiwan, we found a
noticeable depletion of chloride (Fig. S5), together with a lower sea salt fraction (50 – 82%) and an
increase in the presence of other metals (e.g., Al, Si, K, Ca, S) and sulfate. The chlorine depletion and the
increase in sulfates suggests that anthropogenic pollutants (e.g., H2SO4, SO2) were present in the AMBL,
as SSA are known to react with them (15). After this period, the sea salt fraction comprised 84-100% of
the total particles by number. Sulfates with no sodium and “Other” species were < 3% for the whole
period. The NSSA_0.58µm diel cycles were also revealed in the lter counts; we counted a total of 4560
particles in 14 daytime lters and 3706 particles in 15 nighttime lters (see Table S1). We have not,
however, observed signi cant day-to-night aerosol-class differences.
Atmospheric and oceanic environmental factors
The size distribution and number concentration of the bubbles and SSA created by a breaking wave are
controlled mainly by the wind speed 1. We found the NSSA_0.58µm increases with wind speed for both the
Paci c and Atlantic Oceans (Fig. 3A and 3B), consistent with previous studies1,2. However, the pristine
Paci c Ocean daytime NSSA_0.58µm consistently exceeded the night ones, compared at similar wind
speeds (Fig. 3A). Further, wind speed anomalies, for the days the diel cycles were detected, showed no
clear diurnal pattern (see Fig. S6). This suggests that the wind is a key player in the process of marine
aerosol emission but it doesn’t cause the observed diel cycles. Other atmospheric and oceanic
environmental factors are known to affect the production and number of SSA, but we found no evidence
that they drive the observed NSSA_0.58µm diel cycle. Links between the RH, air temperature, and
atmospheric stability to the NSSA_0.58µm diel cycle were explored (see details in the Methods and Fig. S6,
Fig. S7, and Fig. S8), and were ruled out as the causes of the NSSA_0.58µm diel pattern. Rain was shown to
suppress the NSSA_0.58µm cycle (Fig. 1A). No link between the intensity of photosynthetically active
radiation and the daytime NSSA_0.58µm was found (Fig. S9). We also discarded secondary organic aerosol
production as the cause of the diel cycle since the produced aerosol by this mechanism is much smaller
in diameter (< 0.1 µm). Nor could we nd any signi cant link between physical changes within the AMBL
Page 5/25and the NSSA_0.58µm cycle. While there is a diurnal signal in the AMBL height, it has less than 30%
variations 19 and it cannot account for the variations we see in NSSA_0.58µm .
Within the ocean surface, changes in salinity and sea surface temperature (SST) can also affect SSA
production 20. However, salinity in the tropics has typical diurnal anomalies of only 0.005 psu 21, and we
did not nd strong diurnal salinity changes (Fig. S10). As for SST, even though diurnal variations are
known 22, the rate of temperature change is much weaker and can be observed later in the day (22 and
Fig. S10) compared to the observed increase in NSSA_0.58µm . Additionally, we observed the NSSA_0.58µm
cycle in conditions of wind speeds above 10 m s-1 (Fig. 1A and Fig. S8), where SST diurnal changes are
expected to be less than 0.25 K 22, and in morning overcast conditions (Fig. S8B) when no signi cant
changes in SST are expected. Therefore, we can conclude that neither salinity nor SST cause the
NSSA_0.58µm cycles.
These ndings suggest that neither atmospheric nor oceanic environmental factors can explain the
NSSA_0.58µm diel cycle, and while the wind speed affects the NSSA_0.58µm , it does not drive the observed diel
cycles. Furthermore, the presence of the NSSA_0.58μm diel cycle in the presence of anthropogenic pollutants
and in clean conditions (Fig. 1A,B and Fig. S5), implies anthropogenic and continental sources are also
not the cause. This suggests that the diel cycle may be triggered by changes in the ocean surface itself.
Diel patterns in the size of seawater particles
The identi ed NSSA_0.58µm diel cycles in the lower atmosphere were accompanied by distinct diel cycles in
the measurements of near-surface ocean light attenuation wavelength dependence of cp (expressed as
particle size index γ; Fig. 1C). The index is found via a power-law t to the wavelength-dependent cp 23,24:
−γ
λ
cp = cp (λ0 ) ( ) (1)
λ0
where cp(λ0) is cp at a reference wavelength λ0 and γ is the spectral slope of cp. Variability of γ indicates
changes in the median particle size and is most sensitive to particles in the range of 0.22 – 20 µm 23,25,
with smaller γ associated with larger median particle size (similar to the Ångström exponent for
aerosols). Figure 1C shows that the NSSA_0.58μm diel cycle correlates well with the values of γ. Note that γ
reached a maximum value (i.e., minimum mean diameter) right after sunrise when the NSSA_0.58μm began
to increase, and a minimum value (i.e., maximum mean diameter) before sunset when NSSA_0.58μm were
decreasing (Fig. 1C). We, therefore, calculated the rate of change of γ (∂γ/∂t (hr-1); see Methods) for
concurrent days (92 days in total) where a NSSA_0.58μm diel cycle was also detected (Fig. 4A,B). We found
a parallel behavior, with a continuous decrease in the mean particle diameter at nighttime (∂γ/∂t (hr-1) >
0) when NSSA_0.58μm were lowest, and a continuous increase (∂γ/∂t (hr-1) < 0) between 07:00 and 17:00,
Page 6/25when NSSA_0.58μm were highest. In the Paci c Ocean, where the NSSA_0.58μm diel cycles occurred, most γ
values were above 0.8 (Fig. S11A) reaching 1.4 and having a strong latitudinal dependence (Fig. S11B).
In the Fiji to New Zealand leg, γ values were around 1.0, but no cycle was detected (Fig. S11C). In the
Atlantic Ocean, though there were diel cycles in γ (Fig. S11A), its values were below 0.8, indicating a larger
mean particle size and thereby suggesting the presence of larger planktonic species than in the Paci c
Ocean.
Similar diel cycles of γ in the open ocean have been previously documented in 24–26. Changes in γ can be
attributed to several factors: cell growth, division, and aggregation, selective changes in particle size or
concentration due to a balance between primary production and loss due to grazing and viral pressure, or
changes in the refractive index of the cell population, which is related to their carbon content. In the
Equatorial Paci c such changes were attributed primarily to phytoplankton growth and division 27. During
daytime cells photosynthesize, x inorganic carbon and accumulate carbohydrates and lipids which are
respired during the night 28, subsequently cells will generally divide. We found the daytime increase is
associated with cell growth or aggregation of pico-phytoplanktonic populations, as the γ changes
measured during NSSA_0.58μm diel cycles (in the western Paci c) can be attributed to variations in size of
particles smaller than ~1 µm (see Methods and Fig. S12), and we also see a daily increase in particulate
organic carbon (Fig. S10A). The decrease in mean size at night can be due to selective grazing, cell
division or virus-induced lysis 29,30.
Mechanism hypothesis
Areas with high chl-a concentrations showed the lowest day-to-night NSSA_0.58µm ratios, and the
NSSA_0.58µm diel cycles were mainly observed in areas with low chl-a (Fig. 2). These oceanic oligotrophic
regions are typically dominated by cyanobacteria 31,32.
During photosynthesis eukaryotic phytoplankton and cyanobacteria can secrete extracellular polymeric
substances (EPS). EPS are a diverse array of large molecules which forms a major component of the
dissolved organic carbon pool in the ocean, and have been implicated in the formation of bio lms and
marine snow 33. Recently, in a different context, EPS released by bacteria were observed to increase
bubble lifetime, thereby dramatically decreasing their lm thickness, and yielding more numerous and
transportable droplets at burst than those produced by clean bubbles (see Fig. 1 in 34). These new
ndings are essential as SSA formation is directly related to lm drops formed by the fragmentation of
the thin uid cap lm 35.
Consequently, we conjecture that the diel changes in the NSSA_0.58μm are controlled by microbial
processes in the ocean surface. Such processes whether at the near-surface water-AMBL interface, or in
the upper several meters of the ocean through bubble scavenging of the excreted EPS from bacteria, may
affect bubble bursting dynamics, changing the number and size of the emitted droplets and therefore
Page 7/25NSSA_0.58µm . The AMBL typically mixes within an hour. A characteristic time is in the order of 20 min for a
500 m AMBL (1). Hence, signi cant changes in the production of droplets can be expected to happen
within a similar timeframe in which we observed the transient increase of NSSA_0.58µm . Although we do
not pinpoint a direct role of marine bacteria affecting bubble-bursting dynamics in the open ocean
surface, recent studies have shown a possible role for bacteria modulating ocean surface properties
33,36–39 and bubble-bursting dynamics 34,40,41.
We presented in-situ evidence that the number concentration of SSA with optical diameter D >~ 0.58μm
(at RH < 40%) have distinct 24-hour cycles over oligotrophic waters, with an average of 2.3 ±0.6 times
higher number concentrations during daytime than at night. Our results show inverse correlation between
the ambient aerosol concentration and the magnitude of the observed cycle, suggesting that over areas
with high aerosol concentration (e.g., with a strong contribution from long range transport of continental
aerosol) the cycle is present but masked. Additionally, the gradual emergence of the diel cycle for larger
diameters (Fig. S1) suggests that the longer lifetimes of smaller aerosols (the lifetime of aerosols is
inversely proportional to their size) also contributes to masking the cycle, particularly for the small sizes.
While it is known that SSA formation originates from the interaction of wind and waves, with bulk
oceanic properties (i.e., SST, salinity, chl-a) affecting it (2), here we show that there is a concomitant daily
mechanism that modulates aerosol concentration in a 24-hour rhythm. While we do not provide (or
possess) direct measurements of near-surface water microbial processes, the parallel increase of the
mean particle size within the ocean surface during the day, driven by photosynthetic growth and secretion
of extracellular polymeric substances, points towards a possible link between microbial processes at the
ocean surface and the NSSA_0.58µm cycle.
The discovery of the diel cycle in NSSA_0.58µm opens many new questions for future studies to elucidate
the mechanism underlining this phenomenon and the direct impact of marine biological processes on the
physical properties of the surface ocean, and the link to aerosol uxes and properties. Moreover, on a
larger scale, the connection to cloud and rain properties and consequently energy uxes and climate.
Methods
Schooner Tara
Measurements were conducted aboard the R/V Tara during the rst year of the Tara Paci c expedition
12–14
. The R/V Tara is a 36 m long, 10 m wide aluminum hull schooner with two 27 m long masts,
equipped with a meteorological station (Station Bathos II, Météo France) measuring air temperature,
relative humidity, and pressure. The station is located on the stern around 7 m above sea level, the wind
speed and direction are measured at the top of the mast, ~27m above sea level (asl), and a thermo-
salinometer (Sea-Bird Electronics SBE45 MicroTSG) measures sea surface temperature (SST) and
salinity with its main water entrance located about 0.5-3m under the sea surface (depending on ocean
Page 8/25conditions). The intensity of Photosynthetically Active Radiation (PAR; wavelengths between 400 and 700
nm) was measured next to the meteorological station by a QCR-2150 (Biospherical Instruments Inc.). The
meteorological station recorded frequencies are listed in Table S2. The SST and salinity were measured
at 0.1 Hz and processed to 1 min averages. The PAR is analyzed to 1 min average of 1 Hz
measurements.
Continuous aerosol instrumentation and inlet
A detailed description of the aerosol instrumentation during the expedition can be found in Flores et al.
2020 14. In short, an optical particle counter (OPC; EDM-180 GRIMM Aerosol Technik Ainring GmbH & Co.
KG, Ainring, Germany), for continuous aerosol size distribution measurements (from 0.25 – 32 µm, sorted
into 31 bins), and a custom-made aerosol lter system consisting of four 47mm lter holders and one
vacuum pump (Diaphragm pump ME 16 NT, VACUUBRAND BmbH & Co KG, Wertheim, Germany) were
installed aboard R/V Tara. Two separate inlets, located next to each other, were constructed out of
conductive tubing of 1.9 cm inner diameter and a funnel (allowing the collection of all diameters) and
mounted on the rear backstay of Tara. For the Atlantic Ocean measurements, from Lorient, France to
Miami, U.S.A., the inlet was installed half way up the backstay (~15m asl) and after Miami, the inlet was
relocated to the top of the backstay (~27m asl).
The OPC measures single particles at 683 nm and it was calibrated at the refractive index of polystyrene
latex spheres. It collects the scattered light using a wide-angle collector optic at a mean scattering angle
of 90°; the optical design smoothes out Mie scattering resonances and reduces the sensitivity to particle
shape. A Na on dryer was installed before the OPC, which reduced the sampled air relative humidity to
below 40 %14. The ow through the OPC was 1.2 liters per minute and it produced a particle size
distribution every 60 seconds.
The lters from the custom-made system were changed, in general, twice a day, collecting aerosols for
periods of at least 12 hours. The lter holder for the analysis presented here contained 0.8 µm
polycarbonate lters (ATTP04700, Millipore) that were stored at room temperature in PetriSlide dishes
preloaded with absorbent pads (Millipore, PDMA04700) to keep the lters dry while stored. The ow
through the lter was 30 litter per minute for the lters analyzed here.
Continuous water measurements
The R/V Tara was equipped with an ocean surface ow-through autonomous sampling system, similar to
the one installed during the Tara Oceans Expeditions, to measure sea surface physical and bio-optical
properties as described in 15. The inline system consisted of a Sea-Bird Electronics SBE45 MicroTSG for
measurements of sea surface temperature (SST) and salinity and an AC-S spectrophotometer (WET Labs,
Page 9/25Inc.) measuring hyperspectral particulate absorption (ap) and particulate attenuation (cp) with a ~4 nm
resolution, and an ECO-BB3 (WetLabs Inc.) set in a BB-box of ~4.5 L measuring particulate
backscattering at three wavelength (470 nm, 532 nm and 650 nm), altogether mounted in an
autonomous setup described in Dall’Olmo et al. 42 and Slade et al. 26. The size range of the measured
particles is > 0.2 µm, but contribution of particles > 20 µm is assumed negligible. Particulate Organic
Carbon (POC) concentrations were computed from cp 43 and chlorophyll-a concentrations were estimated
from the particulate absorption line height 15. Additionally, a particle size index (γ), an estimate of the
mean particle size in the ocean near-surface waters, was calculated using the wavelength-dependency of
cp and that its spectral shape can be approximated as a power law (see main text).
Air mass back trajectory analysis
The presented 48 hours back trajectories in Fig. 1 were calculated using the NOAA’s HYSPLIT
atmospheric transport and dispersion model 16,17. They represent the average trajectories of the
‘Ensemble option’ that were calculated based on an endpoint at 250 m height. We chose the ‘Ensemble
option’ to have a better representation of where the air masses were coming from. We did not use a lower
starting height as the minimum height for the optimal con guration of the ensemble is 250 m.
Diameter determination of the diurnal cycle
To obtain an estimation for the minimal diameter impacted by the changes in the diurnal emission, we
analyzed each bin from the OPC. We took the data only in the Paci c Ocean and when Tara was at least
100 km away from land (islands included). The OPC has 31 bins for measurements between 0.25 to 32
µm, in Fig. S1 we show the box plot analyses for 16 bins from the OPC, up to 3.0 µm. Fig. S1 shows there
is no diurnal difference for the diameters below 0.58 µm, whereas, for larger diameters the cycle is clear.
However, there is an exponential decrease in concentration from the smaller diameter channels to the
0.58-0.65μm channel, suggesting the diel cycle might be masked in the smaller diameters due to higher
concentrations.
De nition of the diel cycle
First, all the data was converted to mean solar time (MST) using the equation:
1
M ST = U T C + Lon
360
Page 10/25where UTC is the Coordinated universal time, and Lon is the longitude in degrees (west < 0, east > 0).
MST assumes there is no day to day variation in the UTC of solar noon at a location, and for our dataset
it is a good assumption, mainly since the majority of measurements were taken along the tropics.
Each 24 h period was analyzed independently. For a day to be considered to have a diel cycle an increase
in concentration had to be observed between 06:00 and 07:00 and a decrease after 17:00, with a greater
NSSA_0.58µm observed during daytime (see above for the diameter determination) during daytime. For this,
we divided the day into four periods, from 00:00 to 05:00 (dawn), 07:00 to 11:59 (morning), 12:00 to
17:00 (afternoon) and from 19:00 to 23:59 (night). The counts (per xed liter volume) measured by the
particle counter can be assumed to follow a Poisson distribution, therefore their standard deviation is ,
where µ is the mean. Hence, for a day to be considered to have a diel cycle the two following conditions
had to be met:
µmorning > µdawn+ σdawn and µnight < µafternoon – σafternoon
Figure S2 shows the places where the diel cycle was detected using this de nition.
Chlorophyll-a along Tara’s route
The chlorophyll-a concentration along Tara’s route was calculated using the AC-S 15 and to approximate
the chl-a concentrations when the AC-S was not functioning, we used the level 3 SNPP-VIIRS satellite
monthly data maps. For each month, we used Tara’s hourly location to rst extract a 0.2 x 0.2 degree area
for each point, then this area was averaged to get a corresponding chl-a concentration at each point.
Finally, a 24-hour average was taken along Tara’s route. Figure 2B shows the satellite calculated chl-a
concentration, and the in situ chl-a inferred from AC-S measurements.
Daytime and nighttime SSA0.58μm concentration vs Wind speed
In order to understand the role of wind speed in the NSSA_0.58µm cycle, we separated the Paci c data (for
days when a cycle was detected) into daytime (07:00 – 17:00) and nighttime (19:00 – 05:00) periods,
and binned the total aerosol counts of D > 0.58µm into 2 m s-1 bins (Fig. 3a; data within 100 km from
continental coasts and Japan was not used to avoid pollution artifacts). There were between 3612 to
23136 events per bin used. The Atlantic Ocean data was binned into 4 m s-1 bins for comparison. There
were between 949 to 5056 events per bin used.
Page 11/25Rate of change of γ (∂γ/∂t)
As mentioned above, γ is an indicator of the size distribution among particles (< 20µm in diameter) in the
ocean surface. From Fig. 1 we see γ decrease at daytime (i.e. the sizes of the plankton increase) and
increase over nighttime. To quantify the intensity and timing of this change over a full day, we calculated
the rate of change of γ. First, to ll in data gaps that correspond to periods when the AC-S was measuring
ltered seawater for calibration purposes (normally shorter than 30 minutes), we did a linear
interpolation. Data gaps larger than 30 minutes were not interpolated. Then, each continuous segment
was smoothed applying a low-pass digital lter with a pass band frequency of 18 hours. Then the rate of
change ∂γ/∂t (hr-1) was calculated. Finally, Fig. 4B shows a box plot analysis of the days where a
NSSA_0.58µm diel cycle was found and there was at least 23 hours of the AC-S data.
Diurnal cycle near Niue Island when Tara was anchored
Similar to Fig. 1 in the main text, a diel cycle of NSSA_0.58µm was detected while Tara was anchored near
Niue Island (19°03′14″S 169°55′12″W). Figure S3 shows a diurnal cycle of γ, increasing during nighttime
(smaller particle mean diameter) and decreasing during daytime (bigger particle mean diameter).
Box plot analysis for three different legs
Similar to the analysis shown in Fig. 3, we performed box plot analysis for the days the cycle was not
detected in the Paci c Ocean (Fig. S4A), for the Atlantic Ocean transect (Fig. S4B), for the tour around
Japan (Fig. S4C), and for the Fiji – New Zealand leg (Fig. S4D). In the Atlantic Ocean average counts of
4518 (±776) L-1 in the daytime and 4553 (±357) L-1 at nighttime were measured. For the Fiji – New
Zealand leg average counts of 1388 (±352) L-1 during daytime and 1352 (±85) L-1 at nighttime were
measured.
Day to nighttime ratio vs. aerosol concentration
To explore the relationship between the diel cycles and the aerosol concentration, we quanti ed the day to
nighttime concentration ratio for D > 0.58 μm vs. the total (using all the bins from the OPC) nighttime
aerosol concentration. For this purpose, after converting the data to mean solar time and taking every 24-
hour period as independent, we rst averaged the total nighttime concentration (from 19:00 to 05:00),
next we took a 5-day running average, and nally the data was binned into equally number bins from low
to high concentration. A 5-day running average was also taken for the day to nighttime ratio. Figure S4
Page 12/25shows the inverse relationship between the day to nighttime concentration ratio and the aerosol loading.
The analysis was also done using the daytime and a 24hr concentration average, no signi cant
difference was found.
Scanning electron microscope with Energy disperse X-ray analysis
Using Scanning Electron Microscopy with energy-disperse X-ray analysis (SEM-EDX) and a similar
particle classi cation scheme as described in Laskin et al. (2012)18, we classi ed each particle into one
of ve major classes of aerosols: i) Sea salt: [Na] greater than all other elements detected (except Cl); ii)
Metals with Na: [Na] present but [Na] < [Al, Si, K, Ca, S]; iii) Sulfate/SeaSalt: [Na] > [Al, Si, K, Ca] but [Na] <
[S]; iv) Sulfates: [Na]=0 and [S]>0; and v) Other: all remaining particles.
To perform the SEM-EDS analysis, we used a Zeiss Sigma500 SEM with a Bruker XFlash®-6|60 Quantax
EDS detector, and the Bruker ESPRIT feature software package for automatic particle detection and
chemical classi cation in EDS.
The SEM was set at a working distance of about 7.5mm (±0.1), an accelerating voltage of 8.0kV, an
aperture size of 60μm, and a magni cation of 2000. The backscatter detector was used to acquire the
images. For each lter four images, covering a total of 2471 μm2 surface area, were taken and each
particle above a minimum area of 0.08 μm2 was counted and an EDS spectrum acquired. After the
acquisition of the images and EDS spectra, we took only the particles that had an average diameter
greater than 0.58 μm and for each of their corresponding EDS spectra, the method described in 44 was
used to calculate the mass percent of each detected element. We excluded C from the mass percent
calculation since the lters were made of polycarbonate. Following the mass calculation, particles
containing sodium above 0.01 mass percent ([Na] > 0) were rst separated from those without sodium.
The Na containing particles with more sodium than any other detected element (besides Cl) were denoted
“Sea-salt”. The rest of Na containing particles were subdivided into two classes: “Metals with Na” if [Na] <
[Al], [Ca], [K], [Si], and mixed “SeaSalt/Sulfate” – if [Na] > [Al], [Ca], [K], [Si] [Na] but [Na] < [S]. The sodium-
free particles were assigned to two classes: “Sulfate” if [S] > 0 and “Other” for the remaining particles. A
total of 14339 particles, where 8266 had average D ≥ 0.58 μm, were analyzed. In the 14 daytime lters
(for the period between 4 May and 17 May, 2017; see Table S1) we counted a total of 7247 particles and
4560 with D ≥ 0.58 μm. In the 15 nighttime ones we counted a total of 5894 particles and 3706 with D ≥
0.58 μm. We had between 80 to 781 particles per lter.
Figure S5A shows the SSA0.58μm counts per litter calculated using the SEM images (particle count and
area imaged) and the total air sampled. Figure 5SB shows histograms of the chlorine mass percentage
found in the particles per lter. Between May 4 and May 9 we see a noticeable Cl depletion, suggesting
the atmospheric marine boundary layer in this region had anthropogenic pollutants.
Page 13/25Atmospheric Diurnal anomalies
We calculated diurnal anomalies for the air temperature, relative humidity (RH7m ), and wind speed (U27m ),
in the Paci c Ocean for two scenarios: 1) the days where a diel cycle in NSSA_0.58µm was detected and 2)
when there was no diel cycle in NSSA_0.58µm (Fig. S6). The average between midnight and 05:00 is the
baseline for each variable. To avoid continental in uence, this analysis was done only in the open ocean
and near the Paci c islands except Japan and Fiji.
The air temperature and relative humidity anomalies show no discernible differences between days where
a cycle was detected (Fig S6; panels AirT_a, RH_a) and when there was no cycle (FigS6; panels AirT_b,
RH_b). This implies that even though both atmospheric variables have a diurnal signature, their changes,
especially in relative humidity, cannot explain the diurnal patterns seen for NSSA_0.58µm .
Finally, the wind speed anomaly analysis (Fig. S6, WS_a, WS_b) also does not show sharp changes at
sunrise or sunset; there might be isolated cases, but no consistent pattern.
Effect of atmospheric variables on the SSA0.58μm diurnal cycle
Rain, relative humidity, air temperature, and atmospheric instability can have an effect on the production,
growth, transport and removal of SSA. Here we explain why these variables do not explain the NSSA_0.58µm
diel cycle.
First, rain suppressed the NSSA_0.58µm cycle (Fig. 1A and Fig. S5A), as it is a known washout mechanism
of aerosols. Second, there are several indications against RH as a major driving factor underlying the
detected diurnal cycle in SSA0.58µm concentration. For example, for a given SSA, its dry diameter is
around ¼ of its diameter at formation (1). Hence, if RH variations were the cause, we expect to see the
diurnal patterns in all sizes, and especially at smaller diameters, but this is not the case (Fig. S1).
Additionally, the NSSA_0.58µm diel cycles were observed in days with and without daily variations in air
temperature and RH (Fig. S7). In addition, RH and air temperature diurnal anomalies have similar trends
for days when the NSSA_0.58µm diel cycles was observed and when it was not (Fig. S6). Finally, the
atmospheric stability that in uences the transport of aerosols from the ocean surface upward does not
explain the diurnal cycle either. Firstly, under most atmospheric conditions, concentrations of SSA with
D dry < 10 µm are well mixed in the marine boundary layer, showing little variation with height (1), hence a
change in stability conditions will most likely not cause a change in NSSA_0.58µm . In addition, during the
Taiwan – Fiji transect, the cycle appeared in three distinct atmospheric states: with clear skies at low
wind speeds, with overcast conditions and with trade cumulus throughout the day (see Fig. S8).
Especially, that a cycle is observed even if the morning is overcast (Fig. S8b), and that there are cycles
when there is no air temperature variability (Fig. S7), infers that most likely atmospheric stability does not
Page 14/25play a signi cant role in the observed diel cycles. Therefore, we conclude that the atmospheric variables
cannot explain the observed NSSA_0.58µm diel cycle.
Photosynthetically active radiation (PAR) vs daytime to nighttime ratio of concentration
By de nition, solar radiation drives diurnal cycles. Therefore, we explored links between the intensity of
solar radiation, measured by the average daytime photosynthetically available radiation (PAR), and the
average daytime number count of SSA0.58µm to determine if the intensity of solar radiation has a
measurable effect on the total amount of SSA0.58µm . We considered the nighttime (background)
concentration by calculating the ratio of daytime to nighttime number concentration for the same day
and plotted it against the average PAR (Fig. S9). No clear correlation between PAR and NSSA_0.58µm was
found. Furthermore, examples of days with similar PAR that showed different daytime NSSA_0.58µm can be
seen in Fig. 1B and Fig. S8. This analysis suggests the NSSA_0.58µm diel cycle is not caused directly by
changes in solar radiation, but that there is a parallel mechanism.
Surface Ocean variables anomalies
Similar to the atmospheric variables anomalies, we calculated the rate of change (∂POC/∂t) for
particulate organic carbon (POC) and diurnal anomalies for chlorophyll a, salinity, and SST for days
where the cycle was detected and not in the Paci c Ocean (Fig. S10). The average between midnight and
05:00 is the baseline for each variable. To avoid continental in uence, this analysis was done only in the
open ocean and near the Paci c islands except Japan and Fiji.
The Chl a and salinity anomalies analysis does not show any diurnal changes. The POC shows a
decrease during nighttime and an increase during daytime both when we detected a NSSA_0.58µm diel cycle
and when we did not. The daytime increase in POC can be attributed to photosynthetic growth or particle
aggregation. Similarly, in the SST anomaly, for both cases, when cycles were detected (Fig. S10, SST_a)
and not detected (Fig. S10, SST_b), we see a diurnal signature. However, here we see no difference from
the base line up to 09:00, and only a gradual increase from 10:00. Depending on wind conditions, there
can be a few degrees difference between SST at the skin of the ocean surface and SST at 0.5-3m depth,
and expect to have a stronger diurnal cycle near the skin of the ocean (18), but we don’t expect to have a
sharp change at sunrise or sunset.
Particle size index γ in different parts of the ocean
To understand the differences in γ and how it might be related to SSA0.58µm production, we calculated the
average γ in 24 hour cycles. Figure S11 shows three different scenarios: Fig. S11A shows the average γ
Page 15/25measured in the Atlantic Ocean and in the Paci c Ocean when diurnal cycles in NSSA_0.58µm were detected. Fig. S11B shows the average γ measured during the Keelung – Fiji leg separated by different latitude ranges and the average γ while Tara was anchored near Niue Island. Finally, Fig. S11C shows the average γ measured in the transect from Fiji to New Zealand. This shows the latitudinal dependence of γ at low latitudes and that in the Atlantic Ocean there is a larger mean particle size, which suggest the presence of larger planktonic species than in the Paci c Ocean. Contribution of small, ~
Acknowledgments

Special thanks of gratitude to the R/V Tara crew. The authors will like thank the Tara Paci c Coordinators
for their valuable comments on the manuscript.

Funding: This research was supported by a research grant from Scott Jordan and Gina Valdez, the De
Botton for Marine Science, the Yeda-Sela center for Basic research, and a research grant from the Yotam
Project..

We are keen to thank the commitment of the following institutions for their nancial and scienti c
support that made this unique Tara Paci c expedition possible: CNRS, PSL, CSM, EPHE, Genoscope/CEA,
Inserm, Université Côte d’Azur, ANR, agnès b., UNESCO-IOC, the Veolia Environment Foundation, Région
Bretagne, Serge Ferrari, Billerudkorsnas, Amerisource Bergen Company, Lorient Agglomeration, Oceans by
Disney, the Prince Albert II de Monaco Foundation, L’Oréal, Biotherm, France Collectivités, Kankyo Station,
Fonds Français pour l’Environnement Mondial (FFEM), Etienne BOURGOIS, the Tara Foundation teams
and crew. Tara Paci c would not exist without the continuous support of the participating institutes. The
authors also particularly thank Serge Planes, Denis Allemand and the Tara Paci c consortium.

Partial support was provided by NSF AGS-1639868. This study has been conducted using E.U.
Copernicus Marine Service Information and Mercator Ocean products. GD is supported by the European
Research Council (ERC) project constRaining the EffeCts of Aerosols on Precipitation (RECAP) under the
European Union's Horizon 2020 research and innovation programme with grant agreement No 724602. FL
is supported by Sorbonne Université, Institut Universitaire de France and the Fondation CA-PCA. The in-
line and atmospheric optics dataset was collected and analyzed with support from NASA Ocean Biology
and Biogeochemistry program under grants NNX13AE58G and NNX15AC08G to U. of Maine. This is
publication number # 13 of the Tara Paci c Consortium.

Author Contributions

Conceptualization, J.M.F, O.A., A.K., M.T., E.B., F.L., G.G., Y.R., A.V., and I. K.; Data curation, J.M.F., G.B., N.
H., E. B., and F.L.; Formal analysis, J.M.F lead, G.B., G.D., N. H., and F.L. supporting; Funding acquisition,
E.B., F.L., G.G., A.V., and I. K.; Investigation, J.M.F., G.B. N.H., N.L.-Y., and F.L.; Project administration, J.M.F.,
G.B., M.T., E.B., F.L., G.G., A.V., and I.K.; Supervision, J.M.F., E.B., F.L., G.G., Y.R., A.V., and I.K.; Visualization,
J.M.F., A.V., and I.K.; Writing – Original Draft, J.M.F.; Writing – Review & Editing, J.M.F, A.K., O.A., I.K., and
A.V. lead, G.B., G.D., N. H, M.S.B., N.L.-Y., M.T., E.M., F.L., G.G., Y.R. supporting.

Competing Interests.

Authors declare no competing interests.

References

                                                        Page 17/25
1. Lewis, R. & Schwartz, E. in Geophysical Monograph Series (American Geophysical Union, 2004).
doi:10.1029/GM152
2. De Leeuw, G. et al. in Ocean-Atmosphere Interactions of Gases and Particles (eds. Liss, P. S. &
Johnson, M. T.) 171–246 (Springer Berlin Heidelberg, 2014). doi:10.1007/978-3-642-25643-1_4
3. Textor, C. et al. Analysis and quanti cation of the diversities of aerosol life cycles within AeroCom.
Atmospheric Chemistry and Physics 6, 1777–1813 (2006).
4. Gantt, B. et al. Global distribution and climate forcing of marine organic aerosol – Part 2: Effects on
cloud properties and radiative forcing. Atmospheric Chemistry and Physics 12, 6555–6563 (2012).
5. McCoy, D. T. et al. Natural aerosols explain seasonal and spatial patterns of Southern Ocean cloud
albedo. Science Advances 1, e1500157 (2015).
6. Wu, J. Evidence of sea spray produced by bursting bubbles. Science 212, 324–326 (1981).
7. Monahan, E. C., Spiel, D. E. & Davidson, K. L. in Oceanic Whitecaps (eds. Monahan, E. C. & Niocaill, G.
M.) 167–174 (Springer Netherlands, 1986). doi:10.1007/978-94-009-4668-2_16
8. Salter, M. E. et al. An empirically derived inorganic sea spray source function incorporating sea
surface temperature. Atmospheric Chemistry and Physics 15, 11047–11066 (2015).
9. Modini, R. L., Russell, L. M., Deane, G. B. & Stokes, M. D. Effect of soluble surfactant on bubble
persistence and bubble-produced aerosol particles. J. Geophys. Res. Atmos. 118, 1388–1400 (2013).
10. Long, M. S. et al. Light-enhanced primary marine aerosol production from biologically productive
seawater. Geophys. Res. Lett. 41, 2661–2670 (2014).
11. Keene, W. C. et al. Factors that modulate properties of primary marine aerosol generated from
ambient seawater on ships at sea. J. Geophys. Res. Atmos. 122, 11,961–11,990 (2017).
12. Planes, S. et al. The Tara Paci c expedition-A pan-ecosystemic approach of the “-omics” complexity
of coral reef holobionts across the Paci c Ocean. PLoS Biol 17, e3000483 (2019).
13. Gorsky, G. et al. Expanding Tara Oceans Protocols for Underway, Ecosystemic Sampling of the
Ocean-Atmosphere Interface During Tara Paci c Expedition (2016–2018). Frontiers in Marine
Science 6, (2019).
14. Flores, J. et al. Tara Paci c Expedition’s Atmospheric Measurements of Marine Aerosols across the
Atlantic and Paci c Oceans: Overview and Preliminary Results. Bulletin of the American
Meteorological Society 101, E536–E554 (2020).
15. Boss, E. et al. The characteristics of particulate absorption, scattering and attenuation coe cients in
the surface ocean; Contribution of the Tara Oceans expedition. Methods in Oceanography 7, 52–62
(2013).
16. Stein, A. F. et al. Noaa’s HYSPLIT atmospheric transport and dispersion modeling system. Bulletin of
the American Meteorological Society 96, 2059–2077 (2015).
17. Rolph, G., Stein, A. & Stunder, B. Real-time Environmental Applications and Display sYstem: READY.
Environmental Modelling & Software 95, 210–228 (2017).
Page 18/2518. Laskin, A. et al. Tropospheric chemistry of internally mixed sea salt and organic particles: Surprising
reactivity of NaCl with weak organic acids. J. Geophys. Res. 117, (2012).
19. Ho, S., Peng, L., Anthes, R. A., Kuo, Y.-H. & Lin, H.-C. Marine boundary layer heights and their
longitudinal, diurnal, and interseasonal variability in the southeastern paci c using COSMIC, CALIOP,
and radiosonde data. J Clim 28, 2856–2872 (2015).
20. De Leeuw, G. et al. Production ux of sea spray aerosol. Reviews of Geophysics 49, (2011).
21. Drushka, K., Gille, S. T. & Sprintall, J. The diurnal salinity cycle in the tropics. Journal of Geophysical
Research: Oceans 119, 5874–5890 (2014).
22. Kawai, Y. & Wada, A. Diurnal sea surface temperature variation and its impact on the atmosphere
and ocean: A review. Journal of Oceanography 63, 721–744 (2007).
23. Boss, E., Twardowski, M. S. & Herring, S. Shape of the particulate beam attenuation spectrum and its
inversion to obtain the shape of the particulate size distribution. Appl Opt 40, 4885 (2001).
24. Dall’Olmo, G. et al. Inferring phytoplankton carbon and eco-physiological rates from diel cycles of
spectral particulate beam-attenuation coe cient. Biogeosciences 8, 3423–3439 (2011).
25. Boss, E., Haëntjens, N., Westberry, T. K., Karp-Boss, L. & Slade, W. H. Validation of the particle size
distribution obtained with the laser in-situ scattering and transmission (LISST) meter in ow-through
mode. Opt Express 26, 11125–11136 (2018).
26. Slade, W. H. et al. Underway and moored methods for improving accuracy in measurement of
spectral particulate absorption and attenuation. J. Atmos. Oceanic Technol. 27, 1733–1746 (2010).
27. Durand, M. D. & Olson, R. J. Contributions of phytoplankton light scattering and cell concentration
changes to diel variations in beam attenuation in the equatorial Paci c from ow cytometric
measurements of pico-, ultra- and nanoplankton. Deep Sea Research Part II: Topical Studies in
Oceanography 43, 891–906 (1996).
28. Becker, K. W. et al. Daily changes in phytoplankton lipidomes reveal mechanisms of energy storage
in the open ocean. Nat Commun 9, 5179 (2018).
29. Cullen, J. J., Lewis, M. R., Davis, C. O. & Barber, R. T. Photosynthetic characteristics and estimated
growth rates indicate grazing is the proximate control of primary production in the equatorial Paci c.
J. Geophys. Res. 97, 639 (1992).
30. Stramski, D. & Reynolds, R. A. Diel variations in the optical properties of a marine diatom. Limnology
and Oceanography Letters 38, 1347–1364 (1993).
31. Bidigare, R. R. & Ondrusek, M. E. Spatial and temporal variability of phytoplankton pigment
distributions in the central equatorial Paci c Ocean. Deep Sea Research Part II: Topical Studies in
Oceanography 43, 809–833 (1996).
32. Ras, J., Claustre, H. & Uitz, J. Spatial variability of phytoplankton pigment distributions in the
Subtropical South Paci c Ocean: comparison between in situ and predicted data. Biogeosciences 5,
353–369 (2008).
Page 19/2533. Decho, A. W. & Gutierrez, T. Microbial extracellular polymeric substances (epss) in ocean systems.
Front Microbiol 8, 922 (2017).
34. Poulain, S. & Bourouiba, L. Biosurfactants Change the Thinning of Contaminated Bubbles at
Bacteria-Laden Water Interfaces. Phys Rev Lett 121, 204502 (2018).
35. Wang, X. et al. The role of jet and lm drops in controlling the mixing state of submicron sea spray
aerosol particles. Proc Natl Acad Sci U S A 114, 6978–6983 (2017).
36. Ottesen, E. A. et al. Ocean microbes. Multispecies diel transcriptional oscillations in open ocean
heterotrophic bacterial assemblages. Science 345, 207–212 (2014).
37. Iuculano, F., Mazuecos, I. P., Reche, I. & Agustí, S. Prochlorococcus as a possible source for
transparent exopolymer particles (TEP). Front Microbiol 8, 709 (2017).
38. Kurata, N. et al. Surfactant-associated bacteria in the near-surface layer of the ocean. Sci. Rep. 6,
19123 (2016).
39. Ribalet, F. et al. Light-driven synchrony of Prochlorococcus growth and mortality in the subtropical
Paci c gyre. Proc Natl Acad Sci U S A 112, 8008–8012 (2015).
40. Poulain, S., Villermaux, E. & Bourouiba, L. Ageing and burst of surface bubbles. J Fluid Mech 851,
636–671 (2018).
41. Poulain, S. & Bourouiba, L. Disease transmission via drops and bubbles. Phys Today 72, 70–71
(2019).
42. Dall’Olmo, G., Westberry, T. K., Behrenfeld, M. J., Boss, E. & Slade, W. H. Signi cant contribution of
large particles to optical backscattering in the open ocean. Biogeosciences 6, 947–967 (2009).
43. Gardner, W. D., Mishonov, A. V. & Richardson, M. J. Global POC concentrations from in-situ and
satellite data. Deep Sea Research Part II: Topical Studies in Oceanography 53, 718–740 (2006).
44. Salge, T., Neumann, R., Andersson, C. & Patzschke, M. Advanced mineral classi cation using feature
analysis and spectrum imaging with EDS. Proceedings: International Mining Congress and
Exhibition, 23rd, Turkey, UCTEA Chamber of Mining Engineers of Turkey 357
45. Twardowski, M. S. et al. A model for estimating bulk refractive index from the optical backscattering
ratio and the implications for understanding particle composition in case I and case II waters. J.
Geophys. Res. 106, 14129–14142 (2001).
46. Vaulot, D. & Marie, D. Diel variability of photosynthetic picoplankton in the equatorial Paci c. J.
Geophys. Res. 104, 3297–3310 (1999).
47. Binder, B. J. & DuRand, M. D. Diel cycles in surface waters of the equatorial Paci c. Deep Sea
Research Part II: Topical Studies in Oceanography 49, 2601–2617 (2002).
Figures
Page 20/25Figure 1
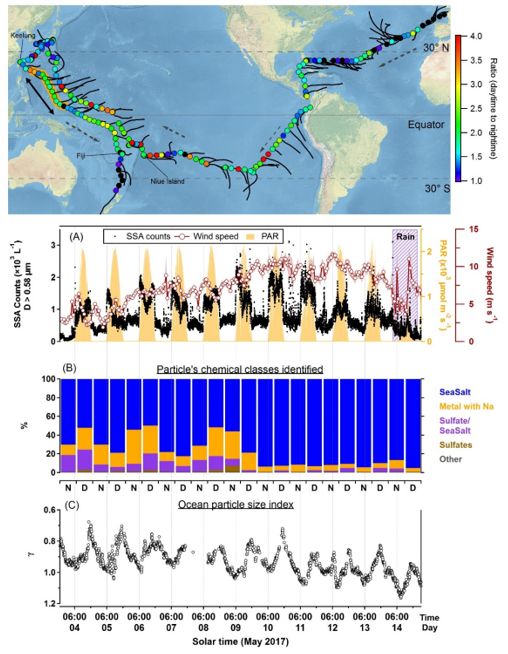
24-hour cycle of aerosol concentration and marine particle size index. Top panel: Map of R/V Tara’s route,
with dotted arrows along the sailing direction and solid black lines along the 48 hour back-trajectories.
Filled circles on the route are colored by the value of day-to-night concentration ratio. The data in panels
(a) through (c) are from the orange-shaded transect in the western Paci c between Keelung and Fiji (next
to the double ended arrow). (A) Main observation. Aerosol concentration per liter (Ddry > 0.58 μm,
collected 27 m above sea surface), superimposed on the 24-hour beat of incoming solar ux as
represented by the photo-synthetically active radiation (PAR). Time series are punctuated by abrupt
spikes at dawn and drops at dusk. The diel rhythm (away from land) is evident, ubiquitous and persists
on cloudy days. Pollution origin of this cycle is ruled out by the 48 hour back-trajectories; (B) Aerosol
composition determined by SEM-EDX for D > 0.58 μm. “N” and “D” denote night and day, respectively.
Page 21/25This is compelling evidence for the marine origin of the aerosols. The collection lters were replaced at
about 08:00-09:30 and 20:00-21:30 (see Table S1 in the SI for timing details); (C) 24-hour signal of
marine particle size index γ (vertical axis inverted). Particles grow during the day and shrink during the
night. Data collected at 0.5-3m below sea surface. Note: The designations employed and the presentation
of the material on this map do not imply the expression of any opinion whatsoever on the part of
Research Square concerning the legal status of any country, territory, city or area or of its authorities, or
concerning the delimitation of its frontiers or boundaries. This map has been provided by the authors.
Figure 2
Day-to-night NSSA_0.58µm ratio and chlorophyll a concentration along R/V Tara’s route. Top panel: Tara’s
route, color-coded by month; (A) The ratio of day to night concentration of SSA with D≥0.58µm. The
colors as de ned in the map; (B) a 5-day running average of Chlorophyll-a concentration measured with
the AC-S aboard Tara (red circles) and calculated using satellite data (green triangles; see methods), with
Page 22/25the shaded area outlining the standard deviation. The largest day-to-night ratios are in areas with low chl-
a concentration, i.e., in oligotrophic (“blue”) waters. Note: The designations employed and the
presentation of the material on this map do not imply the expression of any opinion whatsoever on the
part of Research Square concerning the legal status of any country, territory, city or area or of its
authorities, or concerning the delimitation of its frontiers or boundaries. This map has been provided by
the authors.
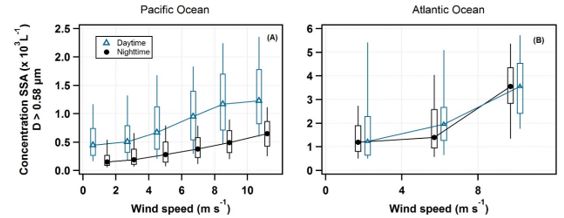
Figure 3
Dependence of NSSA_0.58µm on wind speed. Box plots of the NSSA_0.58µm vs. wind speed, binned at 2
ms-1 for the Paci c Ocean (panel A) and by 4 ms-1 for the Atlantic Ocean (panel B) where data collected
further than 100 km away from land was used. The day and night data are offset for clarity. The y-axis
scale is different for the two panels. While the expected increase of aerosol concentration with wind
speed is indeed observed, no relation between the 24-hour cycle and wind speed is found.
Page 23/25Figure 4
Day-to-night changes of NSSA_0.58µm and ∂γ/∂t(hr-1) where an NSSA_0.58µm diel cycle was evident.
(A) Box plot analysis of the 143 days with the 24-hour cycle in Paci c Ocean shows compelling statistical
signi cance of day and night counts; (B) Box plot analysis of the γ rate of change for the 94 days where a
diel cycle of NSSA_0.58µm occurred (vertical axis inverted). Statistically signi cant day to night variation
is readily discernible. The box plots show the median, and the 5th, 25th, 75th, and 95th percentiles; the
orange line is the average.
Supplementary Files
Page 24/25This is a list of supplementary les associated with this preprint. Click to download.
SIFloresetalComm.docx
Page 25/25You can also read