Development of an in situ dual-channel thermal desorption gas chromatography instrument for consistent quantification of volatile ...
←
→
Page content transcription
If your browser does not render page correctly, please read the page content below
Atmos. Meas. Tech., 14, 6533–6550, 2021
https://doi.org/10.5194/amt-14-6533-2021
© Author(s) 2021. This work is distributed under
the Creative Commons Attribution 4.0 License.

Development of an in situ dual-channel thermal desorption gas
chromatography instrument for consistent quantification of volatile,
intermediate-volatility and semivolatile organic compounds
Rebecca A. Wernis1,2 , Nathan M. Kreisberg3 , Robert J. Weber2 , Yutong Liang2 , John Jayne4 , Susanne Hering3 , and
Allen H. Goldstein1,2
1 Department of Civil and Environmental Engineering, University of California Berkeley, Berkeley, CA 94720, USA
2 Department of Environmental Science, Policy and Management, University of California Berkeley,
Berkeley, CA 94720, USA
3 Aerosol Dynamics, Inc., Berkeley, CA 94710, USA
4 Aerodyne Research, Inc., Billerica, MA 01821, USA

Correspondence: Rebecca A. Wernis (rwernis@berkeley.edu)

Received: 27 May 2021 – Discussion started: 7 June 2021
Revised: 25 August 2021 – Accepted: 10 September 2021 – Published: 8 October 2021

Abstract. Aerosols are a source of great uncertainty in ra-          In this work we present design details and data evaluat-
diative forcing predictions and have poorly understood health     ing key parameters of instrument performance such as I/VOC
impacts. Most aerosol mass is formed in the atmosphere from       collector design optimization, linearity and reproducibility of
reactive gas-phase organic precursors, forming secondary          calibration curves obtained using a custom liquid evaporation
organic aerosol (SOA). Semivolatile organic compounds             system for I/VOCs and the effect of an ozone removal filter
(SVOCs) (effective saturation concentration, C ∗ , of 10−1 –      on instrument performance. Example timelines of precursors
103 µg m−3 ) comprise a large fraction of organic aerosol,        with secondary products are shown, and analysis of a subset
while intermediate-volatility organic compounds (IVOCs)           of compounds detectable by cTAG demonstrates some of the
(C ∗ of 103 –106 µg m−3 ) and volatile organic compounds          analytical possibilities with this instrument.
(VOCs) (C ∗ ≥ 106 µg m−3 ) are gas-phase precursors to SOA
and ozone.
   The Comprehensive Thermal Desorption Aerosol Gas
Chromatograph (cTAG) is the first single instrument simulta-      1   Introduction
neously quantitative for a broad range of compound-specific
VOCs, IVOCs and SVOCs. cTAG is a two-channel instru-              In recent years, understanding of organic aerosol (OA)
ment which measures concentrations of C5 –C16 alkane-             sources has changed substantially. Globally, the burden of
equivalent-volatility VOCs and IVOCs on one channel and           secondary organic constituents, i.e., those formed via atmo-
C14 –C32 SVOCs on the other coupled to a single high-             spheric transformation processes, is much larger than that
resolution time-of-flight mass spectrometer, achieving con-       of directly emitted primary organic particulate matter. This
sistent quantification across 15 orders of magnitude of va-       is observed in both rural and urban areas (Docherty et al.,
por pressure. cTAG obtains concentrations hourly and gas–         2008; Jimenez et al., 2009; Williams et al., 2010; Zhang
particle partitioning for SVOCs every other hour, enabling        et al., 2007). Volatile organic compounds (VOCs) are crit-
observation of the evolution of these species through oxida-      ical precursors to OA. VOC oxidation controls the cycling
tion and partitioning into the particle phase. Online derivati-   of hydroxyl and nitrogen oxide radicals and the formation
zation for the SVOC channel enables detection of more polar       of tropospheric ozone (Atkinson and Arey, 2003). The oxi-
and oxidized species.                                             dation of VOCs produces lower-vapor-pressure compounds
                                                                  that form secondary organic aerosol (SOA) through conden-

Published by Copernicus Publications on behalf of the European Geosciences Union.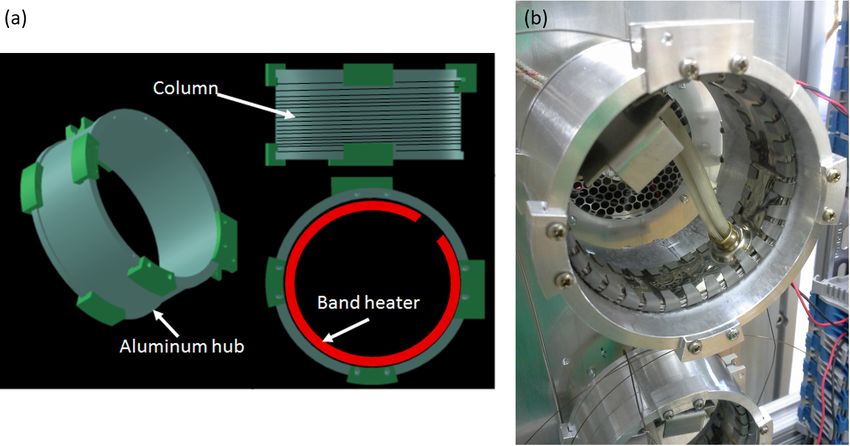
6534           R. A. Wernis et al.: Dual-channel thermal desorption gas chromatography for VOCs, IVOCs and SVOCs

sation onto preexisting particles, through new particle forma-     tal VOCs at urban sites in the Los Angeles Basin, with the
tion and growth (Seinfeld and Pankow, 2003), and through           lower end of the range corresponding to greater photochemi-
aqueous oxidation processes in aerosol or cloud water (Er-         cal processing and more of the VOC mass present in oxidized
vens et al., 2011). The fate of approximately half the VOC         species. Another widespread method is chemical ionization
emissions entering the atmosphere cannot be observationally        mass spectrometry (CIMS), e.g., the proton transfer reaction
accounted for, and this discrepancy is likely at least partially   mass spectrometer (Ionicon Analytik) and related technolo-
due to a lack of comprehensive measurements of speciated           gies, which compared to GC-based methods offers far greater
organic constituents in a variety of atmospherically distinct      temporal resolution but less specificity as isomers cannot be
environments (Goldstein and Galbally, 2007; Hallquist et al.,      separated, and detection is limited to compounds for which
2009; Heald and Kroll, 2020).                                      the ionization reaction with the chosen reagent is energeti-
   Recent work has demonstrated that a large fraction of or-       cally favorable.
ganic aerosol (OA) is semivolatile (Robinson et al., 2007).            Particle-phase SVOCs and lower-volatility organics have
Intermediate-volatility organic compounds (IVOCs, defined          traditionally been collected on disposable filters and ana-
as having an effective saturation concentration C ∗ of 103 to      lyzed offline via GCMS (Turpin et al., 2000). Field mea-
106 µg m−3 ) and semivolatile organic compounds (SVOCs,            surement techniques for gas- and particle-phase SVOCs have
C ∗ of 10−1 to 103 µg m−3 ) have been proposed as a substan-       been developed relatively more recently. The FIGAERO-
tial unaccounted for source of SOA in urban areas (Robin-          CIMS utilizes automated quartz filter collection for aerosol
son et al., 2007; Weitkamp et al., 2007) but are notoriously       particles and controlled thermal desorption into a CIMS in-
hard to measure (Goldstein and Galbally, 2007; Hunter et           strument (Lopez-Hilfiker et al., 2014), offering similar ad-
al., 2017; Isaacman-VanWertz et al., 2018). This hypothe-          vantages and tradeoffs of CIMS applied to gas-phase mea-
sis is supported by estimates of intermediate-volatility and       surements. The volatility and polarity separator (VAPS) sac-
semivolatile organic compound (I/SVOC) abundances in the           rifices detailed speciation in order to functionally character-
atmosphere that are an order of magnitude larger than pri-         ize a larger fraction of the organic aerosol mass (Martinez
mary organic aerosol (Robinson et al., 2007) and direct ev-        et al., 2016). The thermal desorption aerosol gas chromato-
idence that oxidation of compounds in the IVOC range ef-           graph (TAG) family of instruments, consisting of a reusable
ficiently produces SOA (Chan et al., 2009; de Gouw et al.,         filter-based collection cell or impactor cell coupled to a
2011; Lim and Ziemann, 2009; Presto et al., 2010).                 GCMS, maximizes chemical speciation of gas and particle
   There is a need for simultaneous measurement of VOCs,           SVOCs, including separation of isomers, at hourly time reso-
IVOCs, and gas- and particle-phase SVOCs with sufficient           lution. The first TAG was developed by Williams et al. (2006)
temporal resolution to track the rapidly changing chemical         with the impactor cell, sensitive to particle-phase SVOCs
composition and atmospheric conditions that directly affect        only. Later versions incorporated an automatic liquid injec-
SOA formation reactions. Owing to the enormous range of            tion system for calibrations (Isaacman et al., 2011), a filter
volatility encompassed by VOCs and I/SVOCs, this has typ-          cell and denuder for measurement of gas-phase SVOCs and
ically been achieved through collocation of at least two sep-      gas–particle partitioning of SVOCs (the SV-TAG; Zhao et
arate instruments – one to measure VOCs (C ∗ ≥ 106 µg m−3 )        al., 2013), a valveless injector for transferring the sample
and IVOCs and another to measure SVOCs. VOCs have tra-             onto the GC column with minimal losses (Kreisberg et al.,
ditionally been measured using one of two methods. One             2014), and online derivatization to enable detection of po-
way is to collect onto a bed of adsorbent materials and            lar SVOCs including alkanoic acids, polyols, diacids, sugars
desorb and analyze into a gas chromatograph (GC) cou-              and other multifunctional compounds in addition to nonpo-
pled to a flame ionization detector (FID) or a quadrupole          lar ones (Isaacman et al., 2014). A version of TAG using the
mass spectrometer (MS) (e.g., Gentner et al., 2012; Goldan         impactor cell, valveless injector and online derivatization is
et al., 2004; Goldstein et al., 1995; Hopkins et al., 2003;        commercially available from Aerodyne Research, Inc. Re-
Lamanna and Goldstein, 1999; Lerner et al., 2017; Millet           cently, an automated quartz filter collection with thermal des-
et al., 2005). This method offers excellent chemical speci-        orption and GCMS for chemical speciation of particle-phase
ficity as isomers are detected separately and low detec-           SVOCs has also been developed (Cropper et al., 2017; Ren
tion limits as samples are usually collected for many min-         et al., 2019). Using TAG with an impactor cell, Williams et
utes before analysis. However, due to the GC temperature           al. (2010) were able to quantify an estimated 20 % of fine
ramp and sample collection time, GC-based methods have             (PM1 ) organic aerosol mass as measured by an aerosol mass
a temporal resolution of 20 min to 1 h. Additionally, typi-        spectrometer at an urban site. While this statistic has not
cally primary pollutants such as alkanes and aromatics and         been estimated directly for the SV-TAG and likely varies with
early-generation secondary products such as carbonyls and          the measurement location and conditions, the use of online
alcohols are measurable, but multifunctional or fully aged         derivatization on that instrument would increase the analyz-
species are too thermally unstable or polar to measure by gas      able fraction of OA mass.
chromatography–mass spectrometry (GCMS). For example,                  In recent years both I/VOC instruments and SVOC instru-
Chung et al. (2003) were able to speciate 55 %–85 % of to-         ments have benefitted from field-deployable high-resolution

Atmos. Meas. Tech., 14, 6533–6550, 2021                                             https://doi.org/10.5194/amt-14-6533-2021
R. A. Wernis et al.: Dual-channel thermal desorption gas chromatography for VOCs, IVOCs and SVOCs                          6535

time-of-flight mass spectrometry (HRToFMS, e.g., TOFW-           lowed by a six-port valve (6PV, Valco Instruments Co. Inc.)
ERK and IONICON Analytik). This technology affords two           and the I/VOC collector for I/VOC pre-concentration. The
main advantages over quadrupole mass spectrometers. First,       I/VOC collector consists of a layered bed of adsorbents based
the high resolution (m/1m ≈ 4000 or more) allows for             on the design of Gentner et al. (2012), whose types and quan-
identification of chemical formulas of ions detected due to      tities were chosen in order to efficiently collect I/VOCs with
the unique mass defects of the different elements. Second,       volatilities between those of n-pentane and n-hexadecane
whereas the quadruple MS scans over a user-specified range       in a 1 L total sample volume when the collector is held at
of atomic mass units, presenting an implicit tradeoff between    30 ◦ C. Adsorbents are layered from least to most adsorp-
sensitivity and the range of possible ions detected (because a   tive strength, with the IVOCs adsorbing on the least adsorp-
smaller range or set of discreet masses to detect allows for     tive material and the most volatile VOCs passing through
increased dwell times), the HRToFMS has no such limitation       and adsorbing onto the most adsorptive material. Figure 2 is
and allows the user to detect the entire useful range of ion     a diagram of the collector. In order along the sample flow
masses with no compromise in sensitivity and indeed overall      path are 60 mg glass beads (Alltech, 60/80 mesh, DCMS-
enhanced sensitivity.                                            treated), 10 mg Tenax TA (Supelco, 60/80 mesh), 10 mg glass
   The Comprehensive Thermal Desorption Aerosol Gas              beads, 20 mg Carbopack B (Supelco, 60/80 mesh), 10 mg
Chromatograph (cTAG) combines an I/VOC collector based           glass beads, 20 mg Carbopack X (Supelco, 60/80 mesh) and
upon the design of Gentner et al. (2012) and one channel of      10 mg glass beads. The glass beads do not efficiently trap
the SV-TAG joined together before a HRToFMS to access            VOCs or IVOCs and serve solely as separators for the ad-
a broader volatility range of speciated organic compounds        sorbents. Once assembled and before installation on the in-
in a single instrument than previously achieved. Nonpolar        strument, the collector is conditioned at 325 ◦ C with 50 sccm
and some polar VOCs and IVOCs as well as nonpolar and            nitrogen for 3 h. Breakthrough volume measurements de-
derivatization-amenable polar SVOCs are quantitatively col-      scribed in Sect. 3.1 were performed to ensure that this bed
lected, including many primary and secondary organics that       composition would fully collect and transfer all VOCs and
lend insight into important sources and oxidation processes      IVOCs in the range of interest.
in atmospheric chemistry.                                            Adsorbents are packed in a custom, pure-stainless-steel
                                                                 housing consisting of a 3.18 mm outer diameter (o.d.) thin-
                                                                 walled (0.13 mm) tube brazed to a 1.59 mm o.d., 0.51 mm i.d.
2     Description of instrument                                  tube (Fig. 2). A section of the 3.18 mm portion that contains
                                                                 the adsorbents is flattened to 1.59 mm o.d. to reduce swept
Utilizing reusable adsorbent and stainless-steel filter col-     volume in the collector and improve heat transfer to enable
lection, thermal desorption, online derivatization, GC and       sharper injections of highly volatile compounds. Brazing to
HRToFMS in a dual-channel setup, the cTAG measures con-          the 1.59 mm tube eliminates the need for a union and the as-
centrations of speciated organic compounds from C5 through       sociated internal volume, again aiding the rapid injection of
C32 alkane equivalent volatility. The instrument operates in     the most volatile species. A stainless-steel microfiber mesh
an automated fashion with hourly time resolution for con-        screen (Bekaert) installed at the braze point keeps out par-
centrations and gas–particle partitioning measurements of        ticles and retains the adsorbents on the upstream sampling
SVOCs every other hour. Derivatization of SVOCs allows           end, while a glass wool plug retains the adsorbents on the
for detection and analysis of polar compounds with hydroxyl      downstream end. The entire housing is chemically passivated
groups in addition to nonpolar species. In this section, we      (Inertium® treatment, AMCX, PA, USA) to prevent active
describe the key components of the system, the sample col-       compounds from reacting with the stainless steel.
lection, separation and detection pathways, calibration meth-        During sampling the I/VOC collector is held at a tempera-
ods, timing, and data processing procedures. Figure 1 shows      ture at least several degrees above the dew point to avoid wa-
a schematic of the instrument.                                   ter condensation in the system; this is typically around 30 ◦ C.
                                                                 After sampling, the I/VOC collector is briefly purged with
2.1    Inlet and I/VOC channel                                   helium to reduce the amount of air and water sent to the de-
                                                                 tector. Then the 6PV actuates and helium flows through the
Ambient air enters the instrument through either a sharp-cut     collector in the reverse direction as the collector heats from
PM2.5 cyclone or a sharp-cut PM1 cyclone depending on            ambient temperature to 260 ◦ C to desorb the analytes onto
application-specific criteria (SCC BGI Inc., Waltham, MA)        the GC column (metal MXT-624, 30 m, 0.32 mm i.d., 1.8 µm
(Kenny et al., 2000). The flow is then split to collect I/VOCs   phase). Two 100 W cartridge heaters mounted in an alu-
and SVOCs in parallel.                                           minum block clamped to the collector housing ensure a rapid
   On the I/VOC channel, 50 sccm of ambient air is pulled        initial heating time of 35 s, producing sharp chromatography
from downstream of the cyclone through a stack of three          peaks even for the unretained, most volatile species. Total
0.25 in. diameter punches of glass fiber filters impregnated     desorption time is 4 min. GC analysis time is 25 min, with
with sodium thiosulfate (Na2 S2 O3 ) to remove ozone, fol-

https://doi.org/10.5194/amt-14-6533-2021                                           Atmos. Meas. Tech., 14, 6533–6550, 2021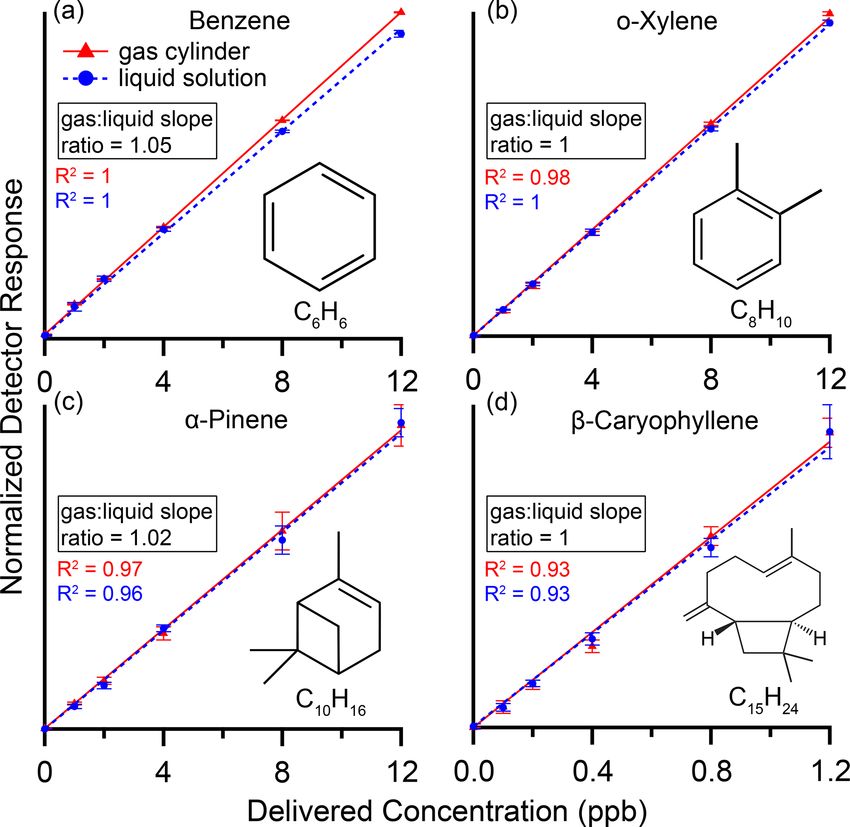
6536            R. A. Wernis et al.: Dual-channel thermal desorption gas chromatography for VOCs, IVOCs and SVOCs

Figure 1. Schematic of cTAG. VOCs and IVOCs are collected on the I/VOC collector while SVOCs are collected on the collection and
thermal desorption cell. The I/VOC and SVOC channels are independent until the GC column outputs from each channel meet and enter
the HRToFMS. Optionally, the SVOC channel can collect only particle-phase SVOCs by first passing sampled air through a denuder that
removes all gas-phase compounds. A derivatization agent introduced upon desorption of the SVOCs from the collection cell enables detection
of polar SVOCs in addition to nonpolar ones. Sample collection happens in parallel, for 23 min, followed by analysis of the I/VOC collector
contents and then analysis of the semivolatile collection cell contents, for a total turnaround time of 1 h. Calibration is done for VOCs and
IVOCs by manually disconnecting the ambient inlet and connecting and sampling the output of the calibration gas delivery system (Fig. 3)
and for SVOCs via liquid standard injections onto the semivolatile collection cell.

Figure 2. Schematic of I/VOC collector. Semivolatile and lower-volatility species, including particles, are captured on the metal filter. IVOCs
are captured on the Tenax TA, while the most volatile analytes including isoprene are retained by the more aggressive adsorbents. Flow is
reversed for desorption so that the less volatile compounds never interact with the more aggressive adsorbents.

an initial hold for 1 min at 40 ◦ C followed by a 10 ◦ C min−1            nuder in line. F-CTD and denuder characteristics are de-
ramp to 250 ◦ C and a 3 min hold at 250 ◦ C.                              scribed in further detail in Zhao et al. (2013).
                                                                             After collection, the F-CTD is heated to 315 ◦ C and
                                                                          flushed with 20–150 sccm helium during a two-stage desorp-
2.2    SVOC channel                                                       tion process as described in Zhao et al. (2013). Upstream of
                                                                          the F-CTD the helium may optionally be bubbled through a
After splitting off from the combined ambient air flow                    liquid reservoir of N -methyl-N-(trimethylsilyl) trifluoroac-
through the cyclone, 10 L min−1 of ambient air passes                     etamide (MSTFA, Sigma-Aldrich, > 98 % purity, synthesis
through a stainless-steel filter collection and thermal desorp-           grade) for online derivatization of species containing hy-
tion cell (F-CTD) maintained at 30 ◦ C. The F-CTD quan-                   droxyl groups. Evaluation of online derivatization for TAG
titatively collects compounds with volatilities as high as n-             is discussed in Isaacman et al. (2014). The sample is re-
tetradecane (C14 ) and as low as n-dotriacontane (C32 ) in the            concentrated onto a focusing trap held at 30 ◦ C made of
gas and particle phases.                                                  a 1 m metal, thick-phase chromatography column (MXT-5,
   Directly upstream of the F-CTD, an optional 500-channel                0.53 mm i.d., 5 µm phase thickness; Restek). This step allows
activated carbon denuder (MAST Carbon) efficiently re-                    for faster transfer of low-volatility species and efficient purg-
moves gas-phase species, allowing for gas–particle partition-             ing of excess derivatization agent and by-products. Flow is
ing measurements by difference with and without the de-                   reversed on the trap to about 2 sccm for transfer of the sample

Atmos. Meas. Tech., 14, 6533–6550, 2021                                                      https://doi.org/10.5194/amt-14-6533-2021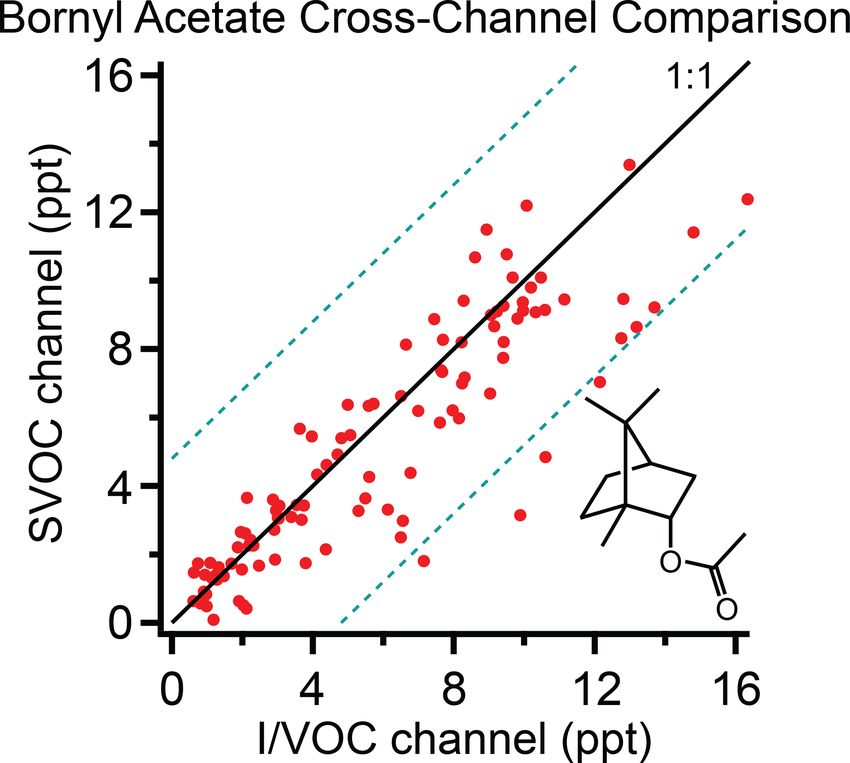
R. A. Wernis et al.: Dual-channel thermal desorption gas chromatography for VOCs, IVOCs and SVOCs                              6537

onto the GC column (metal MXT-5, 20 m, 0.18 mm i.d., 2 µm              Chromatographically separated analytes are detected by a
phase thickness; Restek) via the restrictive section of a valve-    field-portable HRToFMS (TOFWERK). The HRToFMS is
less interface (VLI), described by Kreisberg et al. (2014). GC      operated at 70 eV electron impact ionization over a user-
analysis time is 19 min, with an initial hold for 1 min at 50 ◦ C   selected mass-to-charge ratio range, typically from 15 to 450
followed by a 20 ◦ C min−1 ramp to 330 ◦ C and a 4 min hold         on cTAG. This allows for matching to compounds found
at 330 ◦ C.                                                         in mass spectral databases. For compounds not identifiable
                                                                    by database matching or authentic standard calibration, the
2.3   Miniature gas chromatographs                                  mass-to-charge resolution of m/1m ≈ 4000 enables deter-
                                                                    mination of the molecular formula of the ions, lending insight
                                                                    into molecular structure and ultimately compound identity, a
cTAG requires two separate GC columns each optimized
                                                                    critical capability for studying the complex interactions of
for the separation of target species on a given channel and
                                                                    organic molecules in the atmosphere.
whose temperatures are controlled independently. In order
to achieve this while preserving the instrument’s compact-
                                                                    2.5   Calibration
ness and time resolution, we developed miniature gas chro-
matographs. Each chromatograph consists of a custom ma-
                                                                    Calibration on both channels relies on injection and analysis
chined aluminum hub around which the metal column is
                                                                    of a suite of authentic standards in varying amounts. On the
wrapped in a single layer so that it is in thermal contact
                                                                    I/VOC channel, a mixture in either liquid or gas form is in-
with the hub along its entire length. On the inside surface
                                                                    troduced into a custom dynamic dilution system for fine con-
of the hub, an expanding split-band 150 W heater heats the
                                                                    trol of the output concentration. The dynamic dilution system
hub evenly around its circumference. A thermocouple in-
                                                                    uses a heated platinum catalyst to generate zero air at ambi-
serted into a bored hole in the hub body tracks its temper-
                                                                    ent relative humidity and a series of mass flow controllers
ature. Proportional integral derivative (PID) heating control
                                                                    (MFCs, 0–20 and 0–1000 sccm, Bronkhorst EL-FLOW) and
allows for programmable, reproducible temperature ramping
                                                                    valves to choose and dilute the input mixture for sampling
for GC analysis. When the temperature program completes,
                                                                    (Fig. 3). Dilution ratios ranging from 50 : 1 to 1000 : 1 ensure
a fan blows ambient air onto the hub to bring it back to its
                                                                    near-ambient relative humidity for diluted mixtures. From
initial temperature in time for the next sample injection. As
                                                                    the point of mixing to the collector, all plumbing is heated
with traditional GC systems, the front of the column may be
                                                                    to at least 55 ◦ C. A specialty gas cylinder with multiple com-
trimmed (at the expense of one full winding on the aluminum
                                                                    ponents at parts-per-million levels is introduced in one port
hub) to extend column life. Design schematics, photos and
                                                                    of the system.
temperature ramp reproducibility data can be found in Ap-
                                                                       Calibration using custom compressed gas cylinders lim-
pendix A.
                                                                    its the user to compounds amenable to storage in cylinders
   The use of miniature gas chromatographs has obvious ben-
                                                                    over years and does not allow significant flexibility after stan-
efits for instrument compactness and field portability. Addi-
                                                                    dard cylinders are produced. We developed a liquid evapora-
tionally, the independent temperature control allows analysis
                                                                    tion system modeled after Jardine et al. (2010) to circumvent
on one channel to start while the column from the other chan-
                                                                    these limitations by allowing the user to purchase individual
nel is cooling down, increasing the maximum possible time
                                                                    pure standards and prepare liquid solutions for evaporation
resolution compared with the traditional approach of using
                                                                    and sampling. The liquid mixture is drawn into a syringe
a single oven for dual-column GC methods. While commer-
                                                                    pump (TECAN Cavro Centris Pump, 250 µL glass syringe)
cial miniature GC systems are available, e.g., from Valco In-
                                                                    and dispensed into another port of the dynamic dilution sys-
struments Company Inc. (Column/Fan Modules for Fast GC,
                                                                    tem at a rate of 1.6 µL min−1 into a dedicated evaporation
2020), we chose to design our own for greater flexibility and
                                                                    chamber. From one end of the chamber a dedicated MFC
the ability to use off-the-shelf columns.
                                                                    flows 1000 sccm zero air over the emerging liquid feed. Most
                                                                    of the resulting evaporated mixture in zero air is exhausted
2.4   High-resolution time-of-flight mass spectrometer              while 0–20 sccm is subsampled for subsequent dilution in
                                                                    the same manner as a gas cylinder. Once diluted, the gas or
The two chromatography columns are joined in a passi-               liquid calibration mixture is collected on the I/VOC collec-
vated tee connected to an approximately 18 cm passivated            tor and then desorbed and analyzed exactly like ambient air
stainless-steel 794 mm o.d., 125 µm i.d. tube that serves as        samples.
the mass spectrometer transfer line, held at a constant 275 ◦ C.       On the SVOC channel, liquid calibration mixtures are held
While one column progresses through its temperature pro-            in reservoirs pressurized under helium. A multiport selector
gram, the other is held at its initial temperature with constant    (Rheodyne MHP7970-500-4) selects a reservoir to fill a 5 µL
flow, and the analytes and carrier gas are pulled through the       sample loop. A six-port valve (Rheodyne MHP9900-500-1)
transfer line into the vacuum chamber of the mass spectrom-         actuates to allow pressurized helium to push the liquid out of
eter.                                                               the loop and inject it directly onto the F-CTD via a dedicated

https://doi.org/10.5194/amt-14-6533-2021                                              Atmos. Meas. Tech., 14, 6533–6550, 2021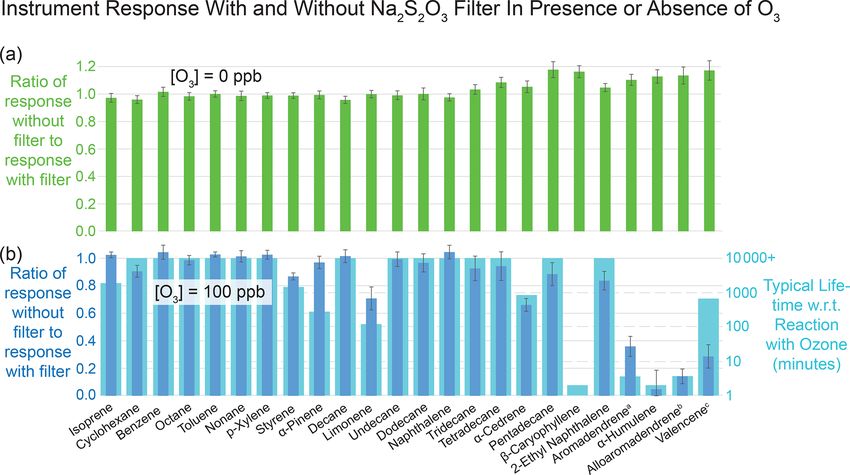
6538           R. A. Wernis et al.: Dual-channel thermal desorption gas chromatography for VOCs, IVOCs and SVOCs

Figure 3. Schematic of dynamic dilution system for VOC and IVOC calibration. Gas cylinders or liquid mixtures can be used for calibration.
Liquid mixtures are introduced into an evaporation cell using a syringe pump. The liquid is evaporated into 1 L min−1 of zero air to reach
parts-per-million or lower concentrations. The resulting gaseous mixture (or, by user choice, the output of a calibration gas cylinder) is
subsampled with a 2–20 cm3 min−1 MFC and further diluted up to 500 times with more zero air before being sampled by the I/VOC
collector. Zero air for the dilution system is generated by passing ambient air through a heated platinum catalyst.

port in the cell housing. A detailed description of the SVOC           PC platform interfaces between the user and the control box,
liquid calibration injection system may be found in Isaacman           using serial communication to send commands and load se-
et al. (2011).                                                         quences for unattended field operation and receive, display,
   Prior to applying calibrations from analysis of authentic           plot, and record temperature and voltage readings.
standards, ambient data are normalized by an internal stan-               Total turnaround time for a single instrument cycle is ex-
dard introduced onto the sampling medium of each chan-                 actly 1 h. A typical operation sequence begins with 23 min of
nel on every ambient sample. For the I/VOC channel, sev-               concurrent sampling on the I/VOC and SVOC channels with
eral ambient long-lived and therefore atmospherically well-            the SVOC channel optionally sampling through the denuder
mixed anthropogenic compounds with no significant current              to remove gas-phase species. During sampling the SVOC
emission sources serve as suitable internal standards to con-          chromatographic analysis of the previous hour’s sample fin-
trol for run-to-run variability. Carbon tetrachloride is com-          ishes. Once sampling is completed, the I/VOC collector is
monly used for this purpose (Lerner et al., 2017) and CFC-             purged with helium for 1 min. Then the 6PV actuates, at
113 and 1,1,1-trichloroethane are also adequate for cTAG on            which point the 25 min I/VOC GC temperature program and
the timescale of a typical field campaign (Engel et al., 2018;         HRToFMS data acquisition begin and the I/VOC collector
Karbiwnyk et al., 2003). The compound with the clearest sig-           is rapidly heated to 280 ◦ C and held at that temperature for
nal and fewest coelutions among these is generally preferred.          4 min while 1.5 sccm of helium carries the analytes to the
On the SVOC channel, a single 5 µL loop of a calibration               head of the GC column.
mixture of isotopically labeled compounds spanning a vari-                While the I/VOC sample is being analyzed, the SVOC liq-
ety of volatilities and functional groups is injected onto the         uid calibration system injects 5 µL of the internal standard
F-CTD after collection of every ambient sample. These com-             mixture onto the F-CTD. The F-CTD is then heated to 315 ◦ C
pounds are desorbed and analyzed with the sample and serve             under 20 sccm of helium. Total helium purge flow is con-
to track variability of derivatization efficiency and instrument       trolled by a mass flow controller (MFC). The flow is split
response.                                                              downstream of the MFC, with 80 % bubbling through the
                                                                       reservoir of liquid derivatization agent before rejoining the
2.6    Instrument operation                                            other 20 % and purging the F-CTD. This flow ratio was de-
                                                                       termined to be sufficient for complete derivatization of all
                                                                       compound classes of interest in Isaacman et al. (2014). Af-
cTAG is fully automated. All valves, fans, temperature-
                                                                       ter 8 min, the total flow is increased to 150 sccm for 4 min to
regulated zones and electronic pneumatic controllers are con-
                                                                       aid the transfer of the least-volatile compounds. During this
trolled by a microprocessor-based control box developed by
                                                                       process analytes are refocused on the focusing trap, held at
Aerodyne Research, Inc. for commercially available TAG
                                                                       30 ◦ C. Flow is then reversed and the trap heats to 315 ◦ C as
systems and adapted and upgraded for our system. A Mi-
                                                                       the I/VOC GC analysis finishes. Continued purge flow from
crosoft Visual Basic .NET software program operating on a

Atmos. Meas. Tech., 14, 6533–6550, 2021                                                  https://doi.org/10.5194/amt-14-6533-2021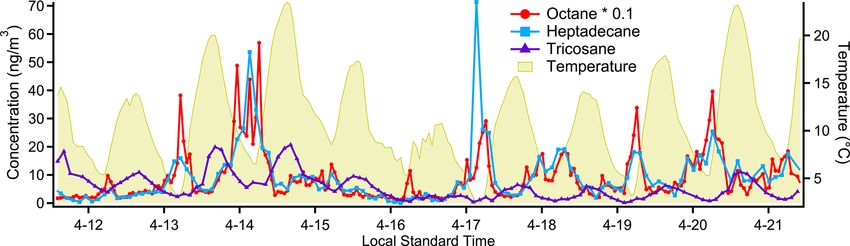
R. A. Wernis et al.: Dual-channel thermal desorption gas chromatography for VOCs, IVOCs and SVOCs                         6539

the MFC raises the pressure in the F-CTD and forces the an-         In order to decide the final quantities of adsorbents in
alytes through the restrictive portion of the VLI and onto the   the I/VOC collector, three different collector compositions
head of the GC column over the course of the 4 min trap des-     were tested for breakthrough of the most volatile species.
orption period. The SVOC GC analysis begins, followed by         Briefly, breakthrough volume is defined as the volume of car-
sampling for the next cycle.                                     rier gas required to purge an analyte through the adsorbent
   A typical field campaign day sees round-the-clock sam-        bed, dependent on adsorbent quantity, temperature and ana-
pling and analysis as previously described, alternating sam-     lyte volatility (Definition of Breakthrough Volumes, 2020).
pling with and without the denuder inline on the SVOC            The breakthrough volume must be larger than the volume of
channel. Approximately every 2 weeks, calibrations are per-      air sampled for the most volatile analyte of interest to ensure
formed on both channels of the instrument simultaneously,        complete collection of all analytes.
lasting 10 to 12 h to generate multiple data points per com-        Breakthrough volumes were measured using a real-time
pound for a range of loadings. The stack of sodium thiosul-      VOC instrument, a proton transfer reaction mass spectrome-
fate filters is replaced every 2 weeks to avoid ozone break-     ter (PTR-MS, IONICON Analytik). The output of a specialty
through by a safe margin (Sect. 3.4). At least once per field    gas cylinder of biogenic VOCs was diluted using the custom
campaign a tank of nitrogen or zero air is plumbed into the      dynamic dilution system to deliver parts-per-billion-level
inlet and sampled on both channels in order to quantify con-     concentrations of analytes to the collector, held via PID tem-
taminants in the system.                                         perature control at 30 ◦ C. The PTR-MS inlet was connected
                                                                 downstream of the prototype collector while sampling from
2.7    Data processing                                           the controlled gas mixture at 100 sccm. For each analyte, the
                                                                 PTR-MS measured zero concentration until the breakthrough
Chromatogram integrations are performed in TERN, soft-           volume was reached, after which the downstream-measured
ware developed in Igor Pro 7 (WaveMetrics) by Isaacman-          concentration rapidly rose and plateaued. The beginning of
VanWertz et al. (2017). TERN enables automatic batch inte-       the rapid rise in concentration was taken to be the point of
gration of single compounds on hundreds of chromatograms         breakthrough.
at a time for rapid generation of compound concentration            Breakthrough volume measurement results for isoprene
timelines. Compounds are organized in templates, and the         and the sum of methyl vinyl ketone and methacrolein
ability to search commercial or custom mass spectral li-         (MVK+MACR) for several collector prototypes are shown
braries for compound identification is built in.                 in Table 1. For compactness and to reduce thermal mass to
                                                                 ensure rapid desorption, we targeted a final design containing
3     System evaluation                                          the minimum quantity of adsorbents that would safely and
                                                                 robustly meet our requirements for breakthrough volume.
The focus of development and system evaluation was on            Collector 3, which had the lowest quantities of adsorbents of
the I/VOC channel, as the SVOC channel is identical to a         the three different prototype collectors tested, had a break-
single channel of the previously developed SV-TAG instru-        through volume of twice our usual 1 L sample volume for
ment extensively documented elsewhere (Isaacman et al.,          MVK+MACR. We therefore settled on a fourth prototype
2011, 2014; Kreisberg et al., 2014; Zhao et al., 2013). De-      with quantities intermediate between collectors 2 and 3 of the
velopment for the cTAG focused on optimizing the design          most aggressive adsorbents to ensure a safe margin. We also
of the I/VOC collector, developing a calibration system for      reduced the quantity of Tenax TA, as the 10 mg final quan-
the I/VOC channel capable of using custom liquid mixtures,       tity provides more-than-sufficient breakthrough volumes for
ensuring removal of ozone for accurate collection of ozone-      the lower-volatility compounds that it collects (Tenax® TA
reactive VOCs and IVOCs and field deployment in a polluted       Breakthrough Volume Data, 2020).
urban area.
                                                                 3.2   Dynamic dilution system testing
3.1    I/VOC collector breakthrough tests
                                                                 The dynamic dilution system for evaporation of liquid I/VOC
The target collection range for the I/VOC channel was cho-       mixtures and dilution and delivery of liquid and gas calibra-
sen to include isoprene, a key biogenic C5 hydrocarbon, on       tion mixtures was evaluated for linearity and reproducibil-
the high-volatility end. The low-volatility end was chosen to    ity of delivered concentrations. In addition, for compounds
overlap with the SVOC channel range (which starts at C14 )       present in both gas cylinders and liquid solutions calibra-
by several carbon numbers and to include sesquiterpenes,         tion curves were compared for agreement. Calibrant com-
a class of C15 compounds also of biogenic origin but with        pounds from liquid (prepared in lab) and gas cylinder (Cus-
greatly varying structures and reactivity and which are far      tom mixture prepared by Apel-Riemer Environmental, Inc.,
less well-documented and understood (Bouvier-Brown et al.,       2019) mixtures were introduced at 0, 1, 2, 4, 8 and 12 ppb
2009; Chan et al., 2016; Yee et al., 2018).                      (10 times lower concentration for β-caryophyllene) with a
                                                                 total volume of air sampled of 280 cm3 with six (0, 1, 2, 4,

https://doi.org/10.5194/amt-14-6533-2021                                          Atmos. Meas. Tech., 14, 6533–6550, 2021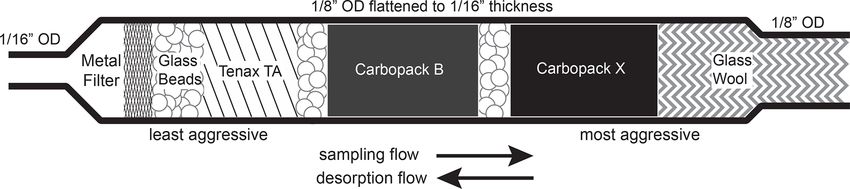
6540             R. A. Wernis et al.: Dual-channel thermal desorption gas chromatography for VOCs, IVOCs and SVOCs

Table 1. Composition of different I/VOC collectors and correspond-
ing breakthrough volumes for some of the most volatile target com-
pounds. Collector 4 is a compromise between collectors 2 and 3
with reduced Tenax TA.

 Collector no.                            1      2      3     4
 Bed material (mg of sorbent)
 Glass beads                            40      40    40     40
 Tenax TA                               20      20    20     10
 Carbopack B                            30      20    10     20
 Carbopack X                            40      30    15     20
 Breakthrough volume at 30 ◦ C (L)
 MVK+MACR                              13.2    8.7    2.0   >2
 Isoprene                              18.3   19.9    3.6   >2

8 ppb) or three (12 ppb) replicates at each level. From a sep-
                                                                     Figure 4. Calibration curves with R 2 values for (a) benzene, (b) o-
arate gas cylinder, 1 ppm of neohexane was simultaneously            xylene, (c) α-pinene and (d) β-caryophyllene in a gas cylinder (red)
sampled at a constant flow rate of 1 cm3 min−1 and used to           and in a custom liquid mixture (blue), delivered by the dynamic di-
normalize the responses from the calibrant compounds. This           lution system (Fig. 3). Normalized detector response on the y axis
step served to account for variations in sample volume and           is the integrated area of the chromatographic peak divided by that of
instrument sensitivity between samples.                              neohexane, our internal standard, on the same chromatogram. Max-
   Figure 4 shows calibration curves for benzene, o-xylene,          imum normalized detector response for a given compound ranged
α-pinene and β-caryophyllene from both the standard gas              from 0.030 (β-caryophyllene, max concentration delivered 1.2 ppb)
cylinder and the custom liquid solution evaporated and de-           to 3.0 (o-xylene, max concentration delivered 12 ppb). Addition-
livered via the dynamic dilution system. Normalized detec-           ally, for benzene all data points had the mean of the 0 ppb values
                                                                     subtracted. Points are mean values of the individual samples at each
tor response on the y axis is the integrated area of the chro-
                                                                     level with error bars representing plus or minus 1 standard devia-
matographic peak divided by that of neohexane on the same
                                                                     tion. Dotted lines are best-fit lines forced through the origin, while
chromatogram. Additionally, for benzene all data points had          R 2 values are from best fits not forced through the origin. Com-
the mean of the 0 ppb values subtracted from them to account         pounds show excellent linearity and agreement within 5 % between
for a small persistent benzene contaminant likely due to the         the gas cylinder and liquid solution.
presence of Tenax TA in our adsorbent bed (Cao and Hewitt,
1994). Points are mean values of the six individual samples at
each level (three samples at the highest level) with error bars      gas cylinder standards until and unless our liquid preparation
representing plus or minus 1 standard deviation. To evaluate         process can be modified to remove this source of error.
performance against our theoretical model of linear response            Octamethylcyclotetrasiloxane and decamethylcyclopen-
with zero response at zero concentration, dotted curves are          tasiloxane also had excellent linearity (R 2 ≥ 0.91) but were
best-fit lines forced through the origin.                            found to have about 30 % higher responses using the liquid
   These compounds show excellent linearity with R 2 ≥               solution than using the gas cylinder. This could suggest de-
0.93. Agreement between gas and liquid is within 5 %, as             pletion of these compounds in the gas cylinder, but we were
measured by the difference in the slopes of the best-fit lines.      not able to test this hypothesis.
The compounds span a range of volatility from that of a C6
alkane to a C15 alkane, demonstrating the dynamic dilution           3.3   Limits of detection
system’s suitability for evaporating and diluting IVOCs as
                                                                     Limits of detection (LODs) are species dependent. On the
well as VOCs.
                                                                     I/VOC channel, limits of detection were estimated using the
   Isoprene and methyl vinyl ketone were also analyzed and
                                                                     following formula:
found to be linear, with R 2 ≥ 0.92. However, we found con-
sistently and significantly lower responses using the liquid         LOD = 3 · σblank / m,                                             (1)
mixtures, likely indicating issues during preparation and stor-
age of the liquid solution related to the high volatility and re-    where σblank is the standard deviation of the integrated area of
activity of these compounds. For C5 to C6 alkane-equivalent-         the chromatographic blank signal (12 replicates) of the quan-
volatility compounds, we thus plan to continue to rely on            tification ion at the retention time of the analyte in question

Atmos. Meas. Tech., 14, 6533–6550, 2021                                                 https://doi.org/10.5194/amt-14-6533-2021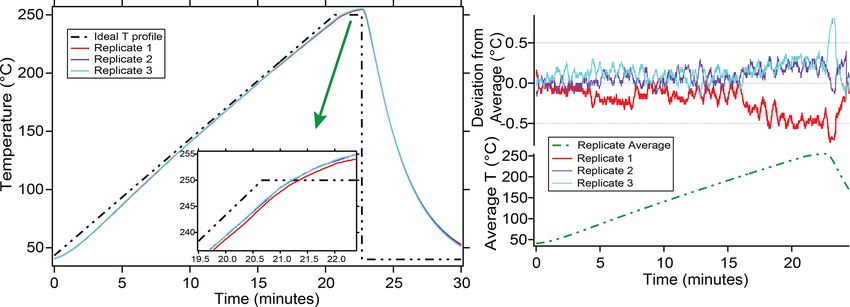
R. A. Wernis et al.: Dual-channel thermal desorption gas chromatography for VOCs, IVOCs and SVOCs                                                                         6541

Table 2. Limits of detection (LODs) for a selection of linear, branched and aromatic hydrocarbons on the I/VOC channel of cTAG. Com-
pounds are presented in order of volatility from isopentane (5 carbon atoms) to dodecane (12 carbon atoms).

         Compound                        LOD (pptv)         Compound                           LOD (pptv)         Compound                            LOD (pptv)
         Isopentane                                 2.0     2,3-Methylpentane                            3.8      o-Xylene                                          3.7
         1-Pentene                                  0.5     3-Methylhexane                               0.6      Styrene                                           7.1
         Pentane                                    2.2     Cyclohexane                                  0.9      Cumene                                            1.1
         trans-2-Pentene                            8.0     2,2,4-Trimethylpentane                       0.9      n-Propylbenzene                                   2.5
         cis-2-Pentene                              1.3     Benzene                                      90∗      Decane                                            2.7
         Isoprene                                   6.7     Heptane                                      1.1      m- and p-Ethyltoluene                             0.7
         2,3-Dimethylbutane                         2.3     Methylcyclohexane                            1.1      1,3,5-Trimethylbenzene                            1.5
         2-Methylpentane                            7.7     2,3,4-Trimethylpentane                       1.3      o-Ethyltoluene                                    1.1
         Cyclopentane                               2.4     2-Methylheptane                              1.2      1,2,4-Trimethylbenzene                            0.6
         3-Methylpentane                            2.1     3-Methylheptane                              0.9      1,2,3-Trimethylbenzene                            0.9
         1-Hexene                                   7.2     Octane                                       3.1      m-Diethylbenzene                                  0.6
         Hexane                                     1.3     Toluene                                      60∗      Undecane                                          2.6
         2,4-Dimethylpentane                        1.1     Nonane                                       2.8      p-Diethylbenzene                                  0.6
         Methylcyclopentane                         0.8     Ethylbenzene                                 3.9      Dodecane                                          2.4
         2-Methylhexane                             1.1     m- and p-Xylene                              3.5
       ∗ Contamination from the adsorbent materials used in the collector leads to elevated limits of detection for benzene and toluene, consistent with previous
       reports (Cao and Hewitt, 1994).

in units of counts, and m is the instrument sensitivity for that                          interest known to have short lifetimes with respect to reac-
analyte, i.e., the slope of the best fit to the calibration curve,                        tion with ozone, including monoterpenes and sesquiterpenes,
in units of counts pptv−1 (Foley and Dorsey, 1984).                                       and tested how placement of filters impregnated with sodium
   Limits of detection were estimated for the 44 compounds                                thiosulfate (Na2 S2 O3 ) upstream of the collector altered the
present in the Photochemical Assessment Monitoring Sta-                                   recovery of these compounds. The Na2 S2 O3 filters were ob-
tions 57-component commercial standard (Scott-Specialty)                                  tained from the Barsanti research group at UC Riverside
that are within the volatility range collected on cTAG’s                                  (Hatch et al., 2017).
I/VOC channel, including linear, branched and aromatic hy-                                   To quantify the effects of the presence of ozone in sam-
drocarbons (Table 2). The LODs range from 0.5 to 8 pptv                                   pled air, we diluted air from the output of an ozone gen-
except for benzene and toluene, which have known contam-                                  erator (model 1008-RS, Dasibi Environmental Corp) with
ination issues from the Tenax used in the collector (Cao and                              humidified zero air to achieve an ozone concentration of
Hewitt, 1994).                                                                            100 ppb ozone. We then verified that the ozone was com-
   The SVOC channel is equivalent to one channel of the                                   pletely removed by three inline filters by measuring the
SV-TAG as described in Isaacman et al. (2014). The average                                ozone concentration downstream (model 202, 2B Technolo-
limit of detection reported for that instrument is 1 to 2 ng m−3                          gies). At 1 L min−1 (20 times our ambient sampling rate),
(∼ 0.1 ppt) for a 20 min sample collected at 10 L min−1 . We                              ozone breakthrough through a stack of three Na2 S2 O3 filters
determined that the LOD for the SVOC channel on cTAG de-                                  occurred after 8 h, indicating a single filter stack can be used
termined according to Eq. (1) is consistent with that reported                            without breakthrough for 9600 min, or about 20 d of contin-
previously for SV-TAG.                                                                    uous operation.
                                                                                             After verifying the efficient removal of ozone by the fil-
3.4   Evaluation of ozone removal on the I/VOC channel                                    ter stack, we combined 9 L min−1 of 100 ppb ozone with the
                                                                                          1 L min−1 output from our dynamic dilution calibration sys-
Ozone has been shown to be able to penetrate standard                                     tem described in Sect. 2.5. Using that calibration system, we
VOC sampling inlets and react with certain analytes col-                                  evaporated a liquid mixture of sesquiterpenes and other com-
lected on adsorbent beds like ours (Calogirou et al., 1996;                               pounds to achieve a concentration of 5.60 ppb, which once
Helmig, 1997; Pollmann et al., 2005). A common practice for                               combined with the 9 L min−1 zero air was reduced to 560 ppt
ozone removal is to pass the sample flow through a sodium-                                for sampling.
thiosulfate-impregnated filter upstream of the adsorbent bed                                 We sampled this liquid mixture onto the I/VOC channel
(Helmig, 1997). Pollmann et al. (2005) demonstrated that                                  under four different conditions: without ozone and without
this technique is effective at preventing ozone reaction arti-                            a Na2 S2 O3 filter, without ozone and with the filter, with
facts for some sesquiterpenes as well as the previously stud-                             100 ppb ozone and without the filter, and with 100 ppb ozone
ied monoterpenes and other hydrocarbons. We explored the                                  with the filter. This allowed us to establish (1) whether an
effects of ozone on the recovery of a suite of compounds of

https://doi.org/10.5194/amt-14-6533-2021                                                                           Atmos. Meas. Tech., 14, 6533–6550, 2021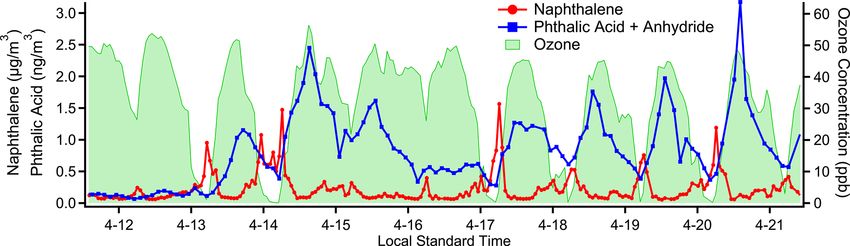
6542            R. A. Wernis et al.: Dual-channel thermal desorption gas chromatography for VOCs, IVOCs and SVOCs

Figure 5. Results of evaluation of effectiveness of sodium thiosulfate filter in mitigating the effects of ozone on reactive analytes during
collection of VOCs and IVOCs. Error bars represent plus or minus 1 standard deviation of six replicate measurements. Panel (a) confirms
that in the absence of ozone, the filter does not affect the detected quantities of each compound, except for slight (< 15 %) losses of IVOCs
with the filter present, leading to response ratios greater than 1. Panel (b) demonstrates that the filter prevents substantial losses of reactive
species in the presence of ozone, confirming that without preventive measures ozone can significantly deplete certain analytes. Values are
compared with published lifetimes with respect to reaction with ozone, with overall qualitative agreement. Published lifetimes are from
Atkinson and Arey (2003) unless above 10 000 min or otherwise indicated. (a) Pollmann et al. (2005). (b) No published experimental value,
assumed reactivity equal to that of the stereoisomer aromadendrene. (c) Ham (2013).

ozone removal method is needed in our instrument for ac-                   3.5    Region of sensitivity overlap
curate quantification of ozone-reactive species such as some
sesquiterpenes and (2) whether the presence of the filter al-
tered the concentrations of non-ozone-reactive VOCs and                    Some of the chemical compounds with alkane-equivalent
IVOCs or of reactive VOCs and IVOCs in the absence of                      volatility between that of n-tetradecane and n-hexadecane
ozone.                                                                     can be detected and quantified on both the I/VOC and the
   Figure 5 shows the effects of the Na2 S2 O3 filter on sev-              SVOC channels. Comparing quantifications of such com-
eral analytes of interest with and without ozone. In the ab-               pounds between channels can serve as a useful check of in-
sence of ozone, VOC and IVOC concentrations were un-                       strument performance. However in practice the number of
perturbed by the presence of the filter except for manage-                 compounds suitable for such an analysis is small, and for
able losses of lower-volatility compounds when the filter was              any given ambient data set there may be none. One reason
present (Fig. 5a). In the presence of ozone, placement of the              for this is the 200-times-larger sample volume collected on
Na2 S2 O3 -impregnated filters in the sampling flow upstream               the SVOC channel, so that some compounds that are eas-
of the collector prevented degradation (Fig. 5b). In general,              ily quantifiable on the SVOC channel are below detection
losses of analytes in the absence of the filter were greater for           limit on the I/VOC channel. Compounds which are reactive
compounds with lower atmospheric lifetimes with respect to                 with ozone on timescales of under an hour or so, includ-
reaction with ozone.                                                       ing many sesquiterpenes (Fig. 5), must be quantified on the
   The results imply having a Na2 S2 O3 -impregnated filter in-            I/VOC channel where ozone is removed at the inlet. Highly
line improves quantification of ozone-reactive species with-               polar species may not elute on the I/VOC column; the SVOC
out significant downsides. However, prior literature suggests              channel with its online derivatization is more appropriate in
some very polar compounds, not tested in this experiment,                  this case. Thus there is usually reason to choose one channel
may become trapped on the filter, hindering their measure-                 over the other for quantification purposes.
ment (Hatch et al., 2017). Such compounds are unlikely to                     A survey of compounds from the ambient data set from
elute on our GC column, which is optimized for less-polar                  the cTAG deployment in McCall, Idaho, for the 2019 Fire
species. During normal operation of the instrument, we thus                Influence on Regional to Global Environments and Air Qual-
include a filter inline.                                                   ity (FIREX-AQ) field campaign was conducted to test cross-
                                                                           channel agreement for compounds in the volatility overlap

Atmos. Meas. Tech., 14, 6533–6550, 2021                                                        https://doi.org/10.5194/amt-14-6533-2021
R. A. Wernis et al.: Dual-channel thermal desorption gas chromatography for VOCs, IVOCs and SVOCs 6543
Figure 6. Bornyl acetate measured on the I/VOC and SVOC chan-
nels of cTAG during FIREX-AQ. Dashed lines represent ±4.8 ppt
(3 times the I/VOC channel limit of detection for bornyl acetate). A
total of 96 % of data points fall within the region bounded by the
dashed lines. R 2 is 0.79.
region. Of the compounds found, all but one, bornyl acetate,
were subject to one of the restrictions listed above.
Bornyl acetate (C12 H20 O2 ) is found in essential oils from
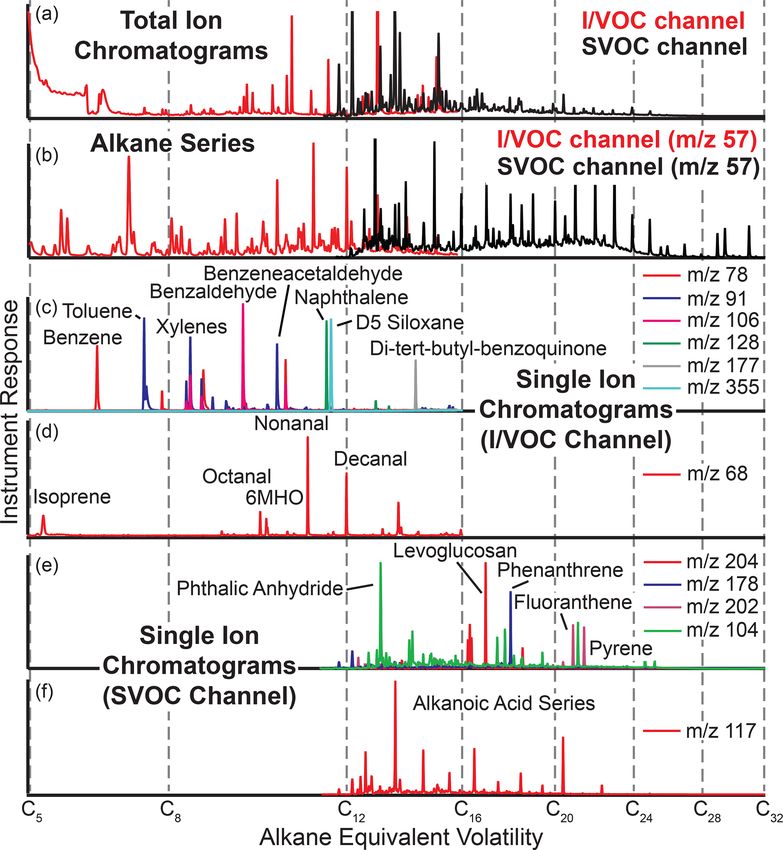
pine trees (Garneau et al., 2012). Though it elutes close to Figure 7. Example chromatograms from cTAG. Panels (a) and (b)
from FIREX-AQ 2019 in McCall, Idaho, demonstrate the range of
tridecane, which is outside the reliably quantifiable range
volatility covered by the two channels, including their overlap re-
on the SVOC channel, we were able to quantify it on both gion. Single ion chromatograms (panels c, d and f from Berkeley,
the I/VOC and SVOC channels in McCall, Idaho, during the California, and e from Livermore, California) show examples of the
2019 FIREX-AQ field campaign. The concentration ranges compound classes observable by cTAG, including aromatics, poly-
from 0.1 to 16.5 ppt as measured on the SVOC channel. The cyclic aromatic hydrocarbons, organic acids and anhydrosugars.
correlation of concurrent sampling points on both channels
is shown in Fig. 6. The I/VOC and SVOC channels agree on
average within 11 %, with R 2 = 0.79 and 96 % of the data
points agreeing within ±4.8 ppt (3 times the I/VOC channel
limit of detection for bornyl acetate). We consider this ex-
cellent agreement between the two channels given that the
sample sizes differ by more than 2 orders of magnitude, they
are calibrated independently and all data points are within a
factor of 10 of the detection limit on the I/VOC channel. Figure 8. Concentration timelines for naphthalene, a primary emis-
sion from vehicle exhaust measured on cTAG’s I/VOC chan-
3.6 Measurements of ambient air nel, and the sum of phthalic anhydride and phthalic acid, sec-
ondary photooxidation products of naphthalene detected on cTAG’s
The cTAG was deployed in Livermore, CA in April 2018 for SVOC channel. Another secondary compound, ozone, measured at
its first field test. This test was undertaken to evaluate the a nearby Bay Area Air Quality Management District monitoring
stability of instrument performance during round-the-clock site, provides an independent indication of photochemical activity.
automated operation and demonstrate the capability to mea-
sure concentrations of a variety of compound classes from
C5 to C32 alkane-equivalent volatility. The instrument was levels in the Bay Area (Knoderer et al., 2018). In addition,
deployed approximately 100 m from a Bay Area Air Qual- Livermore has substantial wood burning for heat during win-
ity Management District monitoring site to make use of their ter. An analysis of a subset of VOCs, IVOCs and SVOCs
air quality measurements for comparison (specifically, ozone measured in Livermore by cTAG is presented to demonstrate
and ambient temperature reported here). Livermore is a val- some of the analytical capabilities of this instrument.
ley city on the eastern and downwind edge of the San Fran- cTAG is sensitive to a wide variety of organic compound
cisco Bay Area, where pollution outflow from the region classes. Figure 7 shows some sample chromatograms from
combined with optimal conditions for secondary photochem- Berkeley, California; ambient air sampled from outside the
ical smog formation frequently leads to the highest ozone lab window; the Livermore 2018 deployment; and McCall,
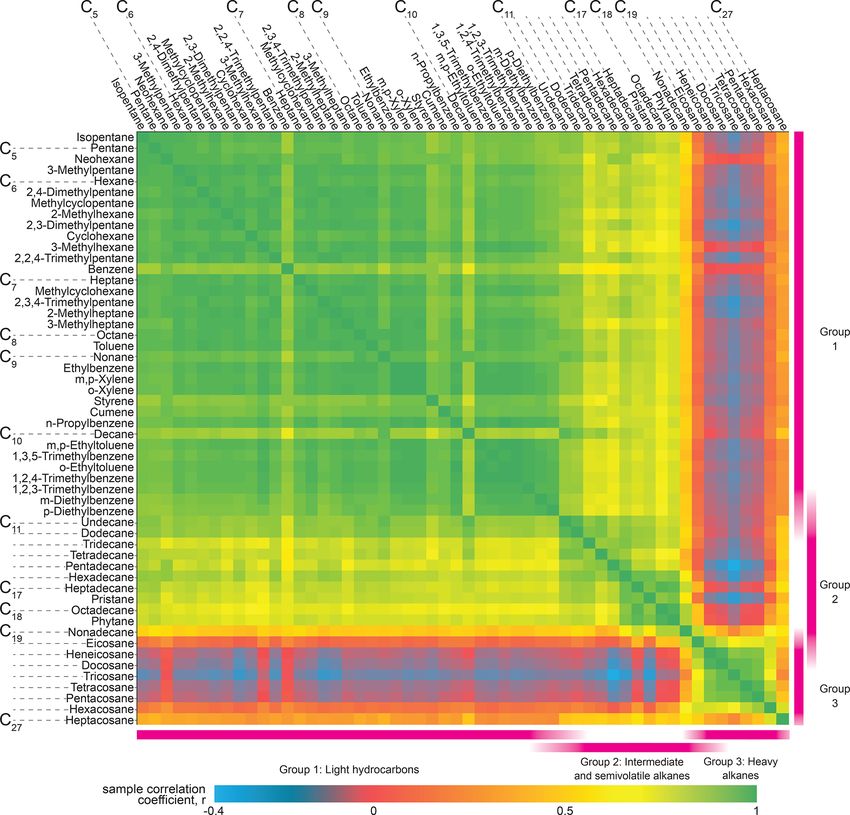
https://doi.org/10.5194/amt-14-6533-2021 Atmos. Meas. Tech., 14, 6533–6550, 20216544 R. A. Wernis et al.: Dual-channel thermal desorption gas chromatography for VOCs, IVOCs and SVOCs Figure 9. Pearson’s R correlation matrix for a suite of petroleum-derived compounds observed by cTAG in Livermore, California, between 11 April and 21 April 2018, ordered by volatility. Two distinct groupings emerge from C5 alkane-equivalent volatility to about C11 and C20 to C26 , with a third less distinct but still prominent grouping from approximately C11 to C19 . Idaho, for the 2019 FIREX-AQ field campaign highlighting cTAG can observe gas-phase chemicals and many of their compounds of interest. The total ion chromatograms and se- oxidation products in gas and particle phases. Naphthalene is lected ion chromatograms with a mass-to-charge ratio of 57, a gas-phase product of incomplete combustion of fossil fu- the dominant ion in most alkanes, show the volatility range els (Baek et al., 1991) and in urban areas has been observed detected as well as the overlap region of both channels be- to primarily originate from vehicle emissions (Howsam and tween C14 and C16 alkane-equivalent volatility. Common air Jones, 1998; Lim et al., 1999). Phthalic anhydride is a ma- toxics such as benzene, toluene, ethylbenzene, xylene, poly- jor gas-phase photooxidation product of naphthalene, and cyclic aromatic hydrocarbons and quinones are readily visi- phthalic acid has been found in secondary organic aerosol ble, as well as biogenic terpenes and aldehydes, organic acids formed from naphthalene photooxidation (Chan et al., 2009; and polar biomass burning markers. Compounds as polar as Kleindienst et al., 2012; Wang et al., 2007). cTAG is sen- glucose (five hydroxy groups) can be detected on the SVOC sitive to naphthalene on the I/VOC channel and the sum of channel. phthalic anhydride and phthalic acid on the SVOC channel. Atmos. Meas. Tech., 14, 6533–6550, 2021 https://doi.org/10.5194/amt-14-6533-2021
R. A. Wernis et al.: Dual-channel thermal desorption gas chromatography for VOCs, IVOCs and SVOCs                               6545

                                                                      lation matrix, but semivolatile compounds that have no other
                                                                      major source still correlate well with each other.

                                                                      4   Summary and concluding remarks

                                                                      The Comprehensive Thermal Desorption Aerosol Gas Chro-
Figure 10. Timelines for characteristic species from each of the      matograph is a novel instrument capable of measuring non-
three main groupings of compounds evident in the correlation ma-      polar and some polar organic compounds as well as some
trix (Fig. 9). The two more volatile groups, represented by octane    more oxidized semivolatile organics from C5 through C32
and heptadecane, tend to peak in the early morning, consistent with   alkane-equivalent volatility on two separate channels con-
morning-rush-hour cold-start emissions. The least-volatile group,     nected to a single HRToFMS. This set of quantifiable com-
which includes tricosane, appears to have an evaporative source as    pounds encompasses many key VOC pollutants, reactive in-
it tracks closely, but slightly delayed, with ambient temperature.    termediates, and secondary products, all captured at hourly
                                                                      time resolution. The expanded range of measurable com-
                                                                      pounds allows for more robust source categorization, with
                                                                      detailed chemical specificity of each identified source cate-
(We have found through laboratory testing of an authentic
                                                                      gory.
phthalic acid standard that phthalic acid converts to and is
                                                                          Building off development of previous TAG family instru-
detected as phthalic anhydride in cTAG.) As Fig. 8 shows,
                                                                      ments, development for cTAG focused on the I/VOC chan-
the precursor and products have extremely distinct tempo-
                                                                      nel as well as miniature gas chromatographs to enhance field
ral profiles, with naphthalene concentrations elevated at night
                                                                      portability of the instrument. The I/VOC collector is opti-
and in the early morning hours while the phthalic anhydride
                                                                      mized for collection of C5 through C16 alkane-equivalent-
plus phthalic acid signal rises in the early to mid-afternoon,
                                                                      volatility organics to capture major biogenic VOC and IVOC
consistent with secondary formation and in agreement with
                                                                      emissions and ensure overlap with the SVOC channel collec-
observations at other field sites (Williams et al., 2010).
                                                                      tion range. The dynamic dilution system with controlled liq-
   An analysis of straight-chain alkanes along with some aro-
                                                                      uid evaporation developed in house is shown to produce sta-
matics, alkenes and branched alkanes demonstrates cTAG’s
                                                                      ble, linear calibration curves and allows for maximum flex-
volatility range and highlights the different source cate-
                                                                      ibility in calibration of the I/VOC channel, including quan-
gories for sub-groups of this set of compounds. The cross-
                                                                      tification of commercially available VOCs and IVOCs not
correlation matrix (Fig. 9) indicates three distinct groupings
                                                                      commonly available in calibration gas cylinders or which are
of compounds. The first group is characteristic of gasoline
                                                                      difficult or prohibitively expensive to put in such cylinders.
emissions, spanning a volatility range from below C5 alkane-
                                                                      Placement of a Na2 S2 O3 -impregnated filter in the sampling
equivalent volatility to about C11 (Gentner et al., 2013) and
                                                                      path for the I/VOC channel is shown to effectively remove
including linear, branched and cyclic alkanes as well as aro-
                                                                      ozone without removing appreciable amounts of analytes of
matics. It shows short periods of elevated levels in the early
                                                                      interest. Example chromatograms, timelines and correlations
morning consistent with a morning rush hour traffic pattern
                                                                      for a suite of compounds at a polluted urban field site demon-
(Fig. 10). The lack of a similar peak near the end of the day
                                                                      strate some of the potential for analysis of the data sets pro-
could point to the outsized contribution of cold-start emis-
                                                                      duced by this instrument.
sions to total VOC emissions from gasoline vehicles (Drozd
                                                                          Comprehensive, speciated measurements of reactive or-
et al., 2016, 2019), as the sampling site was located in a pri-
                                                                      ganic carbon across the full range of volatility are required to
marily residential area. There is also a well-defined group
                                                                      fully understand the atmospheric processes that lead to sec-
from C20 to C26 alkanes with a smooth diurnal variability and
                                                                      ondary aerosol formation and dictate the atmospheric life-
daily maximum concentration in the late afternoon (Fig. 10),
                                                                      times of key atmospheric oxidants (Heald and Kroll, 2020;
consistent with a petroleum-based evaporative source such as
                                                                      Hunter et al., 2017). Moreover, the organic composition and
asphalt (Khare et al., 2020). The afternoon peaks in concen-
                                                                      thus the dominant atmospheric processes are likely to vary
tration result in a clear anti-correlation with the rest of the
                                                                      greatly in different environments (e.g., remote, forested, ru-
alkanes in Fig. 9 (blue and dark red areas). The third group
                                                                      ral/agricultural, urban), and current science lacks such com-
is less pronounced but follows a roughly similar pattern to
                                                                      prehensive measurements across these different types of sites
the high-volatility source category and likely corresponds to
                                                                      (Heald and Kroll, 2020). The cTAG is designed for field
diesel fuel emissions, which typically span a volatility range
                                                                      portability and speciated measurement of a significant frac-
from about C10 to C22 , with minor contributions from C23 –
                                                                      tion of the total reactive organic carbon, making it an ideal
C25 alkanes (Gentner et al., 2013; Isaacman et al., 2012;
                                                                      choice for helping to close this gap in our current scientific
Drozd et al., 2021). Our data suggest that overlapping con-
                                                                      understanding.
tributions from gasoline and the petroleum-based evaporative
sources make this source group less well-defined in the corre-

https://doi.org/10.5194/amt-14-6533-2021                                                Atmos. Meas. Tech., 14, 6533–6550, 2021
You can also read