DETERMINANTS OF AUDIT QUALITY INGOVERNMENTAL INSTITUTIONS
←
→
Page content transcription
If your browser does not render page correctly, please read the page content below
Studies in Economics and Business Relations
              https://sebr.sabapub.com
              ISSN:2709-670X
2022 Volume 3, Issue 1 : 1 ± 16
DOI : 10.48185/sebr.v3i1.382

DETERMINANTS OF AUDIT QUALITY
INGOVERNMENTAL INSTITUTIONS
Moatasem M. Qaid1, Meana Wadgule2 , Maged S. D. Khaled3
1
  Research Scholar,Department of Commerce,Dr. Babasaheb Ambedkar Marathwada University, India
2
  Professor, Department of Commerce,Dr. Babasaheb Ambedkar Marathwada University, India
3
  Department of Accounting ,Gazira College of medical science & technology University, Sudan

Received: 26.10.2021 ‡ Accepted: 28.11.2021 ‡ Published: 27.01.2022   ‡   Final Version: 27.01.2022

Abstract: This study investigates the factors that impact the quality of government internal audit
workpaper review. Numerous concerns have been expressed about the quality of government
audits in recent years. Audit quality is much debated, but little understood; and there is little
agreement, given the concept 's diversity, on how audit quality should be interpreted, let alone
assessed. Audit standard vision may rely heavily on what eyes one looks. Consumers, auditors,
policymakers, and other stakeholders can have somewhat different opinions about what defines
audit quality, which may affect the type of metrics that can be used to assess audit quality. The
presumption in international literature on culture and audit procedure is that culture influences the
audit environment, and consequently the audit process outcome. The theoretical model suggested
different variables in the above literature review. Several factors in various work environments
affect audit results, but based on little empirical research, Yemen 's government audit service. The
importance of these factors impacting audit performance of the Avi Yemeni government sector
must be discussed. The goal behind quality assurance is to help ensure that audit product and
services follow proven international best practices and stakeholder expectations, as opposed to
criticising individual audit processes. The results of the study found that performance, legislation,
training and top management had an impact on effectiveness.

Keywords:Audit Quality, Government institutions, Legislations, Performance, Training, Top
management support Introduction

1. Introduction
The audit is an independent audit of the organisation in which the auditor gathers unbiased reports
of the underlying company handling the funds (IFAC, 2001). The primary purpose of auditing is to
add business credibility and transparency to the public or private sector. The audit is used as a tool
to keep public and private institutions accountable.
Audit provides transparency, openness, justice and fairness to organisational processes. The word
'audit standard' is a contentious topic for public and private sector organisations in Pakistan. There
is no clear concept of audit quality, but according to De Anglo (1981), audit quality is a joint
likelihood that audit results will be accurately reported in the public good accounting context. The
accuracy of the audit must be ensured because it helps to minimise the issue of the public service
agency. The Agency's dilemma emerges when ministry objectives do not respect public and
government interests. Wheelen and Hunger (2002 ) concluded that the Agency's dilemma occurs
when management can not take responsibility for where funds have been directed to achieve the
desired objectives. According to the Internal Auditor Institute (2006), the main agent structure
occurs in the public sector. Government is a public agent as it receives public funds based on taxes.
2F. Author et al.:Manuscript Template: Preparation of Manuscript for SABA Journals
Ministries then act as political officers to raise government funds for public health. Government
auditors shall operate on behalf of the Government and oversee the ministries in this dual agent
relationship. As a consequence, audit performance is a mechanism to enhance / weaken public
trust.
In order to preserve and enhance audit accuracy, it is necessary to focus on a variety of internal and
external environmental variables. Focus on the pre-study feature. Various factors influencing audit
efficiency, such as audit tenure, top management support, audit qualification, work environments,
job autonomy (Zahargier&Balasundaram, 2011; Baron &Greenbery, 2008; Elder & Davis, 2007).
Moreover, Yemen 's corruption rate is high, especially at the government level, due to massive
corruption, resource constraints, lack of auditor training, the use of manual auditing, lack of job
autonomy, inadequate actions of audited bodies, and lack of top management support (Masood &
Lodhi, 2015). Only government auditors may be appointed to oversee ministries, establishing a
monopoly on government auditors. Lack of government-level competitiveness hinders audit
results. Moreover, the working conditions of workers in state-owned entities are not yet
satisfactory. Transparency International ranked Yemen 177th among the most corrupt countries in
2019. And Yemen is one of the poor nations that is currently dealing with the scourge. Seven years
of war, no peace at all. This role can be further mitigated by successful investigations of public
sector entities that misuse public funds for personal welfare. Decide, for a corruption-free state, the
variables influence the level of the audit and to what degree. The goal of this research is therefore
to address factors affecting the efficiency of audits in public sector institutions in Yemen.
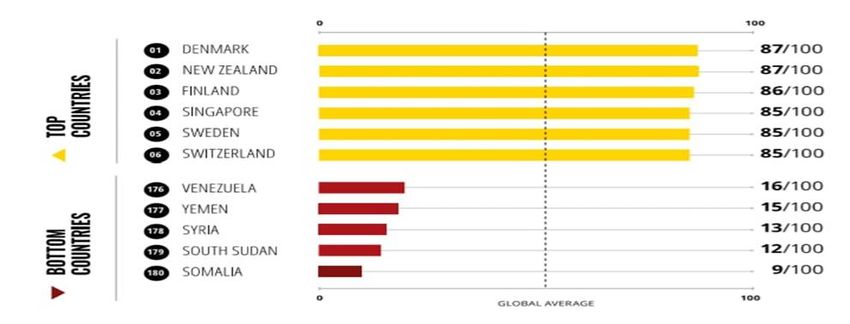
Sources: https://www.transparency.org/
Figure 1. Corruptions level in public sectors in Yemen
According to analysts and business people, their alleged degree of corruption in the public sector is
180 countries and territories. Zero to 100 is used where zero is very corrupt and 100 is very clean.
Approximately two-thirds of countries score under 50 at this year's CPI, with an overall score of
just 43.
Similar to previous years, evidence shows that despite some progress, most countries are still
failing to successfully combat corruption in the public sector. New Zealand and Denmark are the
top countries, 87 each, led by Finland (86), Singapore (85), Sweden (85) and Switzerland (85).
Somalia, South Sudan and Syria are the lowest countries with 9, 12 and 13 countries, respectively.
These countries are closely followed by Yemen (15), Venezuela (16), Sudan (16), Equatorial
Guinea (16) and Afghanistan (16) (For auditors specifically responsible for scrutinisingStudies in Economics and Business Relations3 government ministries and agencies in Taiz City and Yemen, in particular , this study has its own importance in terms of raising visibility. 2. Literature reference Audit quality is relevant in both the public and private sectors, but there is no signal model available for the recognition and operationalization of audit quality. The recognition of the term "audit" is important to assess the relationship between the working conditions and the consistency of the audit. According to the International Federation of Accountants ( IFAC), the audit is an independent entity study where the auditor gathers the impartial findings of the underlying company's distribution of funds. The audit purpose would be met if the auditor preserves credibility and accuracy in the presentation of audit reports. Audit accuracy is specifically influenced by the reputation of the auditor. The level of audit is calculated by honesty, happiness and justice (DeAngelo, 1981). Auditing is an entity's transparency mode that has become relevant in both the government and the private sector after corruption scandals. Government and private sector governance would be strengthened if the technical and personal past of auditors is good. There are a number of factors in the operating environment of the enterprise that directly impact audit results. Duncan (1997 ) described the organisational environment as a multidimensional term that is difficult to operate in various work settings. Working environment plays an important role in creating professionalism and emotional independence to carry out audits successfully. To attain optimal performance, top management , corporate philosophy and financial incentives have a positive effect on employee efficiency (Saeed, Mussawar, Lodhi, Iqbal, Nayab& Yaseen, 2013). Top management assistance is one of the most important factors of performance for any organisation. Top management support is described as devoting time to updating proposals. A analysis of 28 Indonesian accounting firms showed that independence, experience and transparency had a major effect on audit performance (Suyono, 2012). Promotion, salary, employment security, equality, workers and higher relationships are core components of the working atmosphere (Saeed, Lodhi, Iqbal, Nayab, Mussawar& Yaseen, 2013). Muda, Rafiki, Harahap (2014) established a model in which independent variables were job anxiety, motivation, and degree of touch, but the extent of worker coordination was a strong determinant of perceived performance. Ram, Bhargavi, Prabhakar, 2011. The work atmosphere has had an effect on improving the efficiency and engagement of workers. Another study showed that job performance was favourably influenced by good leadership abilities and appreciation of work atmospheric change (Imran, Fatima, Zaheer, Yousaf & Batool, 2012). Al-Khadash, Al-Nawas, and Ramadan (2013 ) studied the quality determinants of the audit in Jordan and observed that the quality of the audit was dramatically influenced by the pay, freedom, integrity and credibility of the auditor. Adeyemi, Okpala, and Dabor (2012 ) conducted research in Nigeria in which audit effectiveness was influenced by the educational level of auditors, the tenure span, and the degree of involvement of auditors in the advisory services of auditors. In enhancing audit efficiency, Baharudin et al ( 2014) emphasised the importance of the credibility, objectivity and management support of auditors. In addition to these factors, employee success is influenced by employee attitude, family history, beliefs, fitness, family support and personal attention (Mathur & Gupta, 2012). Statistically, Mehmood, Irum, Ahmad, and Sultana (2012) have shown that employee productivity is more influenced by pay, autonomy, promotional opportunities than by the effects of physical conditions in Pakistan. Working conditions, pay , promotion, employment security, recruiting and empowerment of employees are core concerns for any employee in nearly any corporate setting, whether in the public or private sector (Masood, Ain, Aslam & Rizwan,
4F. Author et al.:Manuscript Template: Preparation of Manuscript for SABA Journals

2014; Parvin & Kabir, 2011; Neog&Barua, 2014). A similar model has been used in Saudi Arabia,
where compensation, promotion and behaviour have been shown to have a substantial effect on
employee satisfaction and efficiency (Alshitri, 2013).
Audit quality is much discussed, but little understood; and there is little agreement, given the
diversity of the definition, about how audit quality should be interpreted, let alone assessed. Audit
standard vision can rely heavily on what one 's eyes look like. Consumers, auditors, regulators and
other stakeholders may have very different opinions about what dictates the quality of the audit,
which can affect the type of metrics that may be used to assess the quality of the audit. DeAngelo
(1981 ) described audit efficiency as the market-assessed joint likelihood that the auditor identifies
and exposes irregularities in the financial statements. Customers of financial reporting may
conclude that lack of content distortions means good audit performance. The auditor conducting
the audit would describe the high standard of the audit as meeting all the tasks requested by the
audit methodology of the organisation. The accounting company will judge the good standard of
the audit as being covered from the challenge by the investigation or the court. Regulators should
consider a high-quality audit to meet with ethical practices. Finally, a high-quality audit can be
seen by society as preventing business or sector economic problems. In the end , various views say
different metrics. Chan and Wong (2002 ) indicated that, while not quantitative, audit reliability
influences the probability of a good discovery of a difference between the favourable report of the
business and the true nature of the commodity. The inferred common relationship between these
two claims is the capacity of the auditor to perform his professional duties by applying the audit
protocol to find content errors.
Auditor's tenure and audit quality the question of whether the audit firm's tenure has had an impact
on audit efficiency has long been one of the key concerns of auditing legislation. Some contend
that long tenure as auditor reduces autonomy and objectivity, while others claim that long tenure
increases auditor expertise and integrity. Mgbame, Eragbhe and Osazuwa (2012) published an
empiric study of the relationship between audit tenure and audit performance. The technique of
estimation of the Binary Logistic Model was used to determine the alleged correlation between the
auditor's tenure and audit performance. The research also covered other explanatory causes, such
as Asset Returns (ROA), Board Independence, Director Ownership, and Board of Directors
Composition. Their results showed a negative relationship between audit tenure and audit
performance, although the variable was negligible. The other explanatory factors considered in
addition to the performance of the auditor were found to be inversely linked to the results of the
audit, with the exception of Stock Returns, which had a positive impact. Onwuchekwa, Erah and
Izedonmi (2012) investigated the relationship between the required rotation and the consistency of
the audit. Southern Nigeria has obtained data from distributing questionnaires to investors,
lecturers, consultants, accountants and auditors. Using percentage analysis, the extracted data
where evaluated while binary logistic regression technology was used to estimate the model. They
tested the hypothesis that Nigeria's obligatory audit rotation had no meaningful correlation with
audit results. The binary logistic order of the regression found a negative correlation between the
mandatory rotation of the audit and the accuracy of the audit. They outlined other ways to increase
audit efficiency, such as strengthening the audit committee board and promoting joint audits to
discourage the monopoly on audit opinions. Siregar, Amarullah, Wibowo and Anggraita (2012 )
conducted their research in the Indonesian setting in which regulators made it compulsory for
public accountants to be named after three ( 3 ) years and for public accounting firms to be
nominated after five ( 5 ) years. The purpose of their research was to examine the impact of the
rotation of auditors on the audit results (before and after the required audit regulation) and the
auditing of public accountants and public accounting companies. Their findings found that the
Studies in Economics and Business Relations5

required rotation of the auditor did not increase the performance of the audit; nor did the shortened
period of the audit (partner and company level) improve the consistency of the audit. Al-
Thuneibat, Al-Issa and Ata-Baker (2011) studied the effects of the audit firm-client relationship
and the size of the audit firm on audit results in Jordan. Scientists use the quadratic method with
some variations to test their hypotheses. The two companies whose shares were listed on the
Amman Stock Exchange during the years (2002-2006) included the population of the survey. Their
statistical data analysis found that the length of the audit company had a negative effect on audit
results (negative). As a result of the rise in the volume of discretionary accruals, the audit output
declined when the audit company's term was extended. Meanwhile, their data review did not show
that the size of the audit firm had any substantial effect on the relationship between audit firm
tenure and audit results.
Hsieh (2011 ) investigated the presence of a relationship between evidence of reduced audit
efficiency, calculated by estimated budgetary accruals, and the tenure of an audit partner with a
particular client, using data collected from various Taiwanese offices of four major international
audit firms from actual audits. He used the Jones cross-section model for his study and observed
that the calculated budgetary accumulations were substantially and adversely linked to the tenure
of the lead audit partner, given a single client. Increased associate tenure, he perceived an
improvement in audit efficiency. His audit partner findings were consistent with the findings of
Geiger and Raghunandan (2002) on the tenure of audit firms; Johnson, Khurana, and Reynolds
(2002); Myers, Myers, and Omer (2003); and Nagy (2005) findings and further expanded their
scope by focusing on individual audit partners rather than audit firms.
U.S. research has empirically demonstrated that teamwork and job stability are positive, while poor
communication and lack of management support are negative predictors of employee happiness
(Haenisch, 2012). Working climate, compensation and development in all conditions typically
have an effect on work productivity (Hong, Hamid & Salleh, 2013). In Jakarta, Pitaloka and Sofia
(2014), a report was conducted finding a good test of the efficiency of internal auditors in the work
environment. Wadhwa, Verghese and Wadhwa (2011) have identified three classes of behavioural,
organisational and environmental variables to determine the effect of the most critical factors on
employee performance. Behavioral factors are more responsible for employee results than for the
other two groups. What's more, a fine. Physical workplaces, adequate ventilation, office
architecture and good lighting will create safe minds that will improve audit effectiveness and
performance (Chandrasekar, 2011; Naseem, Sikandar, Hameed & Khan, 2012). Best practises in
the area of human capital and effective contact networks are prospects for positive outcomes (Jaen
& Kaun, 2014; Ajala, 2012). Deis and Giroux (n.d) indicated that initial ties with the auditor had
undermined audit performance, although low audit fees had little effect on audit results and audit
efforts.
In the study of the literature referred to above, the theoretical model proposed different variables.
Several factors in various work environments have an effect on audit results, but the Yemeni
government audit department is focused on little empirical research. The relevance of these factors
impacting Avi Yemeni government audit performance needs to be discussed. Current research
work is aimed at quantitatively and qualitatively defining and evaluating certain key variables that
have an impact on Yemen 's audit effectiveness. The path between the variables under analysis is
seen in Figure 1. The performance of auditors and the performance of the legislation, planning and
development, top management support and audit quality are hypnotised. The following test
questions were then proposed:
6F. Author et al.:Manuscript Template: Preparation of Manuscript for SABA Journals

Hypotheses
Ho1: There is no significant impact of Performance of auditors on Audit Quality.
Ho2: There is no significant impact of legislation performance on Audit Quality.
Ho3: There is no significant impact of Training and development on Audit Quality.
Ho4: There is no significant impact of Top management support on Audit Quality.

              Performance of auditors

             Legislation performance
                                                                                         Audit Quality

             Training and development

             Top management support

                                              Figure 2: Proposed model

3. Methodology
The information was gathered from 181 employees of a Yemeni government agency. Data was
gathered via a questionnaire. The impact of determinants of audit quality in governmental
institutions was examined using a five-point Likert scale ranging from strongly agreed to strongly
disagree. A specific set of questions was assigned to each variable. The purpose of this work is to
see if the determinants of audit quality in governmental institutions differ significantly. The study
aims to:
‡ To study the impact of Performance of auditors on Audit Quality.
‡ To study the impact of legislation performance on Audit Quality.
‡ To study the impact of Training and development on Audit Quality.
‡ To study the impact of Top management support on Audit Quality.
The data was processed using SPSS version 23, and all trials were carried out in a 5% sense
standard. The survey's core demographic characteristics were identified using descriptive numbers.

3.1. Respondents profile

                                       Table 1.Demographic Highlights

                                                                                  No.of
  Items                                           Variable                                         Percentage
                                                                               Respondents
                                                    Male                             143                 95.3
  Gender
                                                   Female                            6                   4.0
Studies in Economics and Business Relations7
Less than 25 years old 8 5.3
From 26 to 35 years old 67 44.7
Age
From 36 to 45 years old 47 31.3
Over 46 years old 28 18.7
Accounting 31 20.7
Business Administration 4 2.7
Economic 8 5.3
Scientific Qualification Statistic 4 2.7
Administrative costs and
8 5.3
accounting
Another 95 63.3
Less than five years 39 26.0
From six to ten years 54 36.0
Years of experience From eleven to fifteen years 18 12.0
From sixteen to twenty years 15 10.0
more from twenty years 24 16.0
Intermediate Diploma 8 5.3
Higher Diploma 16 10.7
Qualification
Bachelor's degree 111 74.0
Master 15 10.0
Demographics Highlights
‡ Male respondents were higher than the female respondents. (95.3%)
‡ Majority of the respondents were in the age group of from 26-35 years old, followed by from 36
to 45 years old, over 46 years old and less than 25 years old.
‡ Majority of the respondents were from another field (63.3%) followed by accounting (20.4%)
and the least number were from business administration and statistic. (2.5%)
‡ Majority of the respondents were from six to ten years (36.0%) followed by less than five years.
(26.0%)
‡ Majority of the respondents were having bacheORU¶V GHJUHH
4. Analysis and discussion
4.1. Reliability
A reliability test is commonly performed to test the reliability of the survey instrument. Reliability
refers to the repeatability, stability or internal accuracy of a questionnaire, according to Jack &
Clarke (1998). A measure that is popular in reliability analysis was introduced by Cronbach
(1951). One of the most common ways of demonstrating the reliability of the survey instrument is
Cronbach's alpha statistic. This statistic uses interrelationships to decide that the same domain is
measured by the constituent object. According to Kline (1999), in the case of intelligence tests, the8F. Author et al.:Manuscript Template: Preparation of Manuscript for SABA Journals
acceptable value of alpha in reliability analysis is 0.8 and in the case of capacity tests, the
acceptable value of alpha in reliability analysis is 0.7. The Cronbach alpha statistics are typically
recorded for the different domains within a questionnaire rather than for the entire questionnaire.
The alpha coefficient, or alpha of Cronbach, is the average of all possible split-half coefficients
arising from various ways of splitting objects of size.
Table 2.Reliability
Construct Cronbach Alpha Overall Cronbach Alpha
PU .861
LP .721
TD .702
.738
TMS .823
PU .731
AQ .742
4.2. ANOVA
4.2.1 Demographics across performance of auditor
1. Gender: The results show that there is a significant difference between performance of
auditor and gender. Since the value of p is less than 5% thus null hypothesis is rejected.
2. Age Group: There is significant difference between performances of auditorand age group of
the respondents. The null hypothesis is thus rejected.
3. Years of experience: There is significant difference between performance of auditor and
years of experience of the respondents. The null hypothesis is thus rejected.
4. Qualifications: There is significant difference between performance of auditor and
qualification of the respondents. The null hypothesis is thus rejected.
Table 3.Demographics across performance of auditor
Male 148 21.6 .00
Gender
Female 8 63 0
Less than 25 years old 8
From 26 to 35 years old 71 28.1 .00
Age
From 36 to 45 years old 50 29 0
Over 46 years old 28
Accounting 32
Business Administration 4
Economic 8 27.7 .00
Scientific Qualification
Statistic 4 34 0
Administrative costs and accounting 8
Another 101
Less than five years 39
From six to ten years 58 5.80 .00
Years of experience
From eleven to fifteen years 20 3 1
From sixteen to twenty years 16Studies in Economics and Business Relations9
more from twenty years 24
Intermediate Diploma 8
Higher Diploma 16 8.72 .00
Qualification
Bachelor's degree 117 7 0
Master 16
4.2.2 D
emographics across Legislation.
1. Gender : The results show that there is a significant difference between legislation and
gender. Since the value of p is less than 5% thus null hypothesis is rejected.
2. Age Group: There is significant difference between legislation and age group of the
respondents. The null hypothesis is thus rejected.
3. Years of experience: There is significant difference between legislation and years of
experience of the respondents. The null hypothesis is thus rejected.
4. Qualifications: There is significant difference between legislation and qualification of the
respondents. The null hypothesis is thus rejected.
Table 4.Demographics across Training
Male 148
Gender 28.753 .000
Female 8
Less than 25 years old 8
From 26 to 35 years old 71
Age 8.264 .000
From 36 to 45 years old 50
Over 46 years old 28
Accounting 32
Business Administration 4
Economic 8
Scientific
Statistic 4 8.417 .000
Qualification
Administrative costs and
8
accounting
Another 101
Less than five years 39
From six to ten years 58
Years of experience From eleven to fifteen years 20 4.700 .001
From sixteen to twenty years 16
more from twenty years 24
Intermediate Diploma 8
Higher Diploma 16
Qualification 5.176 .001
Bachelor's degree 117
Master 16
Table 5.Demographics across Training
Male 148
Gender 27.734 .000
Female 8
Age Less than 25 years old 8 5.803 .00110F. Author et al.:Manuscript Template: Preparation of Manuscript for SABA Journals
From 26 to 35 years old 71
From 36 to 45 years old 50
Over 46 years old 28
Accounting 32
Business Administration 4
Economic 8
Scientific Qualification 8.727 .000
Statistic 4
Administrative costs and accounting 8
Another 101
Less than five years 39
From six to ten years 58
Years of experience From eleven to fifteen years 20 7.049 .000
From sixteen to twenty years 16
more from twenty years 24
Intermediate Diploma 8
Higher Diploma 16
Qualification 7.199 .000
Bachelor's degree 117
Master 16
1. Gender : The results show that there is a significant difference between training and gender.
Since the value of p is less than 5% thus null hypothesis is rejected.
2. Age Group : There is significant difference between training and age group of the
respondents. The null hypothesis is thus rejected.
3. Years of experience: There is significant difference between training and years of experience
of the respondents. The null hypothesis is thus rejected.
4. Qualifications: There is significant difference between training and qualification of the
respondents. The null hypothesis is thus rejected.
4.2.3 Demographics across Top Management Support
5. Gender: The results show that there is a significant difference between top management
support and gender. Since the value of p is less than 5% thus null hypothesis is rejected.
6. Age Group : There is significant difference between top management support and age group
of the respondents. The null hypothesis is thus rejected.
7. Years of experience: There is significant difference between top management support and
years of experience of the respondents. The null hypothesis is thus rejected.
8. Qualifications: There is significant difference between top management support and
qualification of the respondents. The null hypothesis is thus rejected.Studies in Economics and Business Relations11
Table 6.Demographics across Top Management Support
Male 148
Gender 12.645 .000
Female 8
Less than 25 years old 8
From 26 to 35 years old 71
Age 12.333 .000
From 36 to 45 years old 50
Over 46 years old 28
Accounting 32
Business Administration 4
Economic 8
Scientific Qualification 8.792 .000
Statistic 4
Administrative costs and accounting 8
Another 101
Less than five years 39
From six to ten years 58
Years of experience From eleven to fifteen years 20 6.067 .000
From sixteen to twenty years 16
more from twenty years 24
Intermediate Diploma 8
Higher Diploma 16
Qualification 6.169 .000
Bachelor's degree 117
Master 16
4.2.4Demographics across Audit Quality
1. Gender : The results show that there is a significant difference between audit quality and
gender. Since the value of p is less than 5% thus null hypothesis is rejected.
2. Age Group : There is significant difference between audit quality and age group of the
respondents. The null hypothesis is thus rejected.
3. Years of experience: There is significant difference between audit quality and years of
experience of the respondents. The null hypothesis is thus rejected.
4 Qualifications: There is significant difference between audit quality and qualification of the
respondents. The null hypothesis is thus rejected.12F. Author et al.:Manuscript Template: Preparation of Manuscript for SABA Journals
Table 7. Demographics across Audit Quality
Male 148
Gender 20.982 .000
Female 8
Less than 25 years old 8
From 26 to 35 years old 71
Age 12.240 .000
From 36 to 45 years old 50
Over 46 years old 28
Accounting 32
Business Administration 4
Economic 8
Scientific Qualification 6.658 .000
Statistic 4
Administrative costs and accounting 8
Another 101
Less than five years 39
From six to ten years 58
Years of experience From eleven to fifteen years 20 6.193 .000
From sixteen to twenty years 16
more from twenty years 24
Intermediate Diploma 8
Higher Diploma 16
Qualification 6.897 .000
Bachelor's degree 117
Master 16
4.3 Hypothesis testing and path analysis by Regression
Regression tests the relationship between variables. Regression is tested using weights, p-values and
t-values for regressions (Hair et al . , 2016). The regression results will be shown in Table 8, and
figure 1, the reversal calculated as exogenous variables sustainable food, sustainable payment,
sustainable lifestyle, digital payment and shopping habits. Such exogenous variables lead to the
output of an endogenous variable user.
Performance P=
0.032
Legislation P= 0.000
P= 0.002
Training Effectiveness
P= 0.002
Top ManagementStudies in Economics and Business Relations13
Figure 3. Regression model
The findings in Table 8 show that most of the hypotheses, suggested in this study, are not supported.
H01 shows a direct LPSDFW RI SHUIRUPDQFH RQ HIIHFWLYHQHVV - S 7KH YDOXH -
0.208 indicates that performance aspects affects the dependent variable effectiveness by about 20.8
percent. Therefore, a 1 percent decrease in performance will result in a 20.8 percent improvement in
effectiveness. The p-value (p = 0.032) reveals the negative and direct relationship between
performance and audit quality.
6HFRQG K\SRWKHVLV WKH LPSDFW RI /HJLVODWLRQ RQ $XGLWRU 4XDOLW\ S 7KH YDOXH
= 0.437 indicates that legislation affects the dependent variable auditor quality by about 43.7 percent.
Therefore, a 1 percent increase in legislation will result in a 43.7 percent improvement in auditors
quality. The p-value (p = 0.000) reveals the positive and indirect relationship between legislation and
auditors quality.
7KH WKLUG K\SRWKHVLV WKH LPSDFW RI WUDLQLQJ RQ DXGLWRUV TXDOLW\ ZDV VXSSRUWHG S 0.002).
7KH -value 0.369indicates that training does influence auditors quality. The p-value (p = 0.002) also
indicates there is direct impact training on auditors quality.
)RXUWK K\SRWKHVLV WKHUH LV QR LPSDFW RI WRS PDQDJHPHQW RQ DXGLWRUV TXDOLW\ 0.280, p = 3.141).
7KH -value 0.280indicates that top management does influence auditors quality. The p-value (p
= 3.131) also indicates there is direct impact of top management on auditors quality.
The results are similar to the study conducted by Badara and Saidin (2013) and Vakola, et
al., 2007
Table 8.Summary of hypothesis
Independent Dependent
S. No Coefficient sig Result
variable variable
1 PU -.208 .032
Significance
2 LP .437 .000
Significance
AQ
3 TD .369 .002
Significance
4 TMS .280 .002
Significance
5 Conclusion
Overall, the findings of this study show that the consistency of the work of the government's internal
audit testers depends on the extent of preparation received, the degree of collaboration in auditing the
client's management, the awareness and adaptation of audit tests by the auditors to the client's
operating risks, the scale of the audit department's budget, the inability of the audit client to fulfil the
pre-resolution criteria.14F. Author et al.:Manuscript Template: Preparation of Manuscript for SABA Journals
The findings are generalizable to the environments of other nations in the sense that the need for
auditor independence, technical competence and good audit function management are universal
virtues which, irrespective of the operating environment, lead to an effective internal audit. The
influence of the size of the budget on the audit quality analysis , for example, could mean that, in
countries where the audit institution lacks financial control, the lack of a budget for the audit office
may have an impact on the quality of the audit documentation and the audit process, thus weakening
the efficacy of the audit function. In addition, in countries where there is a substantial political effect
on the activities of the audit office, the establishment of audit work consultations within the same
public authorities can have a detrimental impact on the objectivity of the auditors and on the integrity
of the auditor.
6 Implications
In order to obtain useful outcomes, researchers should carefully consider the PEM structures and
governance frameworks pertaining to the applicable audit environment in their research design in
replicating this analysis in other countries. For example, the Audit Commission appoints auditors of
all local councils and national health care bodies in the United Kingdom and regulates their audits,
while in the United States, each local body appoints and manages its own auditors (Diamond, 2002),
while the provisions of the Single Audit Act are subject to local governments that have acquired
federal funds.
The findings of the study have implications for both public policy theory and practise. Understanding
the determinants of quality audit research from a theoretical viewpoint helps to conceptualise the
competitive effect of justifiable audit results on the asymmetry of information between public
administrators and individuals with respect to the sound use of public capital. Knowledge of these
determinants can, from a realistic point of view, help to put in place effective initiatives to improve
audit quality and recommendations in order to improve government accountability and operational
performance. Government organisations should also ensure that sufficient resources and facilities are
given to increase the quality of internal audits. When audit management gives adequate instructions
to auditors and the integrity of auditors is not undermined by advisory obligations, a resource
dedication to increase the efficiency of government internal audit work would be more beneficial.
References
[1] Zahargier, M.S., &Balasundaram, N. (2011). Factors affecting Employees Performance in Ready-aide
Garments (RMGs) Sector in Chittagong, Bangladesh. Economic Sciences series, 63(1). 9-15.
[2] Wheelen& Hunger. (2002), Corporate governance and social responsibility. International Journal of
Business Administration, 1(2), 14-27
[3] Zahargier, M.S., &Balasundaram, N. (2011). Factors affecting Employees Performance in Ready-aide
Garments (RMGs) Sector in Chittagong, Bangladesh. Economic Sciences series, 63(1). 9-15
[4] Baron and Greenbery (2008), Mehmood et al (2012), Hong et al (2013), Chandrasekar (2011), Naseem et
al, (2012)
[5] Masood, A., & Lodhi, R.N. (2015). Factors Affecting the Success of Government Audits: A Case Study
of Pakistan. Universal Journal of Management, 3(2), 52-62.
[6] DeAngelo, L. E. (1981). Auditor size and audit quality. Journal of Accounting and Economics, 3, 183-
199. Dehkordi, H. F., &Makarem, N. (2011). The effect of size and type of auditor on audit quality.
International Research Journal of Finance and Economics, 80, 121-137.
[7] &KDQ ' :RQJ . 6FRSH RI DXGLWRUV¶ OLDELOLW\ Dudit quality, and capital investment. Review
of Accounting Studies, 7(2), 97-122.
[8] DeAngelo, L. (1981), Auditor size and audit quality, Journal of Accounting and Economics, 3 (3), 189±
199.
[9] http://www.ifac.org/sites/default/files/publications/files/study13-governance-in-th-Studies in Economics and Business Relations15
[10] Mgbame, C. O., Eragbhe, E., &Osazuwa, N. P. (2012). Audit partner tenure and audit quality: An
empirical analysis. European Journal of Business and Management, 4(7), 154-162.
[11] Siregar, S. V., Amarullah, F., Wibowo, A., &Anggraita, V. (2012). Audit tenure, auditor rotation and
audit quality: The case of Indonesia. Asian Journal of Business and Accounting, 5(1), 55-74.
[12] Al-Thuneibat, A. A., Al-Issa, R. T., & Ata-Baker, R. A. (2011). Do audit tenure and firm size contribute
to audit quality: Empirical evidence from Jordan. Managerial Auditing Journal, 26(4), 317-334.
[13] Hsieh, M. T. (2011). Does audit partner tenure influence on audit quality? Asian Journal of Management
123, 8(2), 11-26.
[14] Geiger, M., &Raghunandan, K. (2002). Auditor tenure and audit reporting failures. Auditing: A Journal
of Practice and Theory 21(1), 67-78.
[15] Johnson, V., Khurana, I., & Reynolds, J. (2002). Audit-firm tenure and the quality of financial reports.
Contemporary Accounting Research, 19(4), 637-660.
[16] Myers, J., Myers, L., & Omer, T. (2003). Exploring the term of the auditor-client relationship and the
quality of earnings: A case for mandatory auditor rotation? The Accounting Review, 78(3), 779-799.
[17] Nagy, A. (2005). Mandatory audit firm turnover, financial reporting quality, and client bargaining power:
The case of Arthur Andersen. Accounting Horizons, 19(2), 51-68.
[18] Duncan, K. (1997). Student pre-entry experience and first year of employment, Journal of continuing
education in nursing, 28(5), 223-30.
[19] Saeed, R., Mussawar, S., Lodhi, R. N., Iqbal, A., Nayab, H. H., & Yaseen, S. (2013). Factors affecting the
performance of employees in Telecom sector of Pakistan. Middle-East Journal of Scientific Research,
16(11), 1476-1482.
[20] 0XGD , 5DILNL $ +DUDKDS 0 5 )DFWRUV ,QIOXHQFLQJ (PSOR\HHV¶ 3HUIRUPDQFH $ 6WXG\ RQ
the Islamic Banks in Indonesia. Global Journal of Business and Social Science, 5(2). 73-80.
[21] Suyono, E. (2012). Determinant Factors Affecting the Audit Quality: An Indonesian Perspective. Global
Review of Accounting and Finance, 3(2), 42-57.
[22] Saeed, R., Mussawar, S., Lodhi, R. N., Iqbal, A., Nayab, H. H., & Yaseen, S. (2013). Factors affecting the
performance of employees in Telecom sector of Pakistan. Middle-East Journal of Scientific Research,
16(11), 1476-1482.
[23] 0XGD , 5DILNL $ +DUDKDS 0 5 )DFWRUV ,QIOXHQFLQJ (PSOR\HHV¶ 3HUIRUPDQFH $ 6WXG\ RQ
the Islamic Banks in Indonesia. Global Journal of Business and Social Science, 5(2). 73-80.
[24] Ram, P., Bhargavi, G.S., & Prabhakar, G.V. (2011). Work environment, service climate, and customer
satisfaction: Examining theoretical and empirical connections. International Journal of Business and
Social Science, 2(20), 121-132.
[25] mran, R., Fatima, A., Zaheer, A., Yousaf, I., & Batool, I. (2012). How to boost employee performance:
investigating the influence of transformational leadership and work environment in a Pakistani
perspective. Middle-East Journal of Scientific Research, 11(10), 1455- 1462.
[26] Al-Khaddash, H., Al Nawas, R., & Ramadan, A. (2013). Factors affecting the quality of Auditing: The
Case of Jordanian Commercial Banks. International Journal of Business and Social Science, 4(11), 206-
222.
[27] Adeyemi, S. B., Dabor, E. L., & Okpala, O. (2012). Factors affecting audit quality in Nigeria.
International Journal of Business and Management, 3(20), 198-209.
[28] Baharuddin, Z., Shokiyah, A., & Ibrahim, M. S. (2014). Factors that Contribute to the Effectiveness of
Internal Audit in Public Sector. International Proceedings of Economics Development and Research, (70),
126-132.
[29] Mathur, S.K., & Gupta, S.K. (2012). Outside Factors Influencing Behavior of Employees in
Organizations. International Journal of Information and Education Technology, 2(1), 48-50.
[30] Masood, A., Aslam, R., & Rizwan, M. (2014). Factors Affecting Employee Satisfaction of the Public and
Private Sector Organizations of Pakistan. International Journal of Human Resource Studies, 4(2), 97-121.
[31] Kabir, M.N., & Parvin, M.M. (2011). Factors affecting employee job satisfaction of pharmaceutical
sector. Australian Journal of Business and Management Research, 1(9), 113-123.
[32] 1HRJ % % %DUXD 0 )DFWRUV ,QIOXHQFLQJ (PSOR\HH¶V -RE 6DWLVIDFWLRQ $Q (PSLULFal Study
among Employees of Automobile Service Workshops in Assam, The SIJ Transactions on Industrial,
Financial & Business Management (IFBM), 2(7), 305-316.16F. Author et al.:Manuscript Template: Preparation of Manuscript for SABA Journals
[33] Alshitri, K.I. (2013). An investigation of factors affecting job satisfaction among R&D center employees
in Saudi Arabia. Journal of Human Resources Management Research, (2013), 1-10.
[34] Haenisch, J.P. (2012). Factors affecting the productivity of government workers. SAGE Journals,
retrieved from http://sgo.sagepub.com/content/early/2012/03/05/215824401244
1603.short.
[35] Alshitri, K.I. (2013). An investigation of factors affecting job satisfaction among R&D center employees
in Saudi Arabia. Journal of Human Resources Management Research, (2013), 1-10.
[36] Haenisch, J.P. (2012). Factors affecting the productivity of government workers. SAGE Journals,
retrieved from http://sgo.sagepub.com/content/early/2012/03/05/215824401244 1603.short.
[37] Hong, L.C., Hamid, N.I.N.A., & Salleh, N.M. (2013). A study on the factors affecting job satisfaction
amongst employees of a factory in Seremban, Malaysia. Business Management Dynamics, 3(1), 26-40.
[38] Pitaloka, E., & Sofia, I.P. (2014). The effect of Work Environment, Job Satisfaction, Organization
Commitment on OCB of Internal Auditors, International Journal of Business, Economics and Law, 5(2),
10-18.
[39] Wadhwa, D.S., Verghese, M., & Wadhwa, D.S. (2011). A study on factors influencing employee job
satisfaction: A study in cement industry of Chattisgarh. Journal of Management and Business Studies,
1(3), 109- 111.
[40] Chandrasekar, K. (2011). Workplace environment and its impact on organizational performance in public
sector organizations. International Journal of Enterprise Computing and Business Systems, 1(1), 1-16.
[41] $MDOD ( 0 7KH LQIOXHQFH RI ZRUNSODFH HQYLURQPHQW RQ ZRUNHUV¶ ZHOIDUH SHUIRUPDQFH DQG
productivity. The African Symposium, 12(1), 141-149)
[42] http://www.ifac.org/sites/default/files/publications/files/study13-governance-in-th-pdf.
[43] https://www.transparency.org/.You can also read