Defining a Socially Disadvantaged Farmer or Rancher (SDFR): In Brief - March 19, 2021
←
→
Page content transcription
If your browser does not render page correctly, please read the page content below
Defining a Socially Disadvantaged Farmer or
Rancher (SDFR): In Brief

March 19, 2021

                              Congressional Research Service
                               https://crsreports.congress.gov
                                                      R46727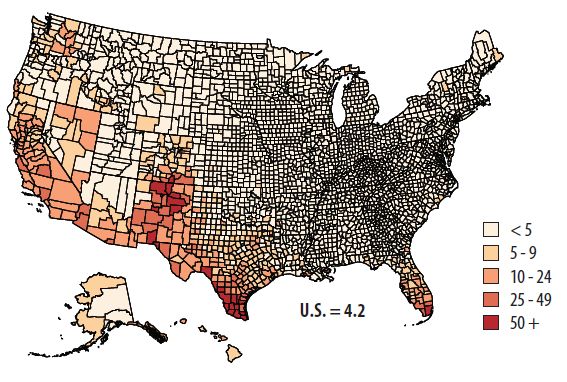
Defining a Socially Disadvantaged Farmer or Rancher (SDFR): In Brief

Contents
Alternative SDFR Definitions ........................................................................................... 3
Brief History of SDFR Programs and Policies ..................................................................... 5
Selected Characteristics of SDFRs ..................................................................................... 7
Available USDA Data and Information ............................................................................. 11
    Female Producers .................................................................................................... 11
    Hispanic, Latino, or Spanish Origin Producers ............................................................. 11
    American Indian/Alaska Native Producers................................................................... 13
    Black/African American Producers............................................................................. 14
    Asian Producers ...................................................................................................... 14
Recent Congressional and Administrative Actions .............................................................. 15

Figures
Figure 1. Alternative Statutory Definitions of Socially Disadvantaged Group ........................... 4
Figure 2. Selected Data by SDFR Status (Race, Ethnicity, and Gender), 2017......................... 10
Figure 3. Selected Data by SDFR Status (Race and Ethnicity Only), 2017 ............................. 10
Figure 4. Female-Operated Farms as Percent of Total Farms, by County, 2017 ....................... 13
Figure 5. Hispanic-Operated Farms as Percent of Total Farms, by County, 2017 ..................... 13
Figure 6. American Indian/Alaska Native-Operated Farms as Percent of Total Farms, by
  County, 2017 ............................................................................................................. 14
Figure 7. Black-Operated Farms as Percent of Total Farms, by County, 2017.......................... 14

Tables
Table 1. SDFR Farms and Principal Producers, 2017 ............................................................ 9
Table 2. Selected Data, U.S. Producer Characteristics and Demographics, 2017 ...................... 12

Contacts
Author Information ....................................................................................................... 16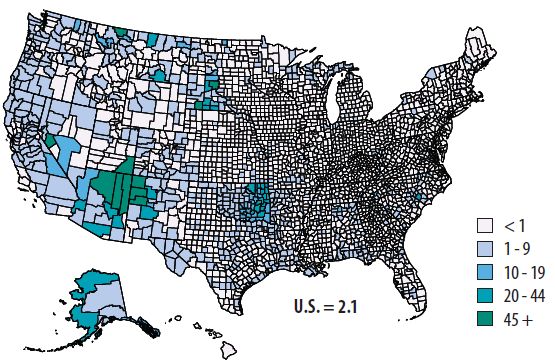
Defining a Socially Disadvantaged Farmer or Rancher (SDFR): In Brief

        socially disadvantaged farmer or rancher (SDFR) refers to a farmer or rancher who is a

A       member of a group whose members have been subjected to racial or ethnic discrimination
        (7 U.S.C. §2279) and in some cases, racial, ethnic, or gender discrimination (7 U.S.C.
§2003). Which of these two SDFR definitions applies varies among U.S. Department of
Agriculture (USDA) farm programs. Analysis of 2017 Census of Agriculture data by the
Government Accountability Office (GAO) indicates that SDFRs (including women, regardless of
race and ethnicity) accounted for about 30% of all U.S. farms in 2017. 1 Farms operated by
SDFRs accounted for about 21% of all farmed acres and about 13% of the value of all
agricultural sales. Other data from USDA indicate that SDFRs excluding non-Hispanic White
women accounted for about 9% of all farms, 10% of all farmed acres, and 8% of sales. 2
Congress made support for socially disadvantaged individuals an aspect of USDA farm credit
programs as part of stand-alone legislation in the late 1980s (P.L. 100-233). The term socially
disadvantaged farmer or rancher was first defined in omnibus farm legislation in 1990 (P.L. 101-
624) with the creation of a USDA outreach program. Subsequent farm bills have added SDFRs as
eligible or priority recipients across a range of USDA programs; in some cases, those bills have
specified funding set-asides or target participation rates for such producers. The most recent
omnibus farm bill (Agriculture Improvement Act of 2018; P.L. 115-334) reauthorized and
expanded many USDA programs and added provisions targeting program support for SDFRs,
which are now included across most types of USDA programs, including farm loan and credit
programs, federal crop insurance, farmland conservation programs, and various research and
promotion programs. This support is often included along with other priorities and set-asides for
new and beginning farmers and ranchers or other underserved producers.
Policy options to increase federal support for SDFRs and other historically underserved
agricultural producers continue to be actively debated in Congress. The American Rescue Plan
Act of 2021 (P.L. 117-2) provided specific farm loan assistance and other USDA support for
SDFRs. In the 116th Congress, the Taxpayer Certainty and Disaster Tax Relief Act of 2020 (P.L.
116-260) provided additional emergency Coronavirus Disease 2019 (COVID-19) funding to
USDA programs supporting SDFRs beyond existing authorized funding. Other ongoing and
planned congressional activities have identified the need for increased support for SDFRs within
USDA programs. USDA leadership has indicated its intention to address possible discrimination
involving SDFRs and other underserved producers across USDA agencies, offices, and programs.
In addition, an Executive Order issued by the Biden Administration is seeking to promote and
allocate the “equitable delivery” of government benefits and federal resources, among other
related goals, which could expand USDA programs that support SDFRs.3

Alternative SDFR Definitions
As defined in statute, SDFR means “a farmer or rancher who is a member of a socially
disadvantaged group.”4 However, what constitutes a socially disadvantaged group is alternatively
defined in the U.S. Code—a key distinction being the inclusion or not of gender. Two separate

1
  U.S. Government Accountability Office (GAO), Agricultural Lending, Information on Credit and Outreach to
Socially Disadvantaged Farmers and Ranchers Is Limited , GAO-19-539, July 2019, p. 7 (hereinafter GAO-19-539,
July 2019).
2 Custom tabulations of the 2017 Census of Agriculture from USDA (Inquiry 23627, March 5, 2021).

3
 White House, “Executive Order On Advancing Racial Equity and Support for Underserved Communities T hrough the
Federal Government,” presidential actions, January 20, 2021.
4   7 U.S.C. §2279(a)(6) and 7 U.S.C. §2003(e)(2).

Congressional Research Service                                                                                  3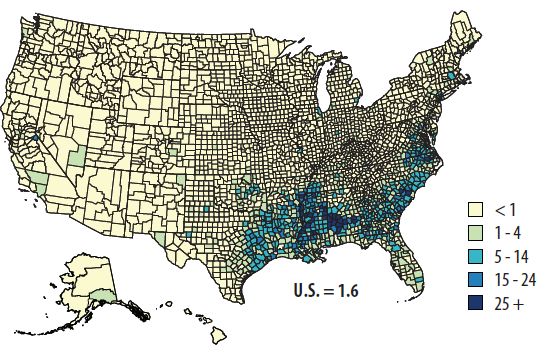
Defining a Socially Disadvantaged Farmer or Rancher (SDFR): In Brief

definitions exist: one covers race, ethnicity, and gender; the other covers race and ethnicity only
(excluding gender) (Figure 1). Specifically, 7 U.S.C. §2279 defines a socially disadvantaged
group as “a group whose members have been subjected to racial or ethnic prejudice because of
their identity as members of a group without regard to their individual qualities.”5 Elsewhere (7
U.S.C. §2003), the definition also includes an agricultural producer who is a member of a group
whose members have been subjected to gender discrimination (i.e., women, regardless of race
and ethnicity), defining a socially disadvantaged group as “a group whose members have been
subjected to racial, ethnic, or gender prejudice because of their identity as members of a group
without regard to their individual qualities.”6

         Figure 1. Alternative Statutory Definitions of Socially Disadvantaged Group

       Source: CRS from definitions in the U.S. Code.

In practice, SDFR eligibility for USDA farm support programs may vary depending on which
definition is cited in statute for a particular program. While the definition most cited in USDA
programs includes race and ethnic groups, women (regardless of race and ethnicity) may be
included in the SDFR definition for some programs.
USDA defines SDFRs as belonging to the following race and ethnic groups: African Americans,
American Indians, Alaskan Natives, Asians, Hispanics, Pacific Islanders, refugees, immigrants,
and groups as determined by the Secretary of Agriculture. 7 USDA regulations further define
eligible entities under some programs to include 1890 Institutions (historically Black land-grant
colleges and universities), 1994 Institutions (Alaska Native and American Indian Tribal colleges
and universities), and Hispanic-serving colleges and universities. 8 Some—but not all—USDA
programs with a focus on SDFRs cover women farmers and ranchers.9 In general, many USDA

5
    7 U.S.C. §2279(a)(5). Italics added for emphasis.
6
 7 U.S.C. §2003(e)(1); §355(e) of the Consolidated Farm and Rural Development Act. Italics added for emphasis.
7USDA, Office of Partnerships and Public Engagement (OPPE), “Farming Opportunities T raining and Outreach Grant
Program,” 2020, at https://www.usda.gov/sites/default/files/documents/2501_FactSheet.pdf; and USDA, “ Frequently
Asked Questions 2501 Program,” at https://www.usda.gov/partnerships/frequently-asked-questions-2501-program.
8
    See, for example, 81 Federal Register 41508, June 27, 2016; and 85 Federal Register 41938, July 13, 2020.
9 See also USDA, Economic Research Service (ERS), “ Beginning, Limited Resource, Socially Disadvantaged, and
Female Farmers,” at https://www.ers.usda.gov/topics/farm-economy/beginning-limited-resource-socially-
disadvantaged-and-female-farmers/.

Congressional Research Service                                                                                  4
Defining a Socially Disadvantaged Farmer or Rancher (SDFR): In Brief
programs relating to commodity, 10 credit, 11 noninsured crop assistance, 12 and rural development13
that support SDFRs apply the broader SDFR definition that includes women found at 7 U.S.C.
§2003. In contrast, some USDA programs relating to grants (such as the Farming Opportunities
Training and Outreach [FOTO] program), conservation, 14 and energy15 tend to reference the more
limited SDFR definition excluding non-Hispanic White women found at 7 U.S.C. §2279.
In addition, USDA programs may reference other related terms and definitions that include
similar or overlapping producer groups, such as new and beginning farmers or ranchers,16 as well
as U.S. veterans, among other targeted groups.17 These definitions generally reference SDFRs and
do not always address which specific groups are covered. For example, the 2018 farm bill
(Agriculture Improvement Act of 2018; P.L. 115-334, §11108) amended the federal crop
insurance program to address underserved producers, defined as “an individual (including a
member of an Indian Tribe) that is” a beginning, veteran, or socially disadvantaged farmer or
rancher, in order to target producers who are underserved by the program. 18 The 2018 farm bill
(§2706) also required that USDA conservation programs conduct outreach to historically
underserved producers, referring to beginning, veteran, socially disadvantaged, and limited
resource farmers and ranchers. 19 Neither of these definitions specifically reference a particular
existing statutory definition of SDFR, and it is not clear where these definitions stand on issues of
race, ethnicity, or gender. For example, USDA commodity, credit, and conservation programs also
reference low-income limited resource farmers and ranchers, as defined by USDA depending on
the program, but do not directly reference race, ethnicity, or gender. 20
Brief History of SDFR Programs and Policies
The Agricultural Credit Act of 1987 (P.L. 100-233) added to USDA farm credit programs support
for agricultural producers who may have been subjected to discrimination. Among that law’s
provisions, Congress established a farm ownership outreach program for members of a group
10
See, for example, 7 U.S.C. §8711 (Base acres).
11 See, for example, 7 U.S.C. §2003 (T arget participation rates).
12 See, for example, 7 U.S.C. §7333 (Administration and operation of noninsured crop assistance program ).
13See, for example, 7 U.S.C. §1932 (Assistance for rural entities).
14See, for example, 16 U.S.C. §§2202a, 3801, 3835, 3839aa-2, 3841, 3844. In some cases, USDA may be required to
conduct outreach to socially disadvantaged farmers or ranchers (SDFRs), as defined at 7 U.S.C. §2003 (e.g., see 16
U.S.C. §§590c, 590h).
15See, for example, 7 U.S.C. §8111 (Biomass Crop Assistance Program).
16
A new and beginning farmer or rancher is generally defined as someone “who has not operated a farm or ranch, or
who has operated a farm or ranch for not more than 10 years,” among other eligibility requirements (7 U.S.C. §1991(a),
which defines a qualified beginning farmer or rancher).
17For a detailed background, see CRS Congressional Distribution memorandum, “Programs/Policies that Address
Farmers and Ranchers Who are Beginning, Socially Disadvantaged, Limited Resource, Historically Underserved, or
Veterans,” January 22, 2020 (available upon request).
18
7 U.S.C. §1508.
19
16 U.S.C. §3871e(d).
20
USDA currently defines a limited resource farmer or rancher as “a person with direct or indirect gross farm sales not
more than $142,000 in each of the previous two years, and a person with a total household income at or below the
national poverty level for a family of four or less than 50% of co unty median household income in each of the previous
two years.” See USDA, “ Limited Resource Program Definition,” at https://lrftool.sc.egov.usda.gov/
LRP_Definition.aspx; and USDA, ERS, “Farm Household Income and Characteristics,” at https://www.ers.usda.gov/
data-products/farm-household-income-and-characteristics/.
Congressional Research Service 5Defining a Socially Disadvantaged Farmer or Rancher (SDFR): In Brief
identified as socially disadvantaged, referencing language governing Small Business
Administration (SBA) programs. 21 SBA defines socially disadvantaged individuals as “those who
have been subjected to racial or ethnic prejudice or cultural bias because of their identity as a
member of a group without regard to their individual qualities.”22 This provision of P.L. 100-233
was amended in subsequent farm bills and stand-alone legislation, further expanding support for
SDFRs and referencing the term SDFR, instead of the language used by SBA.
SDFR was first defined in the 1990 farm bill (Food Agriculture Conservation and Trade Act of
1990; P.L. 101-624, §2279). The term referenced the target population of the then-established
Outreach and Assistance to Socially Disadvantaged Farmers and Ranchers grant program—
commonly known as the 2501 Program. The program required USDA to provide outreach and
technical assistance to SDFRs to help historically underserved farmers directly access USDA
grants and other support program. 23 Changes in the Agricultural Credit Improvement Act of 1992
(P.L. 102-554, §21(b)) further amended USDA’s farm credit programs to target a portion of its
assistance to include women among historically underserved producers. 24
Omnibus farm legislation since the 1990 farm bill has further expanded provisions addressing
SDFRs across most USDA programs. 25 Many programs available to all U.S. farmers now
specifically target SDFRs. The 2002 farm bill (Farm Security and Rural Investment Act of 2002;
P.L. 107-171) made additional changes to requirements in the USDA farm credit programs and
the 2501 Program. Both the 2008 and 2014 farm bills made similar changes and contained
separate subtitles within the Miscellaneous title, with multiple provisions addressing SDFRs (as
well as limited resource producers). The 2008 farm bill (Food, Conservation, and Energy Act of
2008; P.L. 110-246, Title XIV, Subtitle A) required additional reporting and data collection
(including participation rates) for some USDA programs; addressed the need for improved USDA
program delivery on Indian reservations; established a Minority Farmer Advisory Committee; and
required a report on civil rights complaints, resolutions, and actions, among other requirements.
The 2014 farm bill (Agricultural Act of 2014; P.L. 113-79, Title XII, Subtitle B) also expanded
funding for USDA’s outreach efforts and assistance for programs supporting SDFRs.
The most recent farm bill (Agriculture Improvement Act of 2018; P.L. 115-334) reauthorized and
expanded many of USDA’s programs addressing SDFRs and added SDFRs as eligible for other
USDA programs (where participation was not previously specified). The 2018 farm bill also
made changes to the 2501 Program, which is now part of the newly created Farming
Opportunities Training and Outreach (FOTO) program. FOTO is the leading USDA program
supporting socially disadvantaged (and beginning) farmers and ranchers, in terms of its
operational breadth and funding. 26 FOTO combines and expands the 2501 Program and the
21
P.L. 100-233, §623; 7 U.S.C. §1985 note, as amended.
22 15 U.S.C. §637(a)(5).
23 P.L. 101-624, §2501; 7 U.S.C. §2279. As amended in subsequent farm bills, the most recent 2018 farm bill
(Agriculture Improvement Act of 2018; P.L. 115-334) merged the 2501 Program with the Beginning Farmer and
Rancher Development Grant Program, creating the Farming Opportunities T raining and Outreach (FOT O) program
(discussed in “Recent Congressional and Administrative Actions”). For more background on this and related USDA
programs, see CRS Report R46538, Local and Urban Food Systems: Selected Farm Bill and Other Federal Programs.
24 7 U.S.C. §2003, as amended by P.L. 102-554, §21(b).
25
White House, “Executive Order On Advancing Racial Equity and Support for Underserved Communities T hrough
the Federal Government,” presidential actions, January 20, 2021.
26P.L. 115-334, §12301; 7 U.S.C. §2279. For more background, see CRS Report R46538, Local and Urban Food
Systems: Selected Farm Bill and Other Federal Programs; and CRS In Focus IF11227, 2018 Farm Bill Primer:
Beginning Farmers and Ranchers.
Congressional Research Service 6Defining a Socially Disadvantaged Farmer or Rancher (SDFR): In Brief Beginning Farmer and Rancher Development Program (BFRDP). Under FOTO, USDA’s National Institute of Food and Agriculture makes competitive grants to support new and established local training, education, outreach, and technical assistance initiatives. The 2501 Program authorizes project grants to support outreach and technical assistance to SDFRs and veteran farmers and ranchers. Funding amounts range from $100,000 to $400,000 per year for up to three years (with no matching requirements). BFRDP authorizes project grants of up to $250,000 per year for up to three years (matching funds are required) to support training, education, outreach, and technical assistance for beginning farmers and ranchers. Overall, FOTO is authorized to receive annual mandatory funding reaching $50 million in FY2023 (and each year thereafter), to be split equally between the two programs. 27 Additional annual appropriations of $50 million (FY2019-FY2023) also are authorized. Other provisions in the 2018 farm bill allow SDFRs to receive increased benefits under many USDA programs. Such programs include crop insurance, disaster assistance, farm credit and loan assistance, tax benefits, farmland conservation assistance, research, market promotion, training and education, transition assistance to convert to certified organic agriculture, and programs to match retiree landowners with buyers. Support for SDFRs is often included with participation targets, priorities, and set-asides for new and beginning, veteran, and other historically underserved producers. For example, the 2018 farm bill reserves 10% of available funding for “beginning, veteran, and socially disadvantaged farmers or ranchers” (7 U.S.C. §1627c) under USDA’s Value-Added Grant program—one of the programs under the Local Agriculture Market Program (LAMP). Funding set-asides targeting beginning, veteran, and socially disadvantaged producers also are prevalent within USDA’s conservation programs, among other programs within other farm bill titles. This broad base of overall support may complicate efforts to identify support that is specific to groups, such as those based on race, ethnicity, or (in some cases) gender. USDA data often are not readily available to differentiate the amount of funding provided among the various subgroups. Selected Characteristics of SDFRs The inclusion or exclusion of women in USDA programs supporting SDFRs can complicate data collection and reporting on SDFRs. Table 1 includes USDA data by race, ethnicity, and gender by principal producer from the 2017 Census of Agriculture (see the text box for definitions). As shown, women (regardless of race and ethnicity) accounted for 29% (798,500) of all U.S. principal producers. Additional analysis of these data by GAO indicates that there were an estimated 489,000 female primary producers—referring to the individual on a farm responsible for most decisionmaking. 28 Hispanic, Latino, or Spanish-origin producers accounted for 2% of all principal producers in 2017, while other groups (American Indian/Alaska Native, Black/African American, and Asian) accounted for a combined total of nearly 5% (Table 1), including female operators who identify as Hispanic or non-White. 27 Mandatory funding is through the Commodity Credit Corporation and is not subject to appropriations. For background, see CRS Report R44606, The Commodity Credit Corporation (CCC). 28GAO-19-539, July 2019, p. 6. T here may be multiple principal producers on a farm, but each farm has only one primary producer. Principal/primary operators may be counted in multiple SDFR groups (e.g., individual female operators who identify as Hispanic). Congressional Research Service 7
Defining a Socially Disadvantaged Farmer or Rancher (SDFR): In Brief

Table 1 does not show the number of primary producers, or all other types of producers, 29 by
group. Estimates reported from different sources will vary depending on whether referencing the
number of primary, principal, or other types of producers. For more background on USDA’s
terms and definitions, see the text box, below.

                Selected USDA Producer Definitions in the Census of Agriculture
 Producer. The term producer designates a person who is involved in making decisions for the farm operation.
 Decisions may include decisions about such things as planting, harvesting, livestock management, and marketing. The
 producer may be the owner, a member of the owner’s household, a hired manager, a tenant, a renter, or a
 sharecropper. If a person rents land to others or has land worked on shares by others, he/she is considered the
 producer only of the land that is retained for his/her own operation. The census collected information on the total
 number of male producers, the total number of female producers, and demographic information for up to four
 producers per farm.
 Principal Producer. Demographic data were collected for up to four producers per farm. Each producer was
 asked if they were a principal operator or a senior partner. A principal producer is a producer who indicated they
 were a principal operator. There may be multiple principal producers on a farm. Each farm has at least one principal
 producer.
 Non-principal Producers. Demographic data were collected for up to four producers per farm. Each producer
 was asked if they were a principal operator or a senior partner. A non-principal producer is a producer who did
 not indicate they were a principal operator. There may be no non-principal producers on a farm.
 Primary Producer. One primary producer is designated for each farm. A primary producer is a principal
 producer (comparable to 2012 principal operator). If multiple principal producers were reported on a farm, a
 primary producer was chosen by designating the person who made the most decisions for the farm. If equal
 decisions were made, the primary producer was the person who worked off the farm the least. If multiple principal
 producers worked the least off the farm, a random choice was made as to which producer was the single
 designated primary producer.
 Source: USDA, Census of Agriculture, Appendix B (General Explanation and Census of Agriculture Report Form), at
 https://www.nass.usda.gov/Publications/AgCensus/2017/Full_Report/Volume_1,_Chapter_1_US/usappxb.pdf.

GAO estimates there were 604,019 primary producers who are SDFR (including women,
regardless of race and ethnicity). GAO also reports these SDFRs accounted for about 30% of all
U.S. farms in 2017 and about 21% of all farmed acres and about 13% of the value of all
agricultural sales (Figure 2). 30
Other data from USDA by race and ethnicity only (excluding non-Hispanic White women)
indicate there were 193,494 farms and a total of 260,751 producers in 2017. 31 SDFR producers
(excluding non-Hispanic White women) accounted for about 9% of all farms, about 10% of all
farmed acres, and about 8% of the value of all agricultural marketed goods (Figure 3).

29A farm may have more than one producer who may be the owner, a member of the owner’s household, a hired
manager, a tenant, a renter, or a sharecropper. Across all U.S. producers—both primary/principal and other types of
producers—GAO reported that SDFRs accounted for an estimated 41% (1,390,449). Producers are individuals
involved in farm decisionmaking (e.g., planting, harvesting, livestock management, marketing) . By this methodology,
there were 3.4 million producers in 2017.
30   GAO-19-539, July 2019.
31
     Custom tabulations of the 2017 Census of Agriculture from USDA (Inquiry 23627, March 5, 2021).

Congressional Research Service                                                                                          8
Defining a Socially Disadvantaged Farmer or Rancher (SDFR): In Brief
Table 1. SDFR Farms and Principal Producers, 2017
(Nonadditive Groups by Race, Ethnicity, and Gender)
2017
Principal Share
Farms Producers 2017 Share (Principal
Selected SDFR Groupa (2017) (2017) (Farms) Producers)
Women (any race/ethnicity) 1,139,675 798,500 55.8% 29.1%
Hispanic, Latino, or Spanish Origin 86,278 66,727 4.2% 2.4%
American Indian/Alaska Native 60,083 63,736 2.9% 2.3%
Black/African American 35,470 41,064 1.7% 1.5%
Asian 18,338 19,426 0.9% 0.7%
Native Hawaiian/Other Pacific Islander NA 4,096 NA 0.2%
More than one race NA 21,986 NA 0.8%
Total United States b 2,042,220 2,740,453 100% 100%
Sources: CRS from various sources, including USDA, 2017 Census of Agriculture, Tables 59, 60, 63, and 64, at
https://www.nass.usda.gov/Publications/AgCensus/2017/Full_Report/Volume_1,_Chapter_1_US/; and USDA,
Highlights of the 2017 Census of Agriculture: “Female Producers” (ACH17-11); “Hispanic Producers” (ACH17-10);
“American Indian/Alaska Native Producers” (ACH17-7); “Black Producers” (ACH17-9); and “Asian Producers”
(ACH17-8), October 2019, at https://www.nass.usda.gov/Publications/Highlights/index.php/. GAO’s estimate
from GAO, Agricultural Lending, Information on Credit and Outreach to Socially Disadvantaged Farmers and Ranchers Is
Limited, GAO-19-539, July 2019. USDA estimate from CRS requested custom tabulations from the 2017 Census
of Agriculture (Inquiry 23627, March 5, 2021). Other USDA data by race, ethnicity, and gender are available in
USDA, “REGStats: USDA Race, Ethnicity, and Gender Program Statistics,” database, at
https://www.regstats.usda.gov/.
Notes: NA = not available.
a. Estimates reported from other sources may vary depending on whether based on the number of primary,
principal, or other types of producers. Terms and definitions are available at USDA, Appendix B (General
Explanation and Census of Agriculture Report Form). See text box for a discussion of producer terms.
b. “Total” reflects totals for the United States and includes non -SDFR groups. Data for each group should not
be combined (i.e., not additive), as individual groups may be counted across multiple SDFR groups (e.g.,
individual female operators who identify as Hispanic or non -White).
Congressional Research Service 9Defining a Socially Disadvantaged Farmer or Rancher (SDFR): In Brief
Figure 2. Selected Data by SDFR Status (Race, Ethnicity, and Gender), 2017
(Share of Primary Producers)
Source: CRS from 2017 Census of Agriculture data cited in GAO-19-539, July 2019. Socially disadvantaged
farmers or ranchers (SDFRs) status based on race, ethnicity, and gender (including White women) (7 U.S.C.
§2003(e)(1). See Figure 1. See text box for a discussion of producer terms.
Figure 3. Selected Data by SDFR Status (Race and Ethnicity Only), 2017
(Share of Total Producers)
Source: CRS from custom tabulations of the 2017 Census of Agriculture from USDA (Inquiry 23627, March 5,
2021). Socially disadvantaged farmers or ranchers (SDFRs) status based on race and ethnicity only (excluding
non-Hispanic White women) (7 U.S.C. §2279(a)(5)). Figure 1. See text box for a discussion of producer terms.
Congressional Research Service 10Defining a Socially Disadvantaged Farmer or Rancher (SDFR): In Brief
Available USDA Data and Information
The following is a brief overview of selected SDFR groups by gender, ethnicity, and race from
the 2017 Census of Agriculture and selected USDA statistical profiles. 32 By ethnicity and race,
groups include Hispanic, Latino, or Spanish Origin; American Indian/Alaska Native; Black or
African American; and Asian. Table 2 provides a summary of selected data.
Female Producers
In 2017, the United States had 1.1 million farms where “any principal producer is female,”
accounting for 56% of all U.S. farms. 33 Among all principal producers, women (regardless of race
and ethnicity) accounted for 29% (798,500) of all U.S. principal producers (Table 2). States with
the largest concentration of female-operated farms (as a percent of total state producers) were
Arizona, Alaska, New Hampshire, Oregon, Maine, Massachusetts, Washington, Nevada,
Colorado, and Vermont (Figure 4). Female-operated farms, mostly small-sized farms, accounted
for 38% of U.S. agriculture sales and 43% of U.S. farmland. Half of female-operated farms (50%)
had sales and government payments of less than $5,000, with 19% with sales and payments of
more than $50,000 (compared with 26% of male-operated farms) (Table 2).
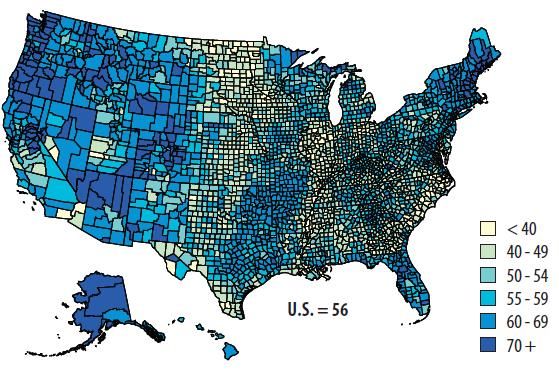
Hispanic, Latino, or Spanish Origin Producers
In 2017, the United States had 112,451 producers who identified as Hispanic, Latino, or Spanish
origin (including women), accounting for 3.3% of all U.S. producers (Table 2).34 The majority
(60%) of producers who identified as Hispanic, Latino, or Spanish origin were in Texas (41,143),
California (14,597), and New Mexico (12,212) (Figure 5). Other leading states were Florida
(7,121), Colorado (3,765), Washington (2,947), Oklahoma (2,621), Oregon (2,083), Arizona
(1,482), Missouri (1,407), Idaho (1,258), and Kansas (1,253).
32
USDA’s profiles are available at USDA, NASS, “Publications,” at https://www.nass.usda.gov/Publications/
Highlights/index.php/.
33 USDA, “2017 Census of Agriculture Highlights: Female Producers,” ACH17-11, October 2019.
34
USDA, “ 2017 Census of Agriculture Highlights: Hispanic Producers,” ACH17-10, October 2019.
Congressional Research Service 11Defining a Socially Disadvantaged Farmer or Rancher (SDFR): In Brief
Table 2. Selected Data, U.S. Producer Characteristics and Demographics, 2017
% with % with
Producera Principal Acres Avg. Sales Govt sales/govt sales/govt
(number) producers a (million) acres % who ($billion) payments payments payments
(share of (number) (share of per own (share of ($million) $50,000
Group total) (share) total) farm farm total) (share) per year per year
Women 1.2 million 798,500 388 (43%) NA NA 148.0 4,000 50% 19%
(36%) (29.1%) (38%) (45%)
Hispanic 112,451 66,727 (2.4%) 32 (3.6%) 372 78% 21.8 158 (1.8%) 57% 16%
(3.3%) (5.6%)
American
Indian or 58,199
46,210 (1.7%)
Alaska Native (1.7%)
only
59 (6.6%) 978 NA 3.5 (0.9%) 103 (1.2%) 63% 10%
… or in
combination 79,198
63,736 (2.3%)
with other (2.3%)
races
Black or
45,508
African 38,447 (1.4%)
(1.3%)
American only
… or in 4.7 (0.5%) 132 67% 1.4 (0.4%) 59 (0.7%) 57% 7%
combination 48,697
41,064 (1.5%)
with other (1.4%)
races
Asian only 22,016
16,978 (0.6%)
(0.7%)
… or in 2.9 (0.3%) 160 78% 7.5 (1.9%) 29 (0.3%) 37% 31%
combination 25,310
19,426 (0.7%)
with other (0.7%)
races
Total United 3,399,834 2,740,453 900.2 441 60% 388.5 8,943.6 44% 28%
States b
Sources: USDA, 2017 Census of Agriculture, Tables 59, 60, 63, and 64, at https://www.nass.usda.gov/Publications/
AgCensus/2017/Full_Report/Volume_1,_Chapter_1_US/. See also USDA, Highlights of the 2017 Census of
Agriculture: “Female Producers” (ACH17-11); “Hispanic Producers” (ACH17-10); “American Indian/Alaska Native
Producers” (ACH17-7); “Black Producers” (ACH17-9); and “Asian Producers” (ACH17-8), October 2019, at
https://www.nass.usda.gov/Publications/Highlights/index.php/.
Notes: NA = not available.
a. Estimates reported from other sources may vary depending on whether based on the number of primary,
principal or other types of producers. Terms and definitions are available at USDA, Appen dix B (General
Explanation and Census of Agriculture Report Form). See text box for a discussion of producer terms.
b. “Total” reflects totals for the United States and includes non -SDFR groups. Data for each group should not
be combined (i.e., not additive), as individual groups may be counted across multiple SDFR groups (e.g.,
individual female operators who identify as Hispanic or non -White).
Hispanic, Latino, or Spanish origin-operated farms accounted for 32 million acres of farmland,
roughly 3.6% of the U.S. total. These farms sold $21.8 billion in agricultural products in 2017,
accounting for 5.6% of all U.S. agriculture sales. Of these sales, 59% ($12.8 billion) were crop
Congressional Research Service 12Defining a Socially Disadvantaged Farmer or Rancher (SDFR): In Brief
sales and 41% ($9.0 billion) were sales of livestock and livestock products. USDA reports
producers in this category received $158 million in government payments in 2017, accounting for
1.8% of all payments. Hispanic, Latino, or Spanish origin-operated farms tend to be smaller-sized
compared with all U.S. farm in terms of annual sales. USDA reports that 57% of farms had sales
and government payments of less than $5,000 per year; a reported 16% of farms in this category
had sales and payments of $50,000 or more. These farms also are smaller in terms of the number
of acres farmed. USDA reports that 61% of these farms had fewer than 50 acres; the average farm
size was 372 acres (Table 2). USDA reports that 78% of Hispanic-operated farmers own all the
land they farm, and 7% of farmers rent all the land they farm.
Figure 4. Female-Operated Farms as Figure 5. Hispanic-Operated Farms as
Percent of Total Farms, by County, 2017 Percent of Total Farms, by County, 2017
Source: USDA, ACH17-11, October 2019. Source: USDA, ACH17-10, October 2019.
American Indian/Alaska Native Producers
In 2017, a reported 79,198 producers identified as American Indian or Alaska Native, either alone
or in combination with another race (including women), accounting for 2.3% of all U.S.
producers (Table 2). 35 The majority (46%) of these producers were located in Arizona (19,481)
and Oklahoma (17,102) (Figure 6). Other leading states were New Mexico (8,812), Texas
(5,663), California (2,537), Montana (2,130), Missouri (1,544), Utah (1,467), Arkansas (1,326),
Alabama (1,326), Oregon (1,255), and South Dakota (1,242).
American Indian/Alaska Native-operated farms accounted for 59 million acres of farmland,
accounting for 6.6% of U.S. farmland. American Indian/Alaska Native-operated farms sold $3.5
billion in agricultural products in 2017, accounting for less than 1% of total U.S. agriculture sales.
Of total sales by American Indian/Alaska Native-operated farms, about 40% ($1.4 billion) were
crop sales and 60% ($2.1 billion) were livestock and livestock product sales. More than half
(63%) of American Indian/Alaska Native-operated farms had sales and government payments of
less than $5,000 per year. These farms received $103 million in government payments. The
majority (73%) of these farms in this category were fewer than 180 acres in size, with an average
farm size of 978 acres in 2017.
35USDA, “ 2017 Census of Agriculture Highlights: American Indian/Alaska Native Producers,” ACH17-7, October
2019.
Congressional Research Service 13Defining a Socially Disadvantaged Farmer or Rancher (SDFR): In Brief
Black/African American Producers
In 2017, a reported 48,697 producers identified as Black or African American, either alone or in
combination with another race (including women), accounting for an estimated 1.4% of all U.S.
producers (Table 2). 36 These producers were located primarily in southeastern and mid-Atlantic
states (Figure 7). Leading states were Texas (11,741 producers who identified as Black),
Mississippi (7,028), Alabama (4,208), Louisiana (3,222), Georgia (2,870), South Carolina
(2,634), Florida (2,448), North Carolina (2,099), Oklahoma (2,074), Virginia (1,767), Arkansas
(1,525), and Tennessee (1,422). Black-operated farms cover 4.7 million acres of farmland,
accounting for 0.5% of the U.S. total. These farms sold $1.4 billion in agricultural products in
2017, accounting for 0.4% of total U.S. agriculture sales. Of total sales, USDA reports 61% ($858
million) were crop sales and 39% ($559 million) were sales of livestock and livestock products.
These farms received $59 million in government payments, accounting for less than 1% of total
government payments to all U.S. producers. Black-operated farms tend to be smaller-sized
compared with all U.S. farms in terms of annual sales. USDA reports that 57% of farms had sales
and government payments of less than $5,000 per year. A reported 7% of farms had sales and
payments of $50,000 or more (with about 36% of farms with annual sales between $5,000 and
$50,000). Black-operated farms also are smaller-sized in terms of the number of acres farmed.
USDA reports that 85% of Black-operated farms had fewer than 180 acres, with an average size
of 132 acres (Table 2). USDA reports that 67% of these farmers own all the land they farm, and
9% of farmers rent all the land they farm.
Figure 6. American Indian/Alaska Figure 7. Black-Operated Farms as
Native-Operated Farms as Percent of Percent of Total Farms, by County, 2017
Total Farms, by County, 2017
Source: USDA, ACH17-7, October 2019. Source: USDA, ACH17-9, October 2019.
Asian Producers
In 2017, a reported 25,310 producers identified as Asian, either alone or in combination with
another race (including women), accounting for 0.7% of all U.S. producers (Table 2). 37 The
majority (45%) of producers who identified as Asian were located in California (7,038 producers)
and Hawaii (4,259). Other leading states were Texas (1,908 producers), Florida (1,489),
Washington (1,008), Oregon (726), Arkansas (653), Oklahoma (589), Missouri (576), and
Wisconsin (544). Asian-operated farms accounted for 2.9 million acres of farmland, accounting
36USDA, “ 2017 Census of Agriculture Highlights: Black Producers,” ACH17-9, October 2019.
37
USDA, “ 2017 Census of Agriculture Highlights: Asian Producers,” ACH17-8, October 2019. USDA data are not
available to differentiate among various groups (such as Japanese, Chinese, Korean, Vietnamese, Filipino, Hmong).
Congressional Research Service 14Defining a Socially Disadvantaged Farmer or Rancher (SDFR): In Brief
for 0.3% of the U.S. total. Asian-operated farms sold $7.5 billion in agricultural products in 2017,
accounting for 1.9% of total U.S. agriculture sales. USDA reports Asian producers received $29
million in government payments in 2017, accounting for less than one-half of 1% of all
government payments. Asian-operated farms are more or less evenly distributed in terms of
annual sales and government payments. USDA reports that 37% of farms in 2017 were smaller in
size compared with all U.S. farms, with annual sales and payments of less than $5,000 per year.
Another 32% of these farms have sales and payments between $5,000 and $50,000, while a
reported 31% of these farms have sales and payments of $50,000 or more (Table 2). USDA
reports that 88% of these farms had fewer than 180 acres, with an average farm size of 160 acres.
A reported 78% of Asian-operated farms own all the land they farm.
Recent Congressional and Administrative Actions
Policy options to increase federal support for SDFRs and other historically underserved
agricultural producers continue to be actively debated in Congress. The American Rescue Plan
Act of 2021 (ARPA; P.L. 117-2) provided specific farm loan assistance and other USDA support
for SDFRs. 38 Other related provisions are contained in both S. 278 (Emergency Relief for
Farmers of Color Act) and S. 300 (Justice for Black Farmers Act of 2021). ARPA references the
SDFR definition at 7 U.S.C. §2279, which does not include gender. As part of the Consolidated
Appropriations Act, 2021 (P.L. 116-260), the 116th Congress provided additional emergency
COVID-19 funding for FOTO and LAMP, which provide support to SDFRs.39 Both FOTO and
LAMP reference the narrower SDFR definition at 7 U.S.C. §2279.
Other ongoing and planned activities by Congress involve heightened scrutiny of the USDA’s
treatment of SDFRs. Recent floor statements by Senator Debbie Stabenow, chairwoman of the
Senate Agriculture Committee, highlighted the need for remedies to address discrimination by
USDA that have “prevented socially disadvantaged farmers and ranchers from fully participating
in the American farm economy.”40 These and other statements by Members of Congress suggest
the 117th Congress could continue to debate USDA’s support and assistance to SDFRs.
Previously, the final June 2020 report of the House Select Committee on the Climate Crisis calls
on Congress to “increase support for beginning, young, and socially disadvantaged farmers and
incorporate climate-smart agriculture into new farmers’ programs.”41 Also during the 116th
Congress, several Members of Congress raised concerns about funding allocations and perceived
reductions for SDFRs by USDA under FOTO’s 2501 Program.42
Related activities are also underway at USDA. Secretary of Agriculture Tom Vilsack has stated
his intention to “address discrimination in all its forms across USDA agencies, offices and
programs” and “ensure [USDA] programming is equitable”; he also has mentioned the need to
38 P.L. 117-2, §§1005-1006.
39
P.L. 116-260, §754 provided additional FOT O funding of $75 million, to remain available until expended; P.L. 116-
260, §753 provided additional Local Agriculture Market Program (LAMP) funding of $100 million, to remain available
until expended. T hese provisions allow USDA to reduce the amount of matching funds otherwise required under the
2501 Program to an amount not greater than 10% of the total amount of obligated federal funds. See House Agriculture
Committee, “Overview of Agriculture and Nutrition Provisions in December 202 0 COVID Relief Package.”
40
Senate debate, Congressional Record, vol. 167, no. 42 (March 5, 2021).
41
House Select Committee on the Climate Crisis, “Invest in American Agriculture for Climate Solutions,” June 2020,
at https://climatecrisis.house.gov/one-pagers.
42 See, for example, letter from several Members of Congress to Mike Beatty, former director of USDA’s OPPE,
August 19, 2020, at https://www.youngfarmers.org/wp-content/uploads/2020/08/Lujan_Smith_2501-CCP-Letter-to-
USDA-OPPE-FINAL-with-signatures_08.19.2020-001.pdf.
Congressional Research Service 15Defining a Socially Disadvantaged Farmer or Rancher (SDFR): In Brief “root out generations of systemic racism that disproportionately affects Black, Indigenous and People of Color.”43 At a February 2021 House Appropriations Committee hearing, USDA’s inspector general addressed a series of questions regarding USDA’s efforts involving minority farmers. Topics discussed included USDA’s ongoing outreach and data collection efforts; administrative actions related to USDA’s FY2020-2024 Strategic Mission and Diversity and Inclusion Plan;44 and internal reviews of USDA’s compliance under the Civil Rights Act of 1964 (42 U.S.C. Chapter 21). 45 In addition, an Executive Order issued by the Biden Administration has identified the need to promote and allocate the “equitable delivery” of government benefits and federal resources, among other related goals. 46 These and other related efforts could result in further review of existing USDA programs and efforts to expand program support and assistance to SDFRs. Author Information Renée Johnson Specialist in Agricultural Policy Disclaimer This document was prepared by the Congressional Research Service (CRS). CRS serves as nonpartisan shared staff to congressional committees and Members of Congress. It operates solely at the behest of and under the direction of Congress. Information in a CRS Report should not be relied upon for purposes other than public understanding of information that has been provided by CRS to Members of Congress in connection with CRS’s institutional role. CRS Reports, as a work of the United States Government, are not subject to copyright protection in the United States. Any CRS Report may be reproduced and distributed in its entirety without permission from CRS. However, as a CRS Report may include copyrighted images or material from a third party, you may need to obtain the permission of the copyright holder if you wish to copy or otherwise use copyrighted material. 43 T estimony of T homas J. Vilsack, in U.S. Congress, Senate Committee on Agriculture, Nutrition, & Forestry , To consider the following nomination: The Honorable Thomas J. Vilsack, of Iowa, to be Secretary of Agricult ure, hearing, 117 th Cong., 1 st sess., February 2, 2021. 44 USDA, Office of Inspector General, Five-Year Strategic Mission and Diversity and Inclusion Plan —Fiscal Years 2020-2024, December 2019, at https://www.usda.gov/sites/default/files/USDA_OI G_2020_Five_Year_Plan.pdf. 45 U.S. Congress, House Committee on Appropriations, Subcommittee on Agriculture, Rural Development, Food and Drug Administration, and Related Agencies, Subcommittee on Agriculture Oversight Hearing: Office of Inspector General, U.S. Dept. of Agriculture, 117 th Cong., 1 st sess., February 25, 2021. As discussed, USDA’s compliance under the Civil Rights Act of 1964 involves both T itle VI (discrimination in receiving federal financial assistance) and T itle VII (discrimination in employment) of the act. 46 White House, “Executive Order On Advancing Racial Equity and Support for Underserved Communities T hrough the Federal Government,” presidential actions, January 20, 2021. Congressional Research Service R46727 · VERSION 1 · NEW 16
You can also read