Decarbonisation road map for the European food and drink manufacturing sector
←
→
Page content transcription
If your browser does not render page correctly, please read the page content below

Decarbonisation road map for the European food and
drink manufacturing sector
A report for FoodDrinkEurope

                               ED14569 | Issue number 1 | Date 07/07/2021
                                           Ricardo Confidential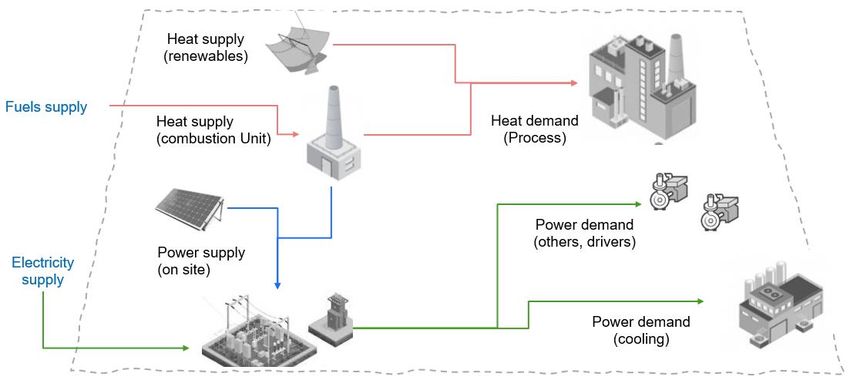
Decarbonisation roadmap for the European food and drink manufacturing sector

 Customer:                                                        Contact:
 FoodDrinkEurope                                                  Rebecca Turner, Gemini Building, Fermi
                                                                  Avenue, Harwell, Didcot, OX11 0QR, UK

                                                                  T: +44 (0) 1235 753 650
                                                                  E: rebecca.turner@ricardo.com

 Confidentiality, copyright and reproduction:                     Author:
 This report is the Copyright of Ricardo Energy &                 Iwona Cameron, Alfredo Lopez, Aaron Yule
 Environment, a trading name of Ricardo-AEA Ltd
 under contract to FoodDrinkEurope dated
 30/10/2020. The contents of this report may not                  Approved by:
 be reproduced, in whole or in part, nor passed to
                                                                  Rebecca Turner
 any organisation or person without the specific
 prior written permission of the Commercial
 Manager, Ricardo Energy & Environment.
 Ricardo Energy & Environment accepts no liability                Date:
 whatsoever to any third party for any loss or                    07/07/2021
 damage arising from any interpretation or use of
 the information contained in this report, or
 reliance on any views expressed therein, other
 than the liability that is agreed in the said
 contract.

 Ref: ED14569

 Ricardo is certified to ISO9001, ISO14001, ISO27001 and ISO45001

Ricardo Confidential                                                                                         ii
Decarbonisation roadmap for the European food and drink manufacturing sector

Executive summary
This roadmap has been developed by Ricardo Energy & Environment on behalf of FoodDrinkEurope.
It assesses the climate impact of the European food and drink manufacturing sector, and sets out some
of the available pathways for decarbonisation to net zero by 2050. The roadmap highlights the many
opportunities that are available to the sector, whilst also discussing the numerous challenges and
barriers that will need to be overcome.
What is the EU food and drink industry’s climate impact today?
The global food value chain generates 690 Mt CO2e each year. This is equivalent to a third of global
emissions (and 30% of EU emissions).
The food value chain encompasses a wide range of processes, including farming, manufacturing and
production, and transport. This study focuses specifically on the emissions associated with food and
drink manufacturing in the EU. In Europe emissions from this source are estimated to be 94Mt
CO2e/year, comprising 11% of the emissions from the whole chain. For context, this only slightly less
than the total emissions of Belgium.
The majority of the emissions from European food and drink manufacturing are associated with energy
use. Approximately two thirds (62%) of energy use is consumed as heat and one third (38%) as power
(electricity) from the grid. It is notable that a relatively high proportion of electricity is used for cooling.
This is a particular feature of this sector as it is notably higher than that seen for other manufacturing
industries. However, heat consumed at higher temperatures is currently the most challenging process
to decarbonise (using technologies that are currently mature).
This study demonstrates that there are six energy intensive sub-sectors that account for more than 50%
of European food and drink manufacturing GHG emissions. There are five countries which host 70% of
large food processing sites (those covered by the Industrial Emissions Directive). These are France,
Germany, Spain, Italy and the UK. In terms of the overall picture this is a representative figure only, as
it does not directly account for all sites (for examples the many small plants operated by small and
medium enterprises (SMEs)). There are a relatively low proportion of newer manufacturing sites in
Europe, and many of these are found in rural or remote locations, adding to the decarbonisation
challenge.
There is a huge variation in emissions across the sector. Some sub-sectors will have a much greater
decarbonisation challenge than others because they are more energy intensive in nature, but also
because of factors such as how much heat they need to use (which is difficult to decarbonise when
used at high temperatures).
Why do we need to take action now?
The EU has committed to reaching net zero emissions by 2050. As part of this target, it aims to achieve
a 55% reduction in emissions by 2030. To facilitate this, the EU is currently in the process of reviewing
many of its regulations to drive decarbonisation e.g. the European Green Deal.
The 2030 target is challenging and, with just nine years left to reach the 2030 milestone, there is a need
to act sooner rather than later. This is especially apparent given that some industrial plant energy
efficiency retrofits may take 3-5 years to complete.
The roadmap has reviewed the range of opportunities that decarbonisation can offer the food and drink
manufacturing sector. By taking a proactive approach the sector will stand to benefit from these
advantages ahead of time, and in the meanwhile assist the EU in meeting its ambitious decarbonisation
targets.
There are public funds already available for decarbonisation purposes. These are available to research
and develop decarbonisation measures, as well as to support the uptake of mature proven technologies.
This presents a big opportunity for food and drink manufacturing companies, who should be working to
access these funds now.

Ricardo Confidential                                                                                               iii

Decarbonisation roadmap for the European food and drink manufacturing sector

What can food and drink businesses do?
Businesses will need to plan their specific decarbonisation path. They should start with setting an
emissions baseline and selecting a tool that will guide them in their decision-making process when
selecting decarbonisation options. For example, using a tool such as “marginal abatement cost curves”
(MACCs) will help to select the most effective options with the lowest abatement costs. These options
are termed “low hanging fruits” and are techniques that are less costly to implement and/or deliver lower
operating costs. Companies should generally start their journey by identifying and implementing these.
Decarbonisation pathways are more targeted and effective when planned for each different process
used (disaggregated). Companies will need to implement a collection of measures since, in most cases,
there will be no “silver bullet” to achieving net zero.
Most plants will uptake decarbonisation measures relating to both energy demand and energy supply.
This roadmap provides information on more than 90 measures some of which are generic, whilst others
apply to specific process or sub-sectors. Many of these techniques have applicability restrictions,
meaning that they cannot easily be applied to every installation.
The roadmap included proven mature techniques but also describes emerging technique that are not
yet ready, either because of a low degree of maturity or a very high cost. Some of the key emerging
techniques have uncertainties associated with them (e.g. timeline to affordability) but they will ultimately
be required to ensure the required degree of emission reductions within the sector.
What are the barriers and opportunities to success?
The roadmap includes a PEST (political, economic, socio-cultural, technological) analysis that assigns
barriers and opportunities to each group of decarbonisation technologies. The most common barriers
identified are:
    •    An unstable policy environment in conflict with long company investment cycles (to depreciate
         assets).
    •    High Capex or Opex costs for some decarbonisation measures.
    •    The majority of plants are existing, and will require retrofit (often more complex than green
         field).
    •    Uncertainty around energy costs (e.g. EU ETS is already increasing electricity costs in countries
         like Spain).
    •    Achievement of net zero requires future contributions from immature technologies that are not
         currently readily available and have uncertain timelines for economic viability.
    •    Challenges for SMEs in accessing capital and technology information as well as attracting
         qualified professionals to drive decision making on energy or emission matters.
    •    Geographic location may limit access to modern or cleaner fuels infrastructure (natural gas or
         green hydrogen networks).
    •    Significant infrastructure development is necessary to increase availability of grid and/or green
         hydrogen.
The roadmap also highlights the range of opportunities that decarbonisation can offer to food and drink
manufacturing companies:
    •    Many food processing temperatures are low enough that heat could be provided by renewable
         sources (there are exceptions for some energy intensive processes).
    •    Several emissions reduction efforts in this sector will be based on reducing energy usage in
         food processing installations. This is a win-win situation that will have benefits for operators
         (lower Opex) and society (lower emissions).
    •    Policy push: There are lower operating costs related to the relative maturity of renewable
         energy technologies.
    •    Market pull: Customers are becoming more environmentally conscious and appreciate
         indicators that demonstrate lower environmental impacts (such as GHG footprints).
    •    There are numerous EU financing mechanisms related to reducing industrial GHG emissions
         using both novel and mature techniques. These provide support to facilitate the net zero
         transition (although will seldom cover all costs).

Ricardo Confidential                                                                                           iv
Decarbonisation roadmap for the European food and drink manufacturing sector This roadmap provides an overview of the pathway to net zero for the European food and drink manufacturing sector. It is important to note that within the sector there is a high degree of variability between sub-sectors and processes. This applies to the associated emissions as well as the available opportunities and challenges of implementation. As such, each sub-sector will ultimately need to develop its own detailed roadmap for reducing its emissions. Ricardo Confidential v
Decarbonisation roadmap for the European food and drink manufacturing sector

Table of Contents
Executive summary................................................................................................. iii
Table of Contents .................................................................................................... vi
1     Introduction ........................................................................................................ 1
    1.1       The need for a roadmap for the food and drink sector ........................................................... 1
2     Roadmap to achieving net zero emissions by 2050 ....................................... 3
    2.1       GHG emissions baseline ......................................................................................................... 3
      2.1.1      Data availability for 2020 ..................................................................................................... 3
      2.1.2      Generating a baseline for 2020 ........................................................................................... 4
      2.1.3      Key findings from the 2020 baseline ................................................................................... 5
      2.1.4      Apportionment of GHG emissions within the EU food and drink manufacturing sector in
      2020       ………………………………………………………………………………………………………7
      2.1.5      Emissions baseline for 1990 ............................................................................................. 10
    2.2       Defining the pathways to net zero ......................................................................................... 11
      2.2.1      Approach ........................................................................................................................... 11
      2.2.2      Decarbonisation measures ............................................................................................... 11
    2.3       Decarbonisation pathways to 2050 ....................................................................................... 18
      2.3.1      Selection of scenarios ....................................................................................................... 18
      2.3.2      Approach and assumptions ............................................................................................... 19
      2.3.3      Technology uptake levels assumed for each scenario ..................................................... 21
      2.3.4      Comparing the outcome for each decarbonisation scenario ............................................ 22
3     The way forward .............................................................................................. 25
    3.1       The impact of legislation ....................................................................................................... 25
      3.1.1      Introduction to policy ......................................................................................................... 25
      3.1.2      EU funds to support decarbonisation efforts ..................................................................... 26
    3.2       Barriers, challenges and opportunities .................................................................................. 28
      3.2.1      Opportunities ..................................................................................................................... 28
      3.2.2      Overview of barriers and challenges ................................................................................. 29
      3.2.3      Price forecast challenges .................................................................................................. 31
      3.2.4      PEST analysis for most relevant decarbonisation options ................................................ 33
4     Conclusions and recommendations .............................................................. 41
    4.1       Conclusions ........................................................................................................................... 41
    4.2       Recommendations ................................................................................................................ 43
      4.2.1      Recommendations for industrial operators ....................................................................... 43
      4.2.2      Recommendations to national governments ..................................................................... 44
Appendices ............................................................................................................. 45
A1 Identification and description of barriers and challenges during the PEST
analysis ..................................................................................................................... 1

Ricardo Confidential                                                                                                                                       vi
Decarbonisation roadmap for the European food and drink manufacturing sector A2 Full list of decarbonisation measures ............................................................. 4 Ricardo Confidential vii
Decarbonisation roadmap for the European food and drink manufacturing sector

1 Introduction
1.1 The need for a roadmap for the food and drink sector
The Paris Agreement, adopted at COP21 in December 2015, put in place a long-term goal to keep the
increase in global average temperature to well below 2°C above pre-industrial levels; and to pursue
efforts to limit the increase to 1.5°C to avoid the worst effects of climate change. As a result, the
European Union (EU) and the UK have set targets to operate as net zero economies by 2050.In
September 2020, the European Commission proposed an EU net greenhouse gas (GHG) emissions
reduction target of at least 55% by 2030. This target puts the EU on a pathway of both emissions
reductions and removals, to reach the EU Green Deal ambition of net zero emissions by 2050. The
Commission's impact assessment on the latter ambition confirms that establishing an emissions
reduction target is a realistic and feasible course of action.
In order to achieve this target, decarbonisation efforts will be needed across all sectors, including the
food and drink manufacturing sector. Working on behalf of FoodDrinkEurope, Ricardo Energy &
Environment has developed a roadmap for the achievement of net zero emissions by the European
food and drink manufacturing sector by 2050.
Objectives of the roadmap
The sector has already made substantial efforts towards reducing its emissions, decreasing them by
14% to date compared to 1990 levels. Central to this achievement has been a shift towards improved
efficiencies in the use of energy, water, transport and logistics. Also important is the increased use of
renewable energy, reduction of food waste and the move towards a circular economy, including the use
of more sustainable packaging1,2. In this context, the net zero roadmap builds on these efforts,
supporting a transition to lower emissions and enabling an acceleration and step change in
decarbonisation.
The roadmap sets out three possible pathways and provides direction for the sector on what its journey
to net zero could look like. Furthermore, this roadmap has the intention to assist individual food and
drink manufacturers with their own action plans through the identification of key decarbonisation
measures, as well as supporting consistency of approach within the wider sector, allowing for greater
collaboration. The roadmap will also enable the wider supply chain, policy makers and other
stakeholders to understand how they can work with food and drink manufacturers to achieve the net
zero goal.
Throughout the development of this roadmap, significant challenges and barriers to achieving net zero
have been identified alongside decarbonisation opportunities.
Scope of the roadmap
This roadmap focusses on the decarbonisation of the European food and drink manufacturing sector
towards net zero emissions by 2050. It considers food processing and manufacturing activities as
defined by the Nomenclature of Economic Activities (NACE) sections C10 (Manufacture of food
products) and C11 (Manufacture of beverages), with the exception of C10.2 (Processing and Preserving
of fish, crustaceans and molluscs).
The roadmap considers the greenhouse gas emissions arising within production facilities (gate-to-gate).
The emissions covered in the roadmap thus relate to Scope 1 and Scope 2 as defined by the
Greenhouse Gas Protocol3. Scope 1 emissions are direct emissions from sources owned or controlled
by companies in the food and drink manufacturing sector, for example fuels combusted on site. Scope
2 emissions are indirect emissions associated with the generation of electricity, heat and steam

1
  https://www.fooddrinkeurope.eu/priorities/detail/environmental-sustainability/
2
 https://www.fooddrinkeurope.eu/uploads/publications_documents/FoodDrinkEurope_position_on_a_carbon_neutral_Europe_b
y_2050.pdf
3
  https://ghgprotocol.org/

Ricardo Confidential                                                                                                   1
Decarbonisation roadmap for the European food and drink manufacturing sector

produced by others but consumed by the sector. The roadmap does not cover the activities upstream
(e.g. crop growth) or downstream (e.g. retail) of food processing and manufacturing.
The roadmap focusses on alternative options relating to the supply and use of energy for food and drink
manufacturing/processing, based on the assumption that food offer and demand remain in line with
current trends and that similar manufacturing processes continue to be used.
Future emissions projections, relating to several scenarios, have been developed. All of these have
been aligned with the two key time periods for which the European Commission has set emissions
reduction targets: 2020 to 2030 and 2030 to 2050.
There are certain GHG emission sources from food processing installations which are not covered in
this study due to the absence of accurate data. For example, this includes, data on losses of CO2
refrigerant from cooling systems, CO2 losses associated with the carbonisation of beverages, CO2
losses from the creation of an atmosphere to expand the lifetime of fruits or allied for novel extraction
processes (based on supercritical CO2).
GHG emissions with the food and drink value chain
Food and drink value chains are complex, and each stage contributes to GHG generation. This is why
EU climate and energy-related policies, such as “Fit for 55%” emission reduction goals are being revised
to promote emission reductions and other actions across the value chain.
Food processing makes a relatively small contribution to the overall GHG emissions of the “farm to fork”
path (” EDGAR-FOOD data” from DG JRC4). This ranges from 11% of total food change GHG emissions
in the EU to 1% in India and 3% in China. For most food products, activities upstream (crop and rearing)
and downstream (distribution, retail) of food processing contribute a larger share of overall GHG
emissions than the industrial or manufacturing stages. This is shown in Error! Reference source not
found.5. There is, however, a high variability in total GHG emissions and emissions sources inside each
food category.

4
 Crippa, M., Solazzo, E., Guizzardi, D. et al. Food systems are responsible for a third of global anthropogenic GHG emissions.
Nat Food (2021).

Ricardo Confidential                                                                                                             2
Decarbonisation roadmap for the European food and drink manufacturing sector

Figure 1: Value chain GHG emissions for selected food and drink products (source: Poore et al. 5)

The European Commission stated that in 2013, 17% of the EU’s gross energy consumption could be
attributed to the overall food and drink sector, of which 28% was used for industrial processing6. This
translates into just under 14% of CO2e emissions being attributed to industrial processing6. However,
there are variabilities between regions, countries and sub-sectors. A more recent study, focussed on
France, states that industrial food and drink processing accounts for roughly 5.5%7 of total food chain
emissions.
Each industrial installation generally has a limited set of tools (measures) to minimise or eliminate GHG
emissions. The control of GHG emissions before or after the food processing site (scope 3) is limited
as a result of being exposed to external influences. Sites can access a much wider range of tools to
influence scope 1 and 2 emissions.

2 Roadmap to achieving net zero emissions by 2050
2.1 GHG emissions baseline
The first stage when developing a net zero roadmap is to identify and understand current and past
emissions. This roadmap analysis has determined the baseline GHG emissions for the European food
and drink manufacturing sector and its projections of future GHG emissions. It uses the 1990 to 2050
timeframe set out by the European Union’s emissions reduction target.
This study provides GHG emission baseline data for two different periods:
    •    Recent and more accurate information sources are available for 2020 compared to earlier
         timeframes. This study has carried out a deep dive analysis of 2020 energy and GHG emission
         generation data to profit from this higher level of precision and accuracy.

5
  Source: J. Poore and T. Nemececk, Reducing food’s environmental impacts through producers and consumers. Science
Magazine (2018).
6
  https://op.europa.eu/en/publication-detail/-/publication/46e57060-e1b7-4f9d-82b3-d826c484ce77/language-en
7
  https://www.ademe.fr/sites/default/files/assets/documents/rapport-anglais-carbon-footprint-food-france-2019.pdf

Ricardo Confidential                                                                                                 3
Decarbonisation roadmap for the European food and drink manufacturing sector
• It is recognised that the majority of governments and public institutions are setting emission
reduction goals using 1990 as a baseline. Therefore, this study has also presented results in
1990 terms. Nevertheless, the accuracy of GHG emissions data for the sector in 1990 is lower
than for 2020.
2.1.1 Data availability for 2020
No readily available data set exists for the GHG emissions from the European food and drink
manufacturing sector (scope 1 and 2 emissions). There are accurate and updated information sources
to facilitate a 2020 baseline estimation. Examples of the available data sources, together with an
explanation of their limitations are provided below.
Data at global level:
The most relevant inventories or data from reporting organisations, such as the Intergovernmental
Panel on Climate Change (IPCC)8, provide data for food and drink sector emissions which is combined
with other sectors. Other authors (Rissman, 20209) have estimated global food processing emissions
combined with tobacco manufacturing as 4% of worldwide industrial emissions. Direct energy related
emissions were estimated at 250 Mt CO2e (circa 36%, scope 1) and indirect energy related emissions
at 444 Mt CO2e (circa 64 % Scope 2).
EU Emissions Trading System (EU ETS) data:
In Europe, data from the EU ETS is summarised for different sectors and activities by the European
Environment Agency (EEA) via its greenhouse gas inventory reporting(“Annual European Union
greenhouse gas inventory 1990–2017 and inventory report 2019”, 202110). This report provides food
and drink sector GHG emissions associated with combustion activity covered by EU ETS. This only
concerns combustion units with a total rated thermal input of more than 20MW (mainly boilers, dryers,
furnaces and heating equipment)11.
In 2017 EU ETS data showed that the total CO2e emissions from food processing, beverages and
tobacco (EU ETS category “1A2e”) amounted to 39,71 kt CO2e. This was a decrease of 23% compared
to 1990 and accounted for 8% of total manufacturing emissions.
Today the food and drink sector (with tobacco) is the fifth largest GHG emitter after non-ferrous metals
manufacturing10, iron and steel, non-metallic manufacturing and chemicals.
2.1.2 Generating a baseline for 2020
The 2020 baseline data was compiled, generated and validated at sub-sector level. Twenty-seven (27)
sub-sectors were used to gather data on production intensity (Million tonnes per year) and energy usage
(MWh per tonne of product). These figures were then converted to GHG emissions.
Data was gathered from many sources with the most relevant ones being the Best Available Techniques
Reference Document for the Food, Drink and Milk Industries (FDM BREF)12 and reports from the
European Commission’s Joint Research Centre13. The majority of key data figures used for estimations
were validated (and/or provided) by FoodDrinkEurope members’ feedback. The main steps taken to
generate the GHG emission baseline were:
1. Gather information on sub-sector activity, production rates (Million tonnes/year).
8
https://www.ipcc.ch/site/assets/uploads/2018/02/ipcc_wg3_ar5_chapter10.pdf
9 https://www.sciencedirect.com/science/article/pii/S0306261920303603
10
https://www.eea.europa.eu/publications/annual-european-union-greenhouse-gas-inventory-2021
11 Many of these combustion units belong to sugar manufacturers, dairies and breweries (more than 100 sites reporting to EU
ETS) but also others (such as feed, starch or fruit and vegetables) and there are also many combustion units in food
processing sites below the EU ETS threshold not covered by this EU ETS registry. https://www.i4ce.org/wp-core/wp-
content/uploads/2015/10/13-03-Climate-Report-39-Agriculture-in-the-EU-ETS_CDC-Climat-Research.pdf
12
https://eippcb.jrc.ec.europa.eu/sites/default/files/2020-01/JRC118627_FDM_Bref_2019_published.pdf
13
https://publications.jrc.ec.europa.eu/repository/handle/JRC96121
Ricardo Confidential 4Decarbonisation roadmap for the European food and drink manufacturing sector
2. Gather information on average specific energy usage (MWh/tonne product) e.g. from FDM
BREF.
3. Calculate energy consumption (MWh/year): Multiplying production rates with specific energy.
4. Gather indicative data on the percentage breakdown of energy usage, into either electricity or
heat. Undertake for each sub-sector.
5. Estimate GHG emissions based on the source (electricity/combustion) and quantity used:
a) Electricity - Calculate the CO2e generated by grid electricity use. Multiply electricity usage
by the CO2e intensity of power generation. For example, 20MWh electricity x 0.23 tCO2e/
MWh of electricity = 4.6tCO2e.
b) Combustion – Undertake the same as above but substitute electricity usage and its
associated carbon intensity with a combustion fuel. For example, 20MWh thermal x
0.28tCO2/kWhth = 5.6tCO2 (EU ETS figures).
Validations were carried out to ensure the quality of these estimates. Different sources were used to
validate partial data or sub-sector data such as (but not limited to):
• EU ETS voluntary reporting information from large individual companies was reviewed to
validate intensity (tCO2e / tonne food production).
• Overall sector level energy consumption matches with energy reported by a DG JRC study
(“Energy use in the EU food sector: State of play and opportunities for improvement”, 2015,
from Eurostat).
• Total GHG emissions for 2020 were 79 MtCO2e (EEA’s 2018 GHG inventory (39 Mt/y CO2e
from heat >20 MWth)).
• The 2020 baseline estimate is 93MtCO2e for the sector using raw data (energy intensity
and production rates). The UK hosts 10% of European sites and other studies14 have
reported 9 MtCO2e/year in the UK for the food processing sector. This 9 MtCO2e matches
with 10% of the 93 MtCO2e estimated in our baseline.
• The sub-sector GHG emissions from heat generation included in this baseline (using raw
data from production rates and energy intensity) matches with other studies on ETS data
for the agricultural sector15 (at combustion plants >20 MWth).
Information sources used (and our experience from similar projects in this sector) reveal high variability
in energy usage and CO2e emissions for each process or sub-sector. This has been taken into account
in the analyses (e.g. using average values). This variability depends on many factors such as product
portfolio, plant size, plant age, etc.
2.1.3 Key findings from the 2020 baseline
Following the above methodological approach, we estimate that the European food and drink sector
(including the U.K) generated circa 94 MtCO2e in 2020. 62% of these emissions were generated by the
use of heat as during processing.
Energy usage is the main source of GHG emissions in the European food and drink sector. This is
consumed either as grid electricity or heat and power generated at combustion units on site. CO2 (or
other GHGs) is not generated in conversion or manufacturing processes (other than combustion units
to deliver heat) with small exceptions on fermentation processes or CO2 addition for soft drinks. Key
data on baseline energy usage and CO2e emissions are displayed in Table 1.
Cooling systems are used intensively in many of the food processing sub-sectors. Some of the
refrigerant used in these cooling systems generates GHG emissions due to leaks and losses to the
atmosphere. There are no precise estimations available on the amount of these emissions and the use
of the associated refrigerant gases that are being phased out by European and worldwide regulations.
14
https://assets.publishing.service.gov.uk/government/uploads/system/uploads/attachment_data/file/416672/Food_and_Drink_
Report.pdf
15
https://www.i4ce.org/wp-core/wp-content/uploads/2015/10/13-03-Climate-Report-39-Agriculture-in-the-EU-ETS_CDC-Climat-
Research.pdf
Ricardo Confidential 5Decarbonisation roadmap for the European food and drink manufacturing sector
Within each sub-sector there are high levels of variability in the quantities of energy used in different
food manufacturing processes16. For example, cheese manufacturing reports a higher specific energy
usage (MJ/kg of product) than milk production (including sterilisation). The energy usage factor of an
installation depends heavily on the product portfolio but also on other parameters such as plant age or
plant size. For example, new equipment such as turbines, boilers or dryers, have a higher energy
efficiency.
The specific energy usage of food and drink manufacturing processes ranges from 5.2 MWh/tonne of
product in processes with high energy requirements to 0.1 MWh/tonne (Table 1) for less intense ones.
Sub-sectors with a higher proportion of energy consumption attributed to grid electricity (up to 100%)
will more easily follow their decarbonisation pathways since most grid supplies are decarbonising at
rates set by EU goals. On the contrary, some sub-sectors consuming only 5% of their energy from grid
electricity will see their decarbonisation pathway driven by economic viability of heat decarbonisation
measures and access to finance/capital.
The average specific GHG emissions (tonnes CO2e per tonne of product (scope 1 and 2)) from food
and drink manufacturing processes ranges from 1.27 (ethanol manufacturing) to 0.05 (e.g. beer).
Most food and drink manufacturing processes that require heat (such as drying or pasteurisation) have
a low temperature requirement (below 150ºC). These low temperature heat demand processes are a
good opportunity for the use of renewable energy heat sources (see Section Error! Reference source
not found.).
The products manufactured by the food and drink sector will remain after the transition to a net zero
economy. Other products such as fossil fuels directly generate GHG emissions and will be expected to
undergo significant production reduction after the implementation of Green Deal policies. Food and
drink processing generates GHG emissions by using energy to manufacture products, rather than from
the products themselves. Therefore, there is not a need to change the products or processes
themselves, only the way energy is consumed.
Table 1: Baseline data for energy usage and CO2e emissions (2020)
Energy Share of energy CO2e emissions
Production Specific Total Electricity Heating Total Electricity Heat
106 Mt Mt
Sub-sector Mt/y MWh/t MWh/y % % CO2e /y Mt CO2e /y CO2e /y
Feed 153 0.57 87.2 30 70 21.4 7.3 14.0
Beer 41 0.19 7.9 30 70 1.9 0.7 1.3
Market milk 150 0.18 26.3 30 70 6.4 2.2 4.2
Cheese 5.5 0.79 4.3 80 20 1.2 1.0 0.2
Milk powder 2.5 1.10 2.8 30 70 0.7 0.2 0.4
Ethanol 5 5.20 26.0 30 70 6.4 2.2 4.2
Fish processing 4.5 0.40 1.8 70 30 0.5 0.4 0.1
Frozen Fruit & Veg (non
tomato/potato) 5 1.10 5.5 12 88 1.3 0.2 1.1
Rest/Canned F&V (non
tomato/potato) 4 1.10 4.4 12 88 1.0 0.1 0.9
Jams F&V (non tomato/potato) 1 3.00 3.0 30 70 0.7 0.3 0.5
Dried fruit/veg 0.9 0.30 0.3 50 50 0.1 0.0 0.0
Cut potato products (frozen) 5.6 0.85 4.8 25 75 1.2 0.3 0.8
Potatoes - Flakes & granulates
(dried) 0.5 4.20 2.1 5 95 0.5 0.0 0.5
Potatoes - Rest/ others (crisps
snacks) 2.5 1.60 4.0 20 80 1.0 0.2 0.7
16
For example, cheese manufacturing reports higher specific energy (MJ/kg of product) than milk production (including
sterilisation).
Ricardo Confidential 6Decarbonisation roadmap for the European food and drink manufacturing sector
Energy Share of energy CO2e emissions
Production Specific Total Electricity Heating Total Electricity Heat
106 Mt Mt
Sub-sector Mt/y MWh/t MWh/y % % CO2e /y Mt CO2e /y CO2e /y
Tomato processing 8 1.28 10.2 20 80 2.4 0.6 1.9
Grain milling 35 0.65 22.6 100 0 6.3 6.3 0.0
Meat processing 12.5 0.95 11.9 70 30 3.1 2.3 0.8
Crushing & refining of rape
and sunflower seeds 41 0.70 28.7 20 80 6.9 1.6 5.3
Crushing & refining of soya
beans 17 0.90 15.3 25 75 3.7 1.1 2.6
Standalone refining 5 0.25 1.3 30 70 0.3 0.1 0.2
Olive oil 2.2 0.60 1.3 100 0 0.4 0.4 0.0
Soft drinks & juices 34 0.08 2.6 80 20 0.7 0.6 0.1
Native & modified starch 5 1.00 5.0 30 70 1.2 0.4 0.8
Starch-proteins and fibres 5 1.60 8.0 30 70 2.0 0.7 1.3
Starch derivatives (including
glucose, maltodextrins,
polyols) 6 1.50 9.0 30 70 2.2 0.8 1.4
Sugar 16.4 2.10 34.4 3 97 8.0 0.3 7.7
Others 40 1.24 49.5 30 70 12.1 4.2 8.0
Total 608.1 1.24 380.1 38 62 93.6 34.4 59.2
2.1.4 Apportionment of GHG emissions within the EU food and drink manufacturing
sector in 2020
Distribution by manufacturing processes that have larger GHG generation
Our baseline data shows that GHG emissions generation is distributed across more than 20 sub-
sectors, each presenting a high variability in terms of energy use and therefore also of GHG emissions.
There are six sub-sectors with higher energy intensity that account for more than 50% of the GHG (so
transition will be more challenging for them). The majority of sub-sectors account only for 1 to 2 % of
the food and drink sector CO2e generation. There are several sub-sectors (e.g. sugar or dried potatoes)
where energy usage is almost entirely from on-site combustion, higher than 95% of energy share. These
processes will have more challenging decarbonisation paths, especially if requiring high operating
temperatures.
Within most sub-sectors there is a large share of small installations operated by small and medium-
sized enterprises (SMEs). There are many combustion units below 20 MWth, which are not covered by
official/mandatory databases, such as EU ETS.
Figure 2 shows net energy usage per sub-sector.
Ricardo Confidential 7Decarbonisation roadmap for the European food and drink manufacturing sector
Figure 2: Total annual energy usage per sub-sector
Distribution between European countries with larger food and drink sector manufacturing GHG
emissions
According to the EEA, based on data from the EU ETS on emissions by country in 2019, the largest
GHG emitters from the EU food and drink sector were : France (18%), Spain (13%), UK(10%), Poland
(10%); and Italy (9%). The countries that had achieved the greatest GHG emissions reduction in this
sector since 1997 are: Sweden (16%), Latvia (10%) and Finland (1%). Other countries have reported a
GHG emissions increase in this period, such as Germany, Italy and Spain.
According to the European Pollutant Release and Transfer Register (E-PRTR) and, based on the
number of installations covered by the Industrial Emissions Directive (IED)), France, Denmark, the
United Kingdom, Spain, Poland and Italy have the largest number of installations in 2020. This is
consistent with EEA (EU ETS) data on quantity of emissions. This database provides information on
different IED categories. Error! Reference source not found. shows the number of sites present in
the countries that are most dominant in the food and drink sector.
Table 2: Number of large food and drink manufacturing installations in selected European countries
Country IED Europe France Germany United Spain Italy
code Kingdom
Processing Animal 6.4 b (i) 687 217 50 87 69 88
Processing Vegetable 6.4 b (ii) 1548 268 204 200 243 153
Ricardo Confidential 8Decarbonisation roadmap for the European food and drink manufacturing sector
Country IED Europe France Germany United Spain Italy
code Kingdom
Combination of feedstocks 6.4 b 603 231 101 56 57
(iii)
Dairies 6.4 c 469 1 107 29 46 36
Total 3307 717 462 372 358 334
Share % 100% 22% 14% 11% 11% 10%
Cumulative share 22% 36% 47% 58% 68%
Table 2 shows that five countries account for 68% of the food and drink manufacturing installations in
Europe (EU and UK). Similar analysis could be done for emissions volume per process or sub-sector.
Figure 3 provides the total number of large food and drink sector installations (those covered by IED)
in each European country.
Figure 3: Food and drink large (IED covered) installations across Europe
Distribution between units, equipment, and operations
Roughly two thirds of the energy used in the food and drink processing sector comes from natural gas.
The second largest source is electricity, with, a minor contribution from coal and oil in third place.
Processes with high heat demand are drying, evaporation, baking ovens, pasteurisation, etc. Systems
that use electricity12 include refrigeration, cooling, ventilation, lighting, pumping, air compression, etc.
Figure 4 shows how electricity consumption by the food and drink manufacturing sector can be
apportioned to the use of different technologies. The significant proportion of energy used by cooling
systems is a specific feature of food and drink manufacturing.
Ricardo Confidential 9Decarbonisation roadmap for the European food and drink manufacturing sector Figure 4: Share of electricity consumption (demand) of cross-cutting technologies in the food and drink manufacturing sectorError! Bookmark not defined. Conclusions derived from the 2020 baseline data Based on the insights described (for larger sectors and countries) the study has maintained a wide scope for the analysis of measures to decarbonise the sector. It was not possible to discount any processes or countries on the basis of being insignificant. The measures and next steps included in this report are not applicable for every country and every sub- sector. Political, Economic, Social and Technological (PEST) analysis (see Section 3.2) has been used to describe applicability restrictions of these measures taking into account the geographical and process diversity. 2.1.5 Emissions baseline for 1990 As previously explained, several policy instruments and relevant studies (e.g. IPCC) are currently expressing their emission reduction goals or ambitions using 1990 as a baseline. Between 1990 and 2020 production by the food and drink sector grew by up to 20% in a number of sub- sectors, according to the EEA9. Despite this there was a reduction in the sector’s net GHG footprint. This emission reduction was achieved through higher energy efficiencies and is mainly associated with the reduced use of heating energy, while electricity use has remained relatively stable. Energy efficiency measures are often not considered as a top priority to increase profitability since energy bills are typically low (2 to 10% of Opex) for a number of food and drink manufacturing processes. In terms of heat, the energy consumed in the EU food and drink manufacturing sector has been decreasing in recent decades while production has been growing. For example, in the UK, since the 1990s, the food and drink sector has lowered its heat related carbon footprint, improving its energy efficiency by 20% between 1990 and 201017. In Europe, the total GHG emissions associated with heat consumption in the food and drink sector have decreased by 23% since 1990 and by 1% between 2018 and 201918. These heat related GHG emissions were equivalent to 72 MtCO2e at the 1990 baseline year. 17https://assets.publishing.service.gov.uk/government/uploads/system/uploads/attachment_data/file/416672/Food_and_Drink_ Report.pdf 18 https://www.eea.europa.eu/publications/annual-european-union-greenhouse-gas-inventory-2021 Ricardo Confidential 10
Decarbonisation roadmap for the European food and drink manufacturing sector

Our study assumes that grid electricity used by the food and drink sector has remained similar to 1990
levels (mentioned in recent food industry studies16). This represents 34 MtCO2e in 1990 for power-
related emissions.
The overall net GHG emissions for the sector in 1990 are therefore estimated to be 106 MtCO2e. This
is 14% higher than the estimated emissions for 2020.

2.2 Defining the pathways to net zero
2.2.1 Approach
The net zero 2050 roadmap has been developed using the approach shown in Error! Reference
source not found..
Figure 5: Roadmap development flowchart

The roadmap has been developed by considering two possible futures for the EU food and drink sector
in the form of pathways to net zero that involve different combinations of decarbonisation options. The
pathways help the sector understand how changes in future market forces, supply chains, policies,
incentives, availability of funding, among other factors, may gradually change the course of action for
the sector, and what could be the alternative paths to net zero for the sector as progress is being made
over time.
The pathways highlight a number of enabling actions that different stakeholders in the food and drink
sector would need to follow to be able to implement each pathway to net zero. A number of actions and
decarbonisation options that could be enabled more quickly have also been included in these two
pathways. These are further discussed in Section 4.4.

2.2.2 Decarbonisation measures
Food and drink processing typically has a high heating and cooling demand and is uniquely placed to
implement a wide range of decarbonisation measures. The majority of interventions reviewed are
relevant for all food and drink sectors but some sub-sector specific actions have also been included.

Ricardo Confidential                                                                                       11
Decarbonisation roadmap for the European food and drink manufacturing sector

Decarbonisation measures for this report have been identified by reviewing the sector's best practices
and predicted technology development and selected, in consultation with FoodDrinkEurope members’
feedback. There is still capacity to implement mature energy efficiency measures so the list of
decarbonisation options consists of both mature and novel technologies with the potential to become
more prevalent in the next 20 years. The maturity of the measures has been evaluated using the
Technology Readiness Level (TRL) descriptor. Technologies of maturity Level 7, 8 and 9 have been
reviewed for their decarbonisation capacity. TRL Level 7 indicates prototypes that have been used in
an operational environment, TRL 8 – technology that has been proven to work under typical conditions
and TRL 9 systems’ operation is proven through mission operations.
The list of decarbonisation measures has been prepared with the lens of applicability in the food and
drink sector, reviewing barriers, drawbacks, and additional technologies required for successful
implementation. With SMEs comprising more than 90% of the sector19, the relevance to the SME market
has also been considered. There are also large installations with high energy intensity where
decarbonisation will entail sector specific challenges. The list of actions was varied and covered
changes to the processes and renewable energy generation options.
The long list of measures initially identified was grouped to model their decarbonisation potential. Error!
Reference source not found.Figure 6: Categories of decarbonisation measure and technique, shows
the key categories. The complete list has also been included in Appendix 3.
As shown in Figure , food and drink processing sites can introduce decarbonisation measures at both
the supply and demand side of energy use. This applies to both heat and power.
An example could be a local anaerobic digestor producing biogas from process residues (e.g. to use
organic content in effluent during water treatment). There is excellent potential to deploy biogas at
industrial sites for both heat supply and fuel. Several plants are already using this option (European
Biogas Association20). Due to its properties, organic stabilised form, the digestate can also be used in
agriculture as a chemical fertiliser replacement. High thermal needs mean that biomethane availability
can facilitate the decarbonisation of the sector.
Another example on the supply side is green hydrogen, which is a clean-burning fuel. Hydrogen is seen
to have considerable potential, with a substantial part of the funding for Green Initiatives in the EU being
directed towards green hydrogen research and development. Hydrogen’s versatility means it has the
potential to disrupt many processes, including energy storage and supply. The Hydrogen Council21
estimate that by 2050 the hydrogen market could accommodate 18% of global energy consumption (vs
4% today). However, there are barriers on its applicability (see section 3.2 of this report).
The food and drink sector can also reduce energy demand on-site by introducing proven and mature
energy efficiency technologies and novel technologies, including sub-sector specific applications. More
efficient equipment utilising robotics and flexible automation, more efficient motors, and removing heat
requirement from processes can further decarbonise processing sites.
Error! Bookmark not defined.

19https://eippcb.jrc.ec.europa.eu/sites/default/files/2020-01/JRC118627_FDM_Bref_2019_published.pdf

20
   https://www.europeanbiogas.eu/wp-content/uploads/2021/04/Paper-The-role-of-biogas-production-from-wastewater-in-
reaching-climate-neutrality-by-2050.pdf
21
   https://hydrogencouncil.com/wp-content/uploads/2021/02/Hydrogen-Insights-2021.pdf

Ricardo Confidential                                                                                                  12
Decarbonisation roadmap for the European food and drink manufacturing sector

Figure 6: Categories of decarbonisation measure and technique

2.2.2.1    Energy management measures
The first category of energy management interventions includes process management and optimisation
measures. The actions are usually low-cost, available to all sub-sectors and result in reduced energy
use on-site. These measures are a starting point for other interventions. Some of the measures,
although low cost, will require staff commitment and will need to be repeated on a regular or on-going
basis.
The energy management measures focus on optimising processes and reducing energy intensity and
there is still capacity to implement them across the sector. The following techniques can be used to
achieve energy reduction:
    •     Regular energy auditing and energy monitoring (using Key Performance Indicators and
          benchmarking).
    •     Use of adaptive controls and sensors for measurement of core parameters.
    •     Decision making support systems such as energy plans (see section 2.3.2.1.8 of the FDM
          BREF) – energy management systems.
    •     Pinch analysis used to identify heat recovery opportunities or to determine minimum process
          heating and cooling, especially in the brewing sector and the milk powder industry.

Regular maintenance of manufacturing assets is key to preventing a reduction in energy efficiency due
to, for example, lower compression efficiency, air leakage and pressure variability.
Table 3: Sample energy management decarbonisation measures

 Examples of actions /                  Generic/        Capex/
                                                                      SMEs?        TRL         Scope 1   Scope 2
 interventions                          specific        Opex

   Energy Management Systems              Generic          Opex                Y   9; BAT(1)       Y         Y

                           Controls       Generic          Opex                Y    9; BAT         Y         Y

                      Maintenance         Generic          Opex                Y    9; BAT         Y         Y

     Other managerial measures
                                          Generic          Opex                Y    9; BAT         Y         Y
                 (training, etc)
(1)Best Available Technique

Ricardo Confidential                                                                                        13
Decarbonisation roadmap for the European food and drink manufacturing sector
2.2.2.2 Decarbonisation of combustion units and electrification of heat
There are both mature and novel solutions to decarbonise combustion units and a gradual shift towards
renewable generation can be seen across all sub-sectors. Table 4 shows a selection of interventions
available to the food and drink sector.
Table 4: Sample measures for decarbonisation of combustion units
Generic/ Capex/ Scope Scope
Examples of actions/interventions SMEs? TRL
specific Opex (2) 1 2
CHP Generic Capex N 9; BAT Y Y
Combined cycle Generic Capex N 9; BAT Y Y
Heat pump for hot water generation
Small
(sanitary, heating, water tracing, Generic Y 9; BAT Y Y
Capex
cleaning, etc)
Replacement/New unit with higher
Generic Capex Y 9; BAT Y Y
Energy eff.
Bio based fuels (biogas, e.g. from Small
Generic Y 9; BAT Y N
Anaerobic digestor) capex
Novel Anaerobic digestion features for
Generic Capex N 8; ET Y N
Biogas generation from wastewater
Small
Bio based fuels (biomass)(1) Generic Y 9; BAT Y N
Capex
Residues/waste as fuel Generic Capex Y 9; BAT Y N
CO2 capture and storage (CCS) Generic Capex N 9; BAT Y N
Gasification/pyrolysis of solid waste /
Generic Capex N 9; BAT Y N
residues
Cleaner fuels (H2) Generic Opex Y 8; ET Y N
Cleaner fuels (Ammonia) Generic Capex Y 6; ET Y N
(1)Certain biobased fuels (such as woody biomass) would be consumed under cascade guidance generated by
EU (non-binding).(2) A number of interventions (like H2 as fuel) will have impact on Opex and Capex but only
most significant one is reported here.
There is excellent decarbonisation potential in switching from fossil fuels to renewable energy. The
International Renewable Energy Agency projects that 60%22 of existing heat demand can be provided
by renewable energy, especially that requiring low to medium temperatures. The most significant
potential for integrating renewable energy is seen in biomass energy, solar thermal heating,
and geothermal heat pumps. Heat pumps (using electricity from renewable sources) can be used to
increase the drying efficiency of conventional air dryers and perform as dehumidifiers.
The use of bioenergy or bio-feedstocks to generate heat, including options that deliver electricity, is a
mature technology recognised by the food and drink sector. In certain sub-sectors, such as dairy,
switching to biogas obtained from anaerobic digestion can bring significant emissions reduction.
Switching from combustion to electric heating can also provide substantial reductions but
decarbonisation is dependent on the energy mix in the grid in the given location.
Low carbon hydrogen can also be used as an alternative fuel, but achieving true emissions abatement
potential will rely on innovation, both in hydrogen production and infrastructure.
Carbon capture and storage (CCS) has been reviewed but due to its high cost is not deemed as
applicable to the food and drink sector, in particular the SME segment.
22 https://www.fooddrinkeurope.eu/uploads/publications_documents/SME_White_Paper.pdf
Ricardo Confidential 14Decarbonisation roadmap for the European food and drink manufacturing sector
Geothermal technologies, including the use of ground source heat pumps (up to 50°C), direct
geothermal energy (up to 100°C), and deep and enhanced geothermal systems (up to 190°C) have
been included in this group of measures. However, it has been recognised that the technologies yielding
higher temperatures in particular, are only available in certain geolocations and might require significant
investment, even at the feasibility stage of the project.
Solar systems represent a significant contribution to renewable generation, both in the form of solar
photovoltaics and solar heat (concentrated solar systems and non-concentrated solar heat
installations). Non-concentrated solar heat options can be used to pre-heat the water in small
applications and can be an affordable renewable option for the industry. Concentrated solar
technologies use mirrors and lenses to focus a large area of sunlight onto a receiver which in turn can
be converted to heat (solar thermal energy) or electricity can be generated using a heat engine
connected to an electrical power generator.
2.2.2.3 Lower heat demand
Process heat can account for 60-70% of the total energy needs in the food and drink sector, with some
processes (e.g. baking) experiencing significant heat loss23. Some baking and processing equipment
loses over half of its energy to the atmosphere24. This is associated with difficulties in customising the
control of the operation of some of these ovens25. Therefore, lowering the heat demand shows great
potential for decarbonisation of the sector, as shown in Table 5.
Evaporation and pasteurisation, which operate at lower temperatures, can benefit from heat recovery
from other processes. Examples of processes that can apply heat or steam recovery are baking and
bread proving, steam cooking tunnels, sterilisation and drying.
Heat recovery and on-site steam, electricity, and heat production, using distributed generation, co-
generation, or combined heat and power (CHP), can also lower overall heat demand and have been
included in this review.
Table 5: Sample decarbonisation measures focused on lowering heat demand
Generic/ Capex/
Examples of actions / interventions SMEs? TRL Scope 1 Scope 2
specific Opex
Heat recovery Generic Capex Y 9; BAT Y N
Identification of heat recovery option Small
Generic N 9; BAT Y N
(Pinch analysis) Capex
Small
Insulation Generic Y 9; BAT Y N
Capex
Optimising steam distribution
Generic Capex Y 9; BAT Y N
systems
Mechanical Vapor Re-Compression Capex
Generic Y 9; BAT Y Y
(MVR) & Opex
Replacement/ new cooking
Specific Capex Y 9; BAT Y Y
device/unit (more effi.)
Separation with membrane (instead of
Specific Capex Y 7; ET Y Y
heat)
Small
Cleaning (CIP) without heat Generic Y 7; ET Y Y
Capex
23
Alia Ladha-Sabur, et al. Mapping energy consumption in food manufacturing. Trends in Food Science &
Technology, 86 (2019), pp. 270-280
24
Sanjay Mukherjee, Abhishek Asthana, Martin Howarth, Ryan Mcneill, Ben Frisby. Achieving operational excellence for
industrial baking ovens Energy Procedia, 161 (2019), pp. 395-402
25
https://c2e2.unepdtu.org/wp-content/uploads/sites/3/2016/03/cts402-improving-efficiency-of-bakery-ovens-0.pdf
Ricardo Confidential 15You can also read