De novo transcriptomic profiling of differentially expressed genes in grass halophyte Urochondra setulosa under high salinity
←
→
Page content transcription
If your browser does not render page correctly, please read the page content below
www.nature.com/scientificreports
OPEN de novo transcriptomic profiling
of differentially expressed genes
in grass halophyte Urochondra
setulosa under high salinity
Anita Mann1*, Naresh Kumar1, Ashwani Kumar1, Charu Lata1, Arvind Kumar1,
Babu Lal Meena1, Dwijesh Mishra2, Monendra Grover2, Sonam Gaba2, C. Parameswaran3 &
Nitin Mantri4
Soil salinity is one of the major limiting factors for crop productivity across the world. Halophytes have
recently been a source of attraction for exploring the survival and tolerance mechanisms at extreme
saline conditions. Urochondra setulosa is one of the obligate grass halophyte that can survive in up
to 1000 mM NaCl. The de novo transcriptome of Urochondra leaves at different salt concentrations
of 300–500 mM NaCl was generated on Illumina HiSeq. Approximately 352.78 million high quality
reads with an average contig length of 1259 bp were assembled de novo. A total of 120,231
unigenes were identified. On an average, 65% unigenes were functionally annotated to known
proteins. Approximately 35% unigenes were specific to Urochondra. Differential expression revealed
significant enrichment (P < 0.05) of transcription factors, transporters and metabolites suggesting the
transcriptional regulation of ion homeostasis and signalling at high salt concentrations in this grass.
Also, about 143 unigenes were biologically related to salt stress responsive genes. Randomly selected
genes of important pathways were validated for functional characterization. This study provides
useful information to understand the gene regulation at extremely saline levels. The study offers the
first comprehensive evaluation of Urochondra setulosa leaf transcriptome. Examining non-model
organisms that can survive in harsh environment can provide novel insights into the stress coping
mechanisms which can be useful to develop improved agricultural crops.
The food supply for increasing human population is rapidly declining with scarcity of land and fresh water for
agriculture. This problem is further exacerbated by climate change that increases the incidence of various abiotic
stress factors. Thousands of species of naturally stress-resistant plants have evolved with time, some of which
have already been domesticated by humans and are considered minor crops. Broader cultivation of these minor
crops will diversify plant agriculture and human diet and will, therefore, help in improving global food security.
More research is, therefore, required for understanding and utilizing these naturally stress-resistant plants.
Technologies are now available to rapidly improve plant genetics, with the goal of increasing productivity while
retaining stress resistance and nutritional value1. Although a lot of information is available for salt tolerance
mechanism of glycophytes such as Arabidopsis thaliana2 and halophytes such as Thellungiella halophile, yet the
specific regulatory mechanisms that enable halophytes (naturally stress-resistant plants) to survive in extremely
saline habitats has still not been completely elucidated.
Globally, approximately 20% of cultivated land is affected by soil s alinization3,4, and it is predicted to reach
50% in 20505. In India, salt-affected soils occupy an area of about 6.73 million ha of which saline and sodic soils
constitute roughly 40% and 60%, respectively. Soil salinity is an increasing problem for agriculture, affecting the
most productive crop areas of the world. The agricultural production is, therefore, threatened by unavailability
of more agricultural land and few salt-resistant varieties. This makes it imperative to develop salt stress resistant
crop plants.
One of the ways to make salt stress tolerant crop plants is to genetically engineer them to sustain their
growth and productivity in challenging environments. This requires exploring gene pool of wild relatives of crop
1
ICAR-Central Soil Salinity Research Institute, Karnal, Haryana, India. 2ICAR- Indian Agricultural Statistical
Research Institute, New Delhi, India. 3ICAR- National Rice Research Institute, Cuttack, Odisha, India. 4School of
Science, RMIT University, Victoria, Australia. *email: anitadgr13@gmail.com
Scientific Reports | (2021) 11:5548 | https://doi.org/10.1038/s41598-021-85220-7 1
Vol.:(0123456789)
www.nature.com/scientificreports/
Figure 1. Urochondra setulosa plants at different treatment levels.
plants. This can be achieved by analysing global gene expression of salt tolerant species to reveal the underlying
regulatory and metabolic mechanisms. Glenn et al. (1999)6 have suggested a number as high as 6000 species
of halophytes and additionally, the eHALOPH7, Halophyte Database currently identifies more than 1500 spe-
cies as salt tolerant, without labelling them as halophyte. The main halophytes explored for physiological and
molecular studies for salt tolerance mechanism include Sueda8,9, Spartina species10, Salicornia brachiate11 and
Atriplex etc. Still the salt tolerant grasses (STGs) that have not been explored for gene network analysis may be
utilised to elucidate their mechanisms of survival at high salt concentrations. Urochondra setulosa (Poaceae) is a
rhizomatous perennial grass that grows in dune slacks, banks of salt-water creeks and saline flats. It is distributed
in Northern Africa through Arabia, southern coast of Pakistan (Sindh) and Northwest India12. It can survive up
to 1000 mM NaCl but genomically, its mechanism of survival in high saline environment has not been explored.
Next-generation sequencing coupled with bioinformatics tools provides a platform for high-throughput analysis
of key metabolic pathways involved in stress response and adaptation. Here, we used RNA sequencing to identify
the genes present in a highly salt tolerant non-model plant species, Urochondra setulosa and identify the genes
associated with salt tolerance.
Materials and methods
Plant material. The halophyte grass Urochondra setulosa was collected from Rann of Kutch (the natural
saline habitat of the halophyte) Bhuj, Gujarat, India and raised through root cuttings in pots and then established
in lysimeters filled with sandy soil in a screen house under natural conditions at ICAR—Central Soil Salinity
Research Institute (CSSRI), Karnal, Haryana, India (Fig. 1). The treatment levels of salinity i.e. ECe ~ 30 dS/m
(~ 300 mM NaCl), ECe ~ 40 dS/m (~ 400 mM NaCl) and ECe ~ 50 dS/m (~ 500 mM NaCl) were maintained
through saline water irrigation (3:1 chloride dominated salinity) in three replicates along with one set of control.
Leaves were harvested at vegetative stage after 48 h of saline irrigation. In terms of soil salinity, ECe of 4dS/m
equals to approximately 40 mM N aCl13. All methods were performed following the relevant guidelines and
regulations.
RNAseq library preparation. RNA sequencing libraries were prepared with Illumina-compatible NEB-
Next Ultra Directional RNA Library Prep Kit (NEB, USA) as per manufacturer’s instructions. mRNA was iso-
lated from total RNA (100 ng to 1 µg) and subjected to first strand synthesis in the presence of Actinomycin D
(Gibco, life technologies, CA, USA) followed by second strand synthesis. HighPrep magnetic beads (Magbio
Genomics Inc, USA) were used to purify double-stranded cDNA and after end-repairing and adenylation, it was
ligated to Illumina multiplex barcode adapters as per NEBNext Ultra Directional RNA Library Prep Kit protocol.
The adapter-ligated fragments were enriched through amplification of adapter-ligated cDNA using Indexing-
PCR (37 °C for 15mins, denaturation at 98 °C for 30 s followed by 15 cycles of 98 °C for 10 s, 65 °C for 75 s and
65 °C for 5mins. The final PCR product (sequencing library) was purified with HighPrep beads, quality was
checked on Qubit fluorometer (Thermo Fisher Scientific, MA, USA) and fragment size distribution was analysed
on Agilent 2200 Tapestation.
Scientific Reports | (2021) 11:5548 | https://doi.org/10.1038/s41598-021-85220-7 2
Vol:.(1234567890)
www.nature.com/scientificreports/
Assembled transcripts (Urochondra) Clustered transcripts (Urochondra)
Number of transcripts identified 165,794 120,231
Maximum contig length 15,263 15,263
Minimum contig length 300 300
Average contig length 1,275.0 ± 1,061.5 1259
Median contig length 853.5 1555
Total contigs length 211,394,399 155,760,927
Total number of non-ATGC characters 0 0
Contigs ≥ 200 bp 165,794 123,715
Contigs ≥ 500 bp 123,385 92,646
Contigs ≥ 1 Kbp 77,203 56,845
Contigs ≥ 10 Kbp 29 21
N50 value 1851 1819
Table 1. Assembly Statistics of unigenes in Urochondra setulosa.
de novo transcriptome sequencing and data processing. Plant samples in two biological replicates
per treatment were used for sequencing on Illumina HiSeq sequencer at Genotypic Technology, Bangalore
(India) to generate 150 base pair length paired-end reads. On an average 46.08 million raw sequencing reads for
each treatment samples were generated which were processed for quality assessment and low-quality filtering
before the assembly. The raw data generated was checked for the quality using FastQC14 and pre-processing of
the data was done with Cutadapt15. Data with Q-score above 30 (> 99.9% correct) was taken as high quality data.
Processed reads were assembled using graph-based approach by Trinity program. The characteristic proper-
ties, including N50 length, average length, maximum length, and minimum length of the assembled contigs
were calculated (Table 1). Clustering of the assembled transcripts based on sequence similarity was performed
using CD-HIT-EST16 with 95% similarity between the sequences, reducing the redundancy without exclusion
of sequence diversity and was used for further annotation and differential expression analysis. Processed reads
were aligned back to the final assembly using B owtie17 with end to end parameters.
Differential expression analysis. DESeq, a R package was used for differential expression calculation18.
DESeq provides methods to test for differential gene expression using a prototype based on negative binomial
distribution and a shrinkage estimator for the distribution’s variance. Sequencing (uneven library size/depth)
bias among the samples was removed by library normalization using size factor calculation in DESeq.
GO annotation and pathway analysis of DEGs. Uniprot and KEGG pathway databases were used for
functional annotation of the transcripts for homology approach through BLAST against “viridiplantae” data.
Transcripts were assigned with a homolog protein from other organisms, if the match was found at e-value less
than e-5 and minimum similarity greater than 30%. KAAS server was explored for assigning pathway analysis.
Since no reference genome is available for the halophyte, Urochondra setulosa, hence for pathway identifica-
tion Zea mays, Oryza sativa japonica, Musa acuminata and Dendrobium officinale were considered as reference
organisms being monocots from same family Poaceae.
Validation of DEGs by qPCR. Quantitative real-time PCR (qPCR) analysis was performed on CFX96
real-time PCR (Bio-Rad) to validate the differentially expressed transcripts. Ten DEGs were randomly selected
for qPCR analysis. Total RNA was isolated from the same sample as used for RNAseq and treated with the DNase
I followed by cDNA synthesis using First Strand cDNA Synthesis Kit (Thermo Scientific). The primer sets for
randomly selected DEGs were designed using an online Primer Quest tool from Integrated DNA Technologies
(https://eu.idtdna.com/Primerquest/Home/Index) as listed in Table 2. Real-time PCR was performed with 20 µl
PCR reaction mixture prepared according to the instruction provided with SsoAdvanced Universal SYBR Green
Supermix (Bio-Rad). The qPCR of each gene was done in three technical replicates with three biological repli-
cates. Actin was used as a reference gene and ΔΔCT method was used to calculate the fold c hange19.
Results
Read statistics and de novo assembly. Approximately 368.70 million raw reads were generated by Illu-
mina paired-end transcriptome sequencing and used for the downstream analysis. After the quality control,
on an average 95.66% of clean reads (high quality reads having Phred score > q30) were obtained. The high-
quality RNA-seq reads were de novo assembled into transcripts using Trinity, as no reference genome sequence
is available for Urochondra setulosa. The transcriptome coverage efficiency was assessed, in absence of reference
genome, by relating the unique genes with the closest available transcriptome in de novo s equencing20,21. The
trinity assembly of high quality reads resulted in 165,794 transcripts, further clustering resulted in 120,231 tran-
scripts (in all treatments) with an average contig length of 1259 bp and N50 of 1819 bp for Urochondra samples
(Table 1). Since the shorter sequences may lack a characterized protein domain or may be too short to show
sequence matches, resulting in false negative results, the contigs which were less than 300 bp in length were
excluded (Fig. 2). As a whole, a total of 96.79 million, 91.76 million, 90.05 million and 90.09 million raw reads
Scientific Reports | (2021) 11:5548 | https://doi.org/10.1038/s41598-021-85220-7 3
Vol.:(0123456789)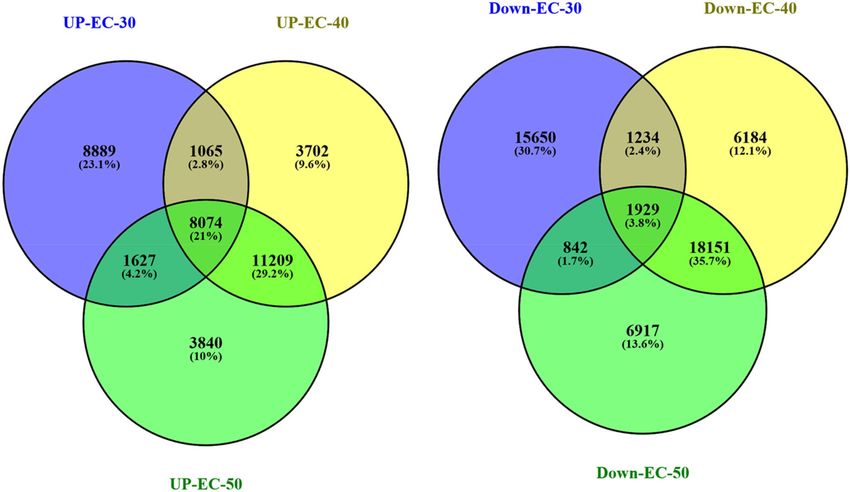
www.nature.com/scientificreports/
Forward primer Reverse primer
Sr no Gene ID (5′–3′) (5′–3′)
1 Urochondra_DN32950_c0_g1_i1 TGGTGGAGACTTCAGACAAACG GCATGTGATCCCAGAGGTAAG
2 Urochondra_DN38352_c1_g1_i4 GGTCTAGTTCGAGTGTACTGTG TTCTTGCATGGTCCACAGG
3 Urochondra_DN29996_c0_g1_i1 CAGCAATAGTCCAGTAAGCGAG TGCTCCATGCTTCCTTTCGG
4 Urochondra_DN40311_c0_g1_i1 CGAAGAGTCCATGCTGTGATTG CTCTCCTTCTTTCCCTCTGGTAC
5 Urochondra_DN28631_c1_g1_i1 GCTGTACCTGAAGCTCTTCTAC GCGACAGGAAATCCACTATG
6 Urochondra_DN40034_c6_g2_i3 TTCATCTTCTGGACGCTCAC GTGAATGAATCTTGCGGATGCC
7 Urochondra_DN42336_c2_g1_i1 ATCGGATTCCTAAGCTGACGGAG GCTGTGACAGGTGGTTGATAC
8 Urochondra_DN37709_c6_g2_i6 GTTACGAGAAATCCTCCTGGTG GCAGAAGTGTCACTTGAAGCC
9 Urochondra_DN35411_c4_g1_i4 GGTGAGTGGTGACAATGAGAG CTCCGCAACGTAGTCATGTAAC
10 Urochondra_DN32108_c0_g1_i1 TGCCAGATAGGGACGATACTG GTCGTCATCTTCCTCCTGAATC
Table 2. List of primers used for qPCR validation.
Figure 2. Transcripts length distribution for Urochondra sequences.
Sample Control EC ~ 30 dS/m EC 40 dS/m EC 50 dS/m
Raw reads 48,399,217 45,882,055 45,026,242 45,046,274
Processed Reads 46,811,900 44,368,130 42,628,010 42,582,319
Alignment to clustered transcripts (%) 94.10 94.01 84.88 84.39
% of high quality data 96.72 96.69 94.67 94.54
Table 3. Statistics of transcriptome sequencing results in Urochondra setulosa.
were obtained from the control and salt treated transcriptome libraries of Urochondra, respectively (Table 3).
More than 94% high-quality reads (clean reads) were obtained for each group and used for downstream analyses.
Similarity search and GO annotation. The clustered high-quality reads were blasted against the vir-
idiplantae database in NCBI. Of the 120,231 clustered transcripts, 78,775 transcripts (65.52%) were annotated
against uniport database and remaining 41,456 (34.48%) transcripts could not be annotated due to lack of infor-
mation for Urochondra in the database. The E-value distribution of the transcripts showed that 58.03% of the
aligned transcripts had similarity with an E-value range of 1e−05 to 1e−60, whereas the remaining homologous
sequences ranged from 1e − 5 to 0. As evident from the Fig. 3, most of the transcripts had a significant level of
sequence similarity to Zea mays (32.31%), Oryza sativa (22.19%), Dichanthelium oligosanthes (16.28%), Hor-
deum vulgare subsp. Vulgare (4.53%), Arundo donax (3.46%), Setaria italica (3.26%), Sorghum bicolor (2.18%),
Cicer arietinum (1.95%) and Aegilops tauschii (1.65%).
Scientific Reports | (2021) 11:5548 | https://doi.org/10.1038/s41598-021-85220-7 4
Vol:.(1234567890)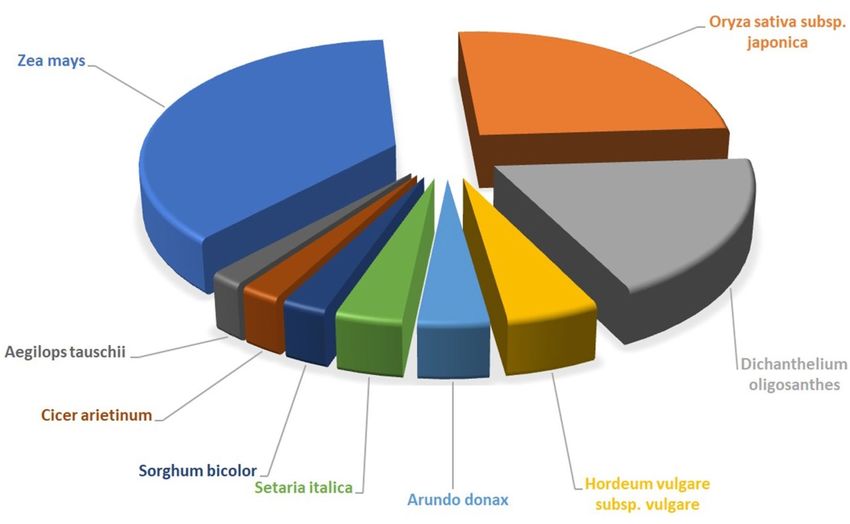
www.nature.com/scientificreports/

                                  Figure 3.  Sequence similarity index of Urochondra transcripts with other species.

                                  Figure 4.  Frequency of top 10 abundant GO terms under biological process, molecular function and cellular
                                  component categories in Urochondra setulosa.

                                     Based on the ontologies, the annotated transcripts were placed under three different categories of Biological
                                  processes (BP), Cellular component (CC) and Molecular function (MF) respectively. Functional enrichment of
                                  GO terms has been shown in Supplementary file S1.The most abundant category belonged to biological processes
                                  with 1931 terms with lowest 521 terms in cellular component and 1505 terms were obtained under molecular
                                  function. A donut chart representing the most abundant 10 terms from each of ontology has been given in Fig. 4.
                                     KAAS server was used for functional annotation of these 18,953 unique transcripts and anthocyanin bio-
                                  synthesis (1 transcript) was seen as the least in terms of the number of homologous transcripts (Fig. 5). The
                                  most abundant transcripts were observed for pathways of protein processing in the endoplasmic reticulum (900

Scientific Reports |   (2021) 11:5548 |               https://doi.org/10.1038/s41598-021-85220-7                                                5

                                                                                                                                           Vol.:(0123456789)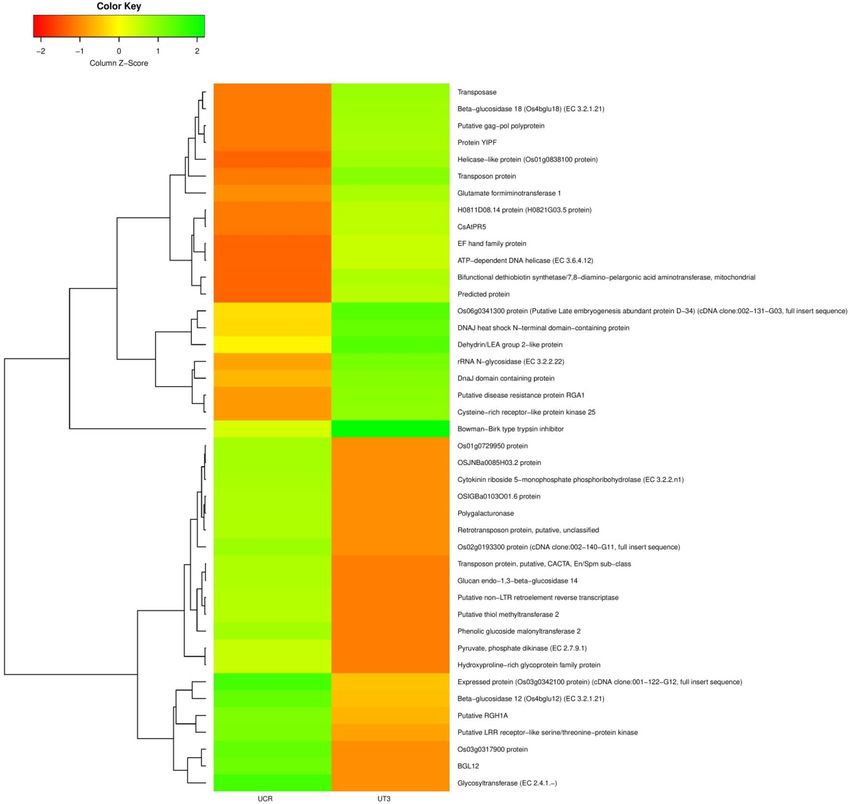
www.nature.com/scientificreports/
Figure 5. Top 10 most highly represented pathways in Urochondra setulosa.
transcripts) and ribosome (981 transcripts). KEGG enrichment for most common terms has been shown in
Supplementary file S2.
Identification of differentially expressed genes. DESeq normalized expression values were used to
calculate fold change for a given transcript. The genes exhibiting a significant difference between treatment and
control samples (at least two-fold changes with P-value ≤ 0.05) were considered to be differentially expressed.
The regulation for each transcript was assigned based on log2fold change. The transcripts with a log2fold change
less than − 1 were down-regulated, those with values greater than 1 were up-regulated and those between − 1 to
1 were termed as neutrally regulated. Total 345,729 transcripts were differentially expressed between control and
treated samples of Urochondra with 120,231 trancsripts at EC 30 dS/m, 113,280 trancsripts at EC 40 dS/m and
112,218 at EC 50 dS/m w.r.t. control. Of the total transcripts expressed, 68,455 transcripts were up-regulated,
69,759 transcripts were down-regulated and 207,515 transcripts were neutrally regulated. The Venn diagram
constructed using Venny 2.1 (https://bioinfogp.cnb.csic.es/tools/venny/index.html) reveals that 1,065 tran-
scripts (2.8%) were commonly up-regulated at EC 30 and 40 dS/m, 11,209 (29.2%) transcripts between EC 40
and 50 dS/m and 1627 transcripts (4.2%) were common at EC 30 and 50 dS/m in Urochondra (Fig. 6). Similarly,
1234 transcripts (2.4%) were down-regulated at salinity levels of EC 30 and 40 dS/m, 18,151 transcripts (35.7%)
at EC 40 and 50 dS/m and only 842 transcripts (1.7%) were commonly down-regulated at EC 30 and 50 dS/m.
Heatmap was generated for top 20 up and down-regulated transcripts between control and treated Urochondra
samples (Fig. 7) using Clustvis (http://biit.cs.ut.ee/clustvis/). In the heatmap, the green coloured bands identify
high gene expression while the red colour represents the low gene expression level.
Validation of DEGs. To confirm the reliability of RNA-Seq in identification of differentially expressed genes
under salt stress, we performed the qPCR analysis of 10 randomly selected unigenes at salinity levels of ECe ~ 30
dS/m, ECe ~ 40 dS/m and ECe ~ 50 dS/m. A similar expression level was observed between qPCR results and
RNA-Seq data but with some variations (Fig. 8). The results confirmed the reliability of RNAseq analysis. The
qPCR expression analysis was performed to identify if pathways of the selected genes were involved in providing
high-salinity tolerance to Urochondra.
DEGs in response to high salinity. The genes expressed differentially in response to high salt concentra-
tions in halophyte U. setulosa were found to be associated with various biological processes i.e. photosynthesis,
MAP kinases, response to oxidative stress, osmotic stress, cellular response to oxidative stress, cellular response
to stress, positive regulation of response to salt stress, stress-activated protein kinase signalling cascade, response
to endoplasmic reticulum stress, trehalose metabolism in response to stress, priming of cellular response to
stress, negative regulation of response to salt stress, response to cation stress and stress granule assembly.
Scientific Reports | (2021) 11:5548 | https://doi.org/10.1038/s41598-021-85220-7 6
Vol:.(1234567890)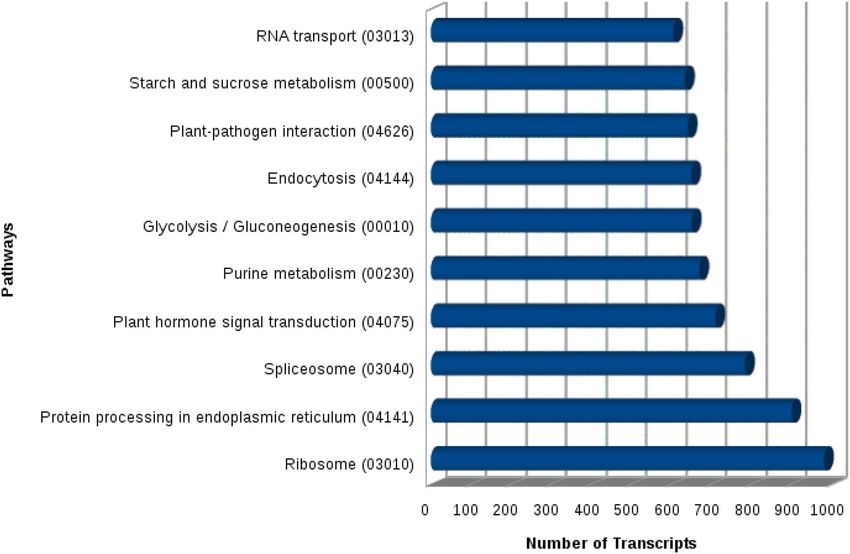
www.nature.com/scientificreports/
Figure 6. Venn diagram of DEGs at different saline levels in Urochondra setulosa. Constructed using Venny 2.1
(https://bioinfogp.cnb.csic.es/tools/venny/index.html).
Photosynthesis. High salinity can severely affect the efficiency of photosynthesis due to decrease in pho-
tosynthetic pigments, decrease in unsaturation index, damaged photosynthetic system and ultimately reduction
in the photosynthesis. Interestingly, in Urochondra, the expression of genes for the photosynthetic enzymes i.e.
Ribulose bisphosphate carboxylase small chain (Urochondra_DN40184_c0_g1_i1), and ferredoxin (Urochon-
dra_DN34936_c0_g1_i4), were found to be up-regulated in response to high salt stress (Supplementary file S3).
High salinity also causes the degradation of photosynthetic pigments such as chlorophyll, and phycobilins. The
expression of genes essential for the biosynthesis of chlorophyll pigment is down-regulated under the influence
of salt stress. Remarkably, we observed that the expression of gene for the enzyme divinyl reductase (Urochon-
dra_DN36240_c1_g1_i2) which converts 8-vinyl groups of different chlorophyll intermediates to ethyl groups
was down-regulated with increasing salt stress. One more enzyme, Omega-6 fatty acid desaturase (Urochon-
dra_DN40411_c2_g1_i3), which is involved in unsaturation of fatty acid of the chloroplastic membrane, was
upregulated under salt stress.
MAPK pathway. MAPK (Mitogen-activated protein kinases) are a particular class of serine/threonine pro-
tein kinases which are activated by various stresses such as salt, drought, cold etc. We observed the up-regulation
of similar proteins i.e. protein phosphatase 2C (Urochondra_DN30190_c0_g2_i2), and Serine/threonine-protein
kinase 10 (Urochondra_DN34126_c1_g1_i6) at high salinity i.e. ECe 30 dS/m, 40 dS/m and 50 dS/m (Sup-
plementary file S4). Similarly, Copper-transporting ATPase RAN1 (Urochondra_DN38546_c0_g1_i1) which
involved in MAP kinase pathway was also found to be up-regulated.
Transcription factors. The total DEGs encoding transcription factors (TFs) increased with higher level of
salinity i.e. 841, 1613 and 1623 at ECe 30 dS/m, 40 dS/m and 50 dS/m, respectively. These TFs mainly belong
to various families such as BTB/POZ, WRKY, MYB, NAC, DREB, AP2-EREBP, bHLH, bZIP, MADS, and SBP.
The DEGs encoding Myb-related protein Myb4 (Urochondra_DN37753_c2_g1_i9) and Myb family protein-like
(DN35501_c2_g1_i2) were found to be up-regulated under ECe 30 dS/m, 40 dS/m and 50 dS/m salinity (Sup-
plementary file S5). The TFs are also considered as important regulators under salt stress. The expression of tran-
scription factor WRKY40 (Urochondra_DN39291_c1_g1_i1) decreased with an increase in salinity level while
the expression of ABA-responsive proteins (Urochondra_DN33328_c2_g1_i1) were found to be up-regulated
with stress as reported in Arabidopsis22. It indicated that WRKY40 may act as a negative regulator for ABA-
responsive genes. In Urochondra too, the expression of WRKY was found up-regulated under salinity.
Oxidative stress. DEGs in response to oxidative stress include peroxidases, catalases, Putative L-ascorbate
peroxidase, Mitogen-activated protein kinase, Trehalose 6-phosphate phosphatase, Lactoylglutathione lyase,
Methionine sulfoxide reductase, and alkaline alpha galactosidase. Oxidative stress is often associated with many
stresses including salt stress. In present experiment, it was found that L-ascorbate peroxidase (Urochondra_
Scientific Reports | (2021) 11:5548 | https://doi.org/10.1038/s41598-021-85220-7 7
Vol.:(0123456789)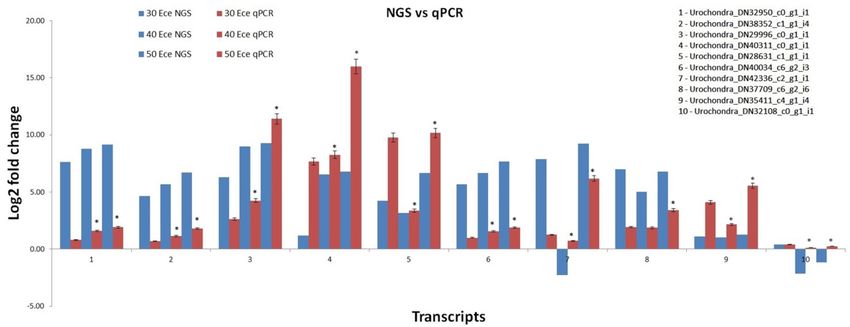
www.nature.com/scientificreports/
Figure 7. Heatmap representing top 20 up and down regulated transcripts generated using Clustvis (https://
biit.cs.ut.ee/clustvis/).
Figure 8. Comparative gene expression between qPCR analysis and RNA-Seq data (mean ± SE); * significantly
different from the control (P < 0.05).
Scientific Reports | (2021) 11:5548 | https://doi.org/10.1038/s41598-021-85220-7 8
Vol:.(1234567890)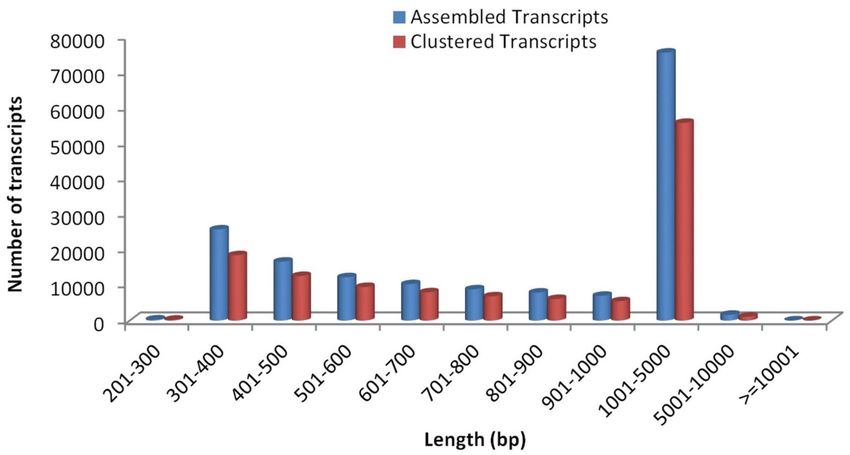
www.nature.com/scientificreports/
Figure 9. Differentially expressed genes of ROS pathway in response to saline stress.
DN34366_c0_g1_i1) and monodehydro ascorbate reductase (Urochondra_DN48599_c0_g1_i1) are up-regu-
lated with increasing salt levels (Fig. 9) along with Catalase (Urochondra_DN29893_c0_g1_i1), and peroxidases
(Urochondra_DN37483_c1_g1_i1).
Compatible solutes. The transcripts Δ-1-pyrroline-5-carboxylate synthase (Urochondra_DN34937_c1_g1_
i6), Betaine aldehyde dehydrogenase (Urochondra_DN24005_c0_g1_i1) and Trehalose 6-phosphate phosphatase
(Urochondra_DN43873_c0_g1_i1) were found to be up regulated indicating accumulation of proline, glycine
betaine and trehalose with increasing salt concentration.
Transporter proteins. The transcriptomic profiling of Urochondra leaves revealed many DEGs encoding
transporter proteins involved in various biological processes e.g., transmembrane transport, intracellular pro-
tein transport, metal ion transport, ATP synthesis coupled proton transport, vacuolar transport, sodium ion
transport, amino acid transmembrane transport, potassium ion transport, and anion transmembrane transport
(Supplementary file S6). Among them, DEGs encoding transmembrane transport were most abundant includ-
ing calcium-binding mitochondrial carrier protein SCaMC-2-B, potassium exchanger-like protein, magnesium/
proton exchanger 1, MRP-like ABC transporter, glutathione transporter, Na+/H+ antiporter (NHX). The expres-
sion of gene encoding N a+/H+ exchanger (Urochondra_DN33781_c0_g1_i1) and a larger number of ABC trans-
porter genes was up-regulated along with the salinity stress in Urochondra.
Cell wall modifying proteins. The cell wall components such as cellulose and hemicellulose are the major
components which are responsible for the characteristic thickness of secondary cell wall. Differential gene
expression analysis showed several cell wall related genes involved in the salt tolerance mechanism i.e. Cellulose
synthase (Urochondra_DN40272_c2_g1_i1), Chitinase (Urochondra_DN40272_c2_g1_i1), Beta-galactosidase
15 (DN40296_c4_g2_i12), Pectin esterase (Urochondra_DN33727_c0_g1_i1), Xyloglucan endotransglucosy-
lase/hydrolase (DN41141_c4_g3_i2), Polygalacturonase (Urochondra_DN29442_c0_g1_i1), cell wall peroxidase
(Urochondra_DN34582_c4_g1_i1) (Supplementary File S7) and laccase (Urochondra_DN36255_c3_g1_i1). The
upregulated cell membrane proteins are Chitinase, Beta-galactosidase, Pectinesterase, cell wall peroxidase and
laccase while polygalacturonase and cellulose are down-regulated at higher levels of salinity.
Discussion
In the present scenario of climate change, environmental stresses, particularly salinity stress limits growth, physi-
ology and productivity of crop plants by the over-accumulation of toxic ions such as Na+ and C l−. The effect of
toxicity can be observed by measuring growth attributes, physiological/biochemical traits and yield characters.
Scientific Reports | (2021) 11:5548 | https://doi.org/10.1038/s41598-021-85220-7 9
Vol.:(0123456789)www.nature.com/scientificreports/
Most of the plants showed survival by excluding ions/salt from their cells or sequester them into the vacuoles
and adopt various strategies to overcome the detrimental effects of stress. The plant responses along with the
tolerance mechanisms of various crops have been in research from years but the information is available for few
halophytes. Further, transcriptomics studies on salt related pathways/genes in halophytes e.g. Sueda, Sporobolus,
Atriplex, Spartina etc. are being explored now for development of climate smart crops.
Urochondra setulosa is a native halophyte of extreme saline lands which is still unexplored for its salt tolerance
mechanism. Few reports are available for its physiological and biochemical attributes at high s alinity23 still the
transcriptomic analysis at saline conditions is lacking. This study is the first report of transcriptomic studies of
Urochondra at high salt levels for functional categorization of differentially expressed genes. Illumina paired-end
transcriptome sequencing generated approximately 368.70 million raw reads with 95.66% of high quality reads
having Phred score > q30. Compared with the other EST sequencing technologies, the RNA-Seq provides assem-
bled and annotated high quality reads as studied in a number of plants such as Suaeda salsa8,9, Spartina spp10,24,
pearl millet25, Halogeton glomeratus26, Iris lacteal27, sugar beet28 and Withania Somnifera29. Normalization of the
library improves a number of annotated genes significantly and reduces the oversampling of ample transcripts30.
DESeq normalized expression values were used to calculate fold change for a given transcript. The genes exhibit-
ing a significant difference between treatment and control samples are considered to be differentially expressed.
While comparing the percentage of firstly reported annotated transcripts (65.52%) in Urochondra with previ-
ous studies in non-model plant species, it was found to be within the range; as reported 79% in Suaeda salsa8,
69.8% in American ginseng root31, 82% in Amaranthus20, 68% in Spartina10 and Cicer32. In Suaeda salsa, only
68.10% unigenes could be annotated where, 61.97%, 51.39%, 43.88%, 47.03%, 48.15%, 44.30% and 14.91% uni-
genes could hit genes in the RefSeq non-redundant proteins (NR), nucleotide (NT), Swissprot, KEGG, Eukaryotic
Orthologous Groups (KOG), Pfam and GO database r espectively9. In Spartina maritime, 6100 genes in leaves
and 11,149 genes in roots were annotated against Poaceae database while in Spartina alterniflora and among
these, 2938 genes were found in both root and leaf t ranscriptomes10. Similarly, in comparison to 35% unique
transcripts obtained here, 8% unique transcripts were reported in m aize33, 7% in Ginseng and A maranthus20,31,
13% in Spartina pectinata34 and 35% in moth b ean35.
More than 30% of DEGs of S. alterniflora has similarity of more than 90% to that of Oryza sativa followed by
Zea mays, Sorghum bicolor, Vitis viniflora and Arabidopsis thaliana24. Similarly, in our studies, more than 32% of
DEGs of Urochondra has similarity of more than 80% with Zea mays followed by Oryza sativa, Dichanthelium
oligosanthes, Hordeum vulgare subsp. Vulgare, Arundo donax, Setaria italica, Sorghum bicolor, Cicer arietinum
and Aegilops tauschii.
The qPCR expression analysis was performed to identify if pathways of the selected genes were involved in
providing high-salinity tolerance to Urochondra. Previous studies reported correlation between the qPCR and
DEG data36,37 and we also observed that all the validated genes had similar expression patterns that were consist-
ent with the DEG data, but the fold change were not exactly the same.
Different processes of biological, cellular or molecular function having important role in various pathways
were identified through functional annotation of differentially expressed genes. The mechanism of salt tolerance
is a complex process having different physiological, cellular, metabolic and molecular responses. The role of genes
in imparting salinity tolerance including osmolytes, protein kinases, transcription factors and ion transporters
have been reported e arlier38,39. Most important pathways identified for tolerance mechanism include SOS (salt
overly sensitive) pathway, proline metabolism, calcium-signaling, plant hormone signalling and MAPK (mitogen-
activated protein kinase) signalling27. Functional annotation of S. alterniflora revealed 26% of the ESTs belonging
to stress-related proteins, followed by nucleic acid metabolism (17%) while a considerably high number (13%) of
ESTs had no known protein function that included hypothetical and predicted p roteins40. In Suaeda salsa, DEGs
mapped to oxidative phosphorylation, ribosome, starch and sucrose metabolism, amino sugar and nucleotide
sugar metabolism, protein processing in endoplasmic reticulatum and plant hormone signal transduction were
significantly annotated8. Differential expression of unigenes in leaves (3,856 DEGs) and roots (7,157 DEGs) of
Beta vulgaris depict different mechanism for salt tolerance at 200 and 400 mM NaCl28. GO and KEGG database
enrichment analysis identified differentially expressed genes for signal transduction, protein phosphorylation
and redox regulation in roots and leaves. Differential expression of 77,250 unigenes (48,682 upregulated and
28,568 downregulated) have been reported in S. salsa at 30% NaCl in leaves and roots, respectively9. Through
KEGG pathway analysis, transcripts for amino acid metabolism, carbohydrate metabolism, fatty acid metabolism
and nitrogenous compound were differentially expressed at 500 mM NaCl in S. alterniflora24. Similarly, in Uro-
chondra, many differentially expressed genes for regulation mechanisms in the nucleus, such as DNA-templated
transcription (regulation) and post transcriptional modifications were identified, suggesting salt stress activates
gene regulatory networks.
High salinity can severely affect the efficiency of photosynthesis due to decrease in photosynthetic pigments;
decrease in unsaturation index, damaged photosynthetic system and ultimately reduction in the photosynthe-
sis. The photosynthetic enzymes such as ferredoxin and ribulose bisphosphate carboxylase are important for
photosynthesis process but are down-regulated under salt s tress41. The up-regulation of photosynthetic enzymes
Ribulose bisphosphate carboxylase and ferredoxin in Urochondra might indicate the normal functioning of
the photosystem under high salt concentrations. It is already established that the unsaturation index of higher
plant decreases with an increase in the salinity level42. A number of genes are involved in the MAPK pathways
which are responsible for the stress tolerance mechanism. One of the previously identified protein namely SOS2
(a ser/thr protein kinase) which interacts with a protein phosphatase 2C was found to be involved in the salt
tolerance43. Copper-transporting ATPase RAN1 is essential for the biogenesis of ethylene receptor which is a
negative regulator of ethylene b iosynthesis44. Hence, up-regulation of Cu-transporting ATPase RAN1 results
into the indirect inhibition of ethylene biosynthesis. In higher plants, the ethylene biosynthesis increases under
Scientific Reports | (2021) 11:5548 | https://doi.org/10.1038/s41598-021-85220-7 10
Vol:.(1234567890)www.nature.com/scientificreports/
stress leading to senescence45. However, here, the salt tolerance ability of this halophyte may be attributed to
inhibition of ethylene biosynthesis.
In present experiment, the total DEGs identified that encode transcription factors (TFs) mainly belong to
various families such as BTB/POZ, WRKY, MYB, NAC, DREB, AP2-EREBP, bHLH, bZIP, MADS, and SBP. Major
plant transcription factor families such as bZIP, NAC, AP2/ERF, and MYB orchestrate regulatory networks under-
lying abiotic stress tolerance46–48. The DEGs that encode MYB transcription family were the largest group highly
expressed under salinity. The Myb TFs are regarded as active players in the drought and salinity stress signalling
in plants49. The DEGs encoding Myb-related protein Myb4 (DN37753_c2_g1_i9) and Myb family protein-like
(DN35501_c2_g1_i2) were found to be up-regulated under 30 dS/m, 40 d/ m and 50 dS/m salinity (Supplemen-
tary file S5). The results obtained are consistent with the previous studies25,27,50. Genes encoding transcription fac-
tor MYB2 expressed differentially under drought stress in plant Populus Canadensis50. The TFs are also considered
as important regulators under salt stress. The up-regulation of ABA-responsive proteins (DN33328_c2_g1_i1) in
Urochondra along with down-regulation of transcription factor WRKY40 (DN39291_c1_g1_i1) with increasing
salinity level indicated that WRKY40 may act as a negative regulator for ABA-responsive genes as have been
reported in Arabidopsis22. In plant transcriptomics, WRKY are one of the major regulatory transcription fac-
tors having various roles in management of plant biotic and abiotic stress responses. It has been reported that
WRKY transcription factors play an role in signalling networking of plants thereby acting as regulators as well
as repressors51. WRKY40 binds directly to the W-box Cis-acting element and hence inhibits the gene expres-
sion of DREBIA, MYB2, AB14, AB15, ABF4, the ABA responsive genes. WRKY40, WRK70, WRK41, WRKY3,
WRK15, WRK35, WRK18 were all down-regulated in response to drought in the drought sensitive chickpea
genotype36. In contrast, WRKY24 and WRK23 were up-regulated in the tolerant genotype. In Urochondra too,
the expression of WRKY was found up-regulated under salinity. WRKY TFs not only have the ability to modu-
late gene expression in response to plant stress but also in the plant defence mechanism as they form a highly
interacting regulatory network22.
Role of ABA in management of plant stress responses includes reprogramming of cellular mechanism at
transcriptional level including lipid and carbohydrate metabolism. Also the ABA dependent and independent
pathways regulate the plant adaptation to adverse environments through AREB/ABF (ABA-responsive element
binding protein/ABRE-binding factor) and DREB/CBF subfamily of the AP2/ERF transcription factors. It has
been reported in Arabidopsis that overexpression of DREB/CBF regulates the signals for plant growth and devel-
opment under different environments. Such transgenics although had enhanced tolerance to drought, salinity
and low temperature but in addition, some developmental defects were also counterbalanced in this p rocess39,52.
The accumulation of proline and chlorophyll under salt stress is linked to zinc finger TF (ZFP3) in Arabidopsis53
due to integral role of transcription factors in linking salt sensory pathways with tolerance responses.
Plants have developed enzymatic (e.g., superoxide dismutase, peroxidase, and catalase) and non-enzymatic
(e.g., ascorbate and glutathione cycles and some secondary metabolites) systems to eliminate ROS accumula-
tion in the cells54. Biotic and abiotic stresses in plants cause overproduction of reactive oxygen species (ROS)
in various cellular compartments causing oxidative s tress55. As reported in halophyte, S. alterniflora, heat shock
proteins of zeaxanthin epoxidase which is a precursor of ABA synthesis and involved in abiotic stress has been
identified10. ROS production activates K+ and Ca2+ permeable channels of the plasma membrane which further
catalyse the C a2+ signalling events and results into program cell d eath56. Plant cells are capable of detoxifica-
tion of ROS through its antioxidant machinery. One of the most prominent systems for removing hydrogen
peroxide is an ascorbate–glutathione cycle which includes different antioxidative enzymes such as ascorbate
peroxidase57. In present experiment, it was found that L-ascorbate peroxidase (DN34366_c0_g1_i1) and mono
dehydro-ascorbate reductase (DN48599_c0_g1_i1) are up-regulated with increasing salt levels (Fig. 9). Catalase
(DN29893_c0_g1_i1), and peroxidases (DN37483_c1_g1_i1) were also found to be up-regulated with an increase
in the salt concentration as has been reported earlier in various s tudies6,28,52.
Another consequence of salt stress is an ionic imbalance which leads to ion-induced injury and disturbance
in water homeostasis. In response to ionic imbalance, most of the halophytes and glycophytes accumulate a
number of low molecular mass compatible solutes i.e. proline, betaine, and sugars to accommodate an excess
of ions in the v acuole58. The significant enrichment of transcription factors for proton transport suggests the
role of ion homeostasis and regulation in salinity adaptation of Spartina alterniflora24. In Urochondra, the up
regulation of transcripts for proline, glycine betaine and trehalose indicates accumulation of these osmolytes
with increasing salt concentration.
The transporter proteins expressed in grass halophyte Urochondra are in accordance with the previous
studies25,28,59. De Vos et al.59 reported genes responding to salt stress in Artemia and identified the transporter
proteins i.e. Lipid transporter proteins, metal transporters proteins, ion transporter proteins and salt-dependent
proteins. Genes involved in transport and kinase activities are highly enriched under salt stress in both root and
leaf trancriptome of S. alterniflora24. NHX proteins are ubiquitous membrane proteins which play important
role in the ion homeostasis by sequestration of additional N a+ in vacuoles or removal of excess N a+ from the
cells60. In our study, the expression of gene encoding Na+/H+ exchanger (Urochondra_DN33781_c0_g1_i1)
was up-regulated along with the salinity stress. Similarly, in a previous study, the Arabidopsis ABC transporter,
AtABCG36, was found to promote salinity stress adaptation by reducing the shoot sodium content61. S. alterni-
flora maintains the salt tolerance ability by regulating uptake and accumulation of N a+, K+ and C
l− through up-
regulation of selective stress-related t ransporters24. Interestingly, in our data, up-regulation of a larger number
of ABC transporter genes was observed in Urochondra at moderate or higher levels of salinity.
It is believed that cell wall associated proteins i.e. expansins, xyloglucan endo-β-transglucosylases/hydro-
lases, endo-1,4-β-D-glucanase, play a key role in cell wall expansion and enlargement. Along with these exten-
sibility proteins, some cell-modifying proteins are also important for the cell wall plasticity which involves
polygalacturonase, pectin acetylesterase, pectin methyl esterase, cellulase etc.62. Cinnamoyl CoA reductase and
Scientific Reports | (2021) 11:5548 | https://doi.org/10.1038/s41598-021-85220-7 11
Vol.:(0123456789)www.nature.com/scientificreports/
cinnamyl alcohol dehydrogenase, genes for cellulose and cellulase synthase and glycosyl transferase were identi-
fied in Spartina transcriptome10. Remarkably, in present experiment, we observed the up-regulation of Chitinase
(Urochondra_DN36592_c2_g1_i1), Beta-galactosidase (Urochondra_DN40296_c4_g2_i12), Pectinesterase (Uro-
chondra_DN33727_c0_g1_i1) and down-regulation of polygalacturonase (Urochondra_DN29442_c0_g1_i1),
cellulase (Urochondra_DN42285_c4_g3_i5) with the higher level of salinity. The cell wall components such as
cellulose and hemicellulose are the major components which are responsible for the characteristic thickness of
secondary cell wall. In the process of secondary cell wall formation, the precursor of lignin get cross-linked into
the cell wall which depends on the presence/absence of cell wall peroxidases and l accases63. In our experiment,
we found the up-regulation of cell wall peroxidase (Urochondra_DN34582_c4_g1_i1) and laccase (Urochon-
dra_DN36255_c3_g1_i1) transcripts with increase in the salinity level.
Briefly, the response of Urochondra setulosa is slightly different from other studied halophytes by maintaining
membrane stability and better plant growth at higher salinity. Differential gene expression analysis depicts that,
RUBISCO activity is upregulated and hence photosynthesis is not inhibited by salinity. Other reports are also
available in U. setulosa with enhanced gas exchange efficiency and plant biomass at s alinity23. In other halophytes,
e.g. in Suaeda salsa, down-regulation of photosynthesis was observed with upregulation of antioxidant genes at
30% salinity9. Ion homeostasis mechanism of U. setulosa is similar to that observed in other highly salt tolerant
halophytes, Thellungiella halophile and Spartina alterniflora through upregulation of H+-ATPases, Na and K
transporters under salinity24,64. U. setulosa, being a perennial halophyte find opportunity for further exploring
salt tolerance pathways in a way that salt cress (Thellungiella halophila) is able to tolerate high salinity levels for
shorter periods only and not able to survive at high salt concentrations for longer durations64.
Conclusions
This is the first report of comprehensive transcriptome profiling of the grass halophyte Urochondra setulosa under
increasing salt concentrations. In the Poaceae family, Urochondra belongs to subfamily Chloridoideae which is
not explored genomically in comparison to other major grass species like rice, wheat, maize or sorghum. There-
fore, in-depth comparative transcriptomic analysis of leaf tissues were performed at ECe 30 dS/m (~ 300 mM
NaCl), 40 dS/m (~ 400 mM NaCl), and 50 dS/m (~ 500 mM NaCl). The de novo transcriptome sequences were
analyzed using the GO and KEGG tools which allowed annotation of a considerable portion of the transcriptome.
Analysis of species without any reference genomic databases, transcriptome is the finest critical tool to explore
the genic compartment among plants. One of the aspects of this work was to build a reference transcriptome
using NGS technology for further annotation and identification of specific genes providing survival at high salt
concentration as well as genes of economic and evolutionary importance. The main emphasis was on how the
regulation of transcription factors and signalling transcripts are influenced by salinity. Moreover, validation of
RNAseq results was performed using real time PCR analysis.
The up-regulation of genes for photosynthetic enzymes, MAPK pathway, transcription factors, transporter
proteins, antioxidative enzymes, cell membrane proteins and enzymes for synthesis of compatible solutes with
increasing levels of salinity suggested the reasons for salt tolerance ability of halophyte Urochondra. This study
will be instrumental in understanding the putative role of genes involved in salt stress response in other grasses.
Future investigation using functional validation tools will aid to identify the individual role of these genes, their
mechanisms, pathways involved and application in the field for developing salt tolerant genotypes. The de novo
transcriptome generated in this study will provide a useful source of reference sequence. The information gen-
erated here will additionally contribute to the biology of halophytes and expand the corresponding knowledge
within the plant kingdom. Additionally, this work identifies potential genes involved in salt tolerance in STGs
which can be used as donors for other halophytes or grasses such as cereal crops.
Data availability
The datasets generated during and/or analyzed during the current study are available from the corresponding
author on reasonable request. Raw sequencing data have been deposited at NCBI under SRA accession number
PRJNA561259. The Transcriptome Shotgun Assembly project has been deposited at DDBJ/EMBL/GenBank
under the accession GJAG00000000. The version described in this paper is the first version, GJAG01000000.
Received: 24 January 2020; Accepted: 22 February 2021
References
1. Zhang, M., Mu, H., Zhang, R., Liu, S. & Lee, I. Genome-wide pathway analysis of microarray data identifies risk pathways related
to salt stress in Arabidopsis Thaliana. Interdiscip. Sci. Comput. Life Sci. 10, 1–6 (2018).
2. Borsani, O., Valpuesta, V. & Botella, M. A. Evidence for a role of salicylic acid in the oxidative damage generated by NaCl and
osmotic stress in Arabidopsis seedlings. Plant Physiol. 126, 1024–1030 (2001).
3. Machado, R. M. A. & Serralheiro, R. P. Soil salinity: effect on vegetable crop growth. Management practices to prevent and mitigate
soil salinization. Horticulturae 3, 30 (2017).
4. Munns, R. & Tester, M. Mechanisms of salinity tolerance. Annu. Rev. Plant Biol. 59, 651–681 (2008).
5. Wang, X. et al. Proteomic analysis of the response to high-salinity stress in Physcomitrella patens. Planta 228, 167–177 (2008).
6. Glenn, E. P., Brown, J. J. & Blumwald, E. Salt tolerance and crop potential of halophytes. Crit. Rev. Plant Sci. 18, 227–255 (1999).
7. Santos, J., Al-Azzawi, M., Aronson, J. & Flowers, T. J. eHALOPH a database of salt-tolerant plants: helping put halophytes to work.
Plant Cell Physiol. 57, e10–e10 (2015).
8. Xu, Y. et al. Transcriptomic profiling of genes in matured dimorphic seeds of euhalophyte Suaeda salsa. BMC Genom. 18, 727
(2017).
9. Guo, S. M., Tan, Y., Chu, H. J., Sun, M.-X. & Xing, J.-C. Transcriptome sequencing revealed molecular mechanisms underlying
tolerance of Suaeda salsa to saline stress. PLoS ONE 14, e0219979 (2019).
Scientific Reports | (2021) 11:5548 | https://doi.org/10.1038/s41598-021-85220-7 12
Vol:.(1234567890)www.nature.com/scientificreports/
10. De Carvalho, J. F. et al. Transcriptome de novo assembly from next-generation sequencing and comparative analyses in the hexa-
ploid salt marsh species Spartina maritima and Spartina alterniflora (Poaceae). Heredity 110, 181 (2013).
11. Jha, B. et al. Identification of salt-induced genes from Salicornia brachiata, an extreme halophyte through expressed sequence tags
analysis. Genes Genet. Syst. 84, 111–120 (2009).
12. Cope, T.A. Poaceae (No. 143). In: Flora of Pakistan, (ed. E. Nasir and S.I. Ali.), 680, Department of Botany, University of Karachi,
Karachi (1982).
13. Brown Jr, G. E. Research databases. Bibliography on salt tolerance. USDA-ARS. US Dep. Agric. Res. Serv. Riverside, CA. http://www.
ars.usda.gov/Services/docs.htm/docid 8908 (2008).
14. Andrews, S. FastQC version 0.11.9. http://www.bioinformatics.babraham.ac.uk/projects/fastqc/ (2019).
15. Martin, M. Cutadapt removes adapter sequences from high-throughput sequencing reads. EMBnet J. 17, 10–12 (2011).
16. Fu, L., Niu, B., Zhu, Z., Wu, S. & Li, W. CD-HIT: accelerated for clustering the next-generation sequencing data. Bioinformatics
28, 3150–3152 (2012).
17. Langmead, B. & Salzberg, S. L. Fast gapped-read alignment with Bowtie2. Nat. Methods Nat. Res. 9, 357–359 (2012).
18. Anders, S. & Huber, W. Differential expression analysis for sequence count data. Genome Biol. 11, R106 (2010).
19. Livak, K. J. & Schmittgen, T. D. Analysis of relative gene expression data using real-time quantitative PCR and the 2-ΔΔCT method.
Methods 25, 402–408 (2001).
20. Délano-Frier, J. P. et al. Transcriptomic analysis of grain amaranth (Amaranthus hypochondriacus) using 454 pyrosequencing:
comparison with A. tuberculatus, expression profiling in stems and in response to biotic and abiotic stress. BMC Genom. 12, 363
(2011).
21. Parchman, T. L., Geist, K. S., Grahnen, J. A., Benkman, C. W. & Buerkle, C. A. Transcriptome sequencing in an ecologically
important tree species: assembly, annotation, and marker discovery. BMC Genom. 11, 180 (2010).
22. Chen, L. et al. The role of WRKY transcription factors in plant abiotic stresses. Biochim. Biophys. Acta (BBA) Gene Regul. Mech.
1819, 120–128 (2012).
23. Kumar, A. et al. Effect of salinity and alkalinity on response of halophytic grasses Sporobolus marginatus and Urochondra setulosa.
Indian J. Agric. Sci. 88, 149–157 (2018).
24. Bedre, R., Mangu, V. R., Srivastava, S., Sanchez, L. E. & Baisakh, N. Transcriptome analysis of smooth cordgrass (Spartina alterni-
flora Loisel), a monocot halophyte, reveals candidate genes involved in its adaptation to salinity. BMC Genom. 17, 657 (2016).
25. Shinde, H. et al. Comparative de novo transcriptomic profiling of the salinity stress responsiveness in contrasting pearl millet lines.
Environ. Exp. Bot. 155, 619–627 (2018).
26. Yao, L. et al. Transcriptome sequencing and comparative analysis of differentially-expressed isoforms in the roots of Halogeton
glomeratus under salt stress. Gene 646, 159–168 (2018).
27. Gu, C. et al. De novo sequencing, assembly, and analysis of Iris lactea var. chinensis roots’ transcriptome in response to salt stress.
Plant Physiol. Biochem. 125, 1–12 (2018).
28. Lv, X., Jin, Y. & Wang, Y. D. novo transcriptome assembly and identification of salt-responsive genes in sugar beet M14. Comput.
Biol. Chem. 75, 1–10 (2018).
29. Tripathi, S., Sangwan, R. S., Mishra, B., Jadaun, J. S. & Sangwan, N. S. Berry transcriptome: insights into a novel resource to
understand development dependent secondary metabolism in Withania Somnifera (Ashwagandha). Physiol. Plant. 168, 148–173
(2019).
30. Zhulidov, P. A. et al. Simple cDNA normalization using kamchatka crab duplex-specific nuclease. Nucl. Acids Res. 32, e37–e37
(2004).
31. Sun, C. et al. novo sequencing and analysis of the American ginseng root transcriptome using a GS FLX Titanium platform to
discover putative genes involved in ginsenoside biosynthesis. BMC Genom. 11, 262 (2010).
32. Garg, R., Patel, R. K., Tyagi, A. K. & Jain, M. D. novo assembly of chickpea transcriptome using short reads for gene discovery and
marker identification. DNA Res. 18, 53–63 (2011).
33. Vega-Arreguín, J. C. et al. Deep sampling of the Palomero maize transcriptome by a high throughput strategy of pyrosequencing.
BMC Genom. 10, 299 (2009).
34. Gedye, K. et al. Investigation of the transcriptome of prairie cord grass, a new cellulosic biomass crop. Plant Genome 3, 69–80
(2010).
35. Tiwari, B. et al. Identification of genes associated with stress tolerance in moth bean [Vigna aconitifolia (Jacq.) Marechal], a stress
hardy crop. Physiol. Mol. Biol. Plants 24, 551–561 (2018).
36. Badhan, S., Kole, P., Ball, A. & Mantri, N. RNA sequencing of leaf tissues from two contrasting chickpea genotypes reveals mecha-
nisms for drought tolerance. Plant Physiol. Biochem. 129, 295–304 (2018).
37. Mansouri, M. et al. Transcriptomic analysis of Aegilops tauschii during long-term salinity stress. Funct. Integr. Genom. 19, 13–28
(2019).
38. Tuteja, N. Mechanisms of high salinity tolerance in plants. In Methods in Enzymology, 428 (eds Wilchek, M. & Bayer, E. A.) 419–438
(Elsevier, 2007).
39. Kasuga, M., Liu, Q., Miura, S., Yamaguchi-Shinozaki, K. & Shinozaki, K. Improving plant drought, salt, and freezing tolerance by
gene transfer of a single stress-inducible transcription factor. Nat. Biotechnol. 17, 287 (1999).
40. Baisakh, N., Subudhi, P. K. & Varadwaj, P. Primary responses to salt stress in a halophyte, smooth cordgrass (Spartina alterniflora
Loisel.). Funct. Integr. Genom. 8, 287–300 (2008).
41. Sudhir, P. & Murthy, S. D. S. Effects of salt stress on basic processes of photosynthesis. Photosynthetica 42, 481–486 (2004).
42. Duarte, B., Matos, A. R., Marques, J. C. & Caçador, I. Leaf fatty acid remodelling in the salt-excreting halophytic grass Spartina
patens along a salinity gradient. Plant Physiol. Biochem. 124, 112–116 (2018).
43. Ohta, M., Guo, Y., Halfter, U. & Zhu, J. K. A novel domain in the protein kinase SOS2 mediates interaction with the protein phos-
phatase 2C ABI2. PNAS 100, 11771–11776 (2003).
44. Wang, K. L. C., Li, H. & Ecker, J. R. Ethylene biosynthesis and signaling networks. Plant Cell 14, S131–S151 (2002).
45. Zhao, X. C. & Schaller, G. E. Effect of salt and osmotic stress upon expression of the ethylene receptor ETR1 in Arabidopsis thaliana.
FEBS Lett. 562, 189–192 (2004).
46. Deinlein, U. et al. Plant salt-tolerance mechanisms. Trends Plant Sci. 19, 371–379 (2014).
47. Parihar, P., Singh, S., Singh, R., Singh, V. P. & Prasad, S. M. Effect of salinity stress on plants and its tolerance strategies: a review.
Environ. Sci. Pollut. Res. 22, 4056–4075 (2015).
48. Yoshida, T., Mogami, J. & Yamaguchi-Shinozaki, K. ABA-dependent and ABA-independent signaling in response to osmotic stress
in plants. Curr. Opin. Plant Biol. 21, 133–139 (2014).
49. Li, C., Ng, C. K. Y. & Fan, L. M. MYB transcription factors, active players in abiotic stress signaling. Environ. Exp. Bot. 114, 80–91
(2015).
50. Caruso, A. et al. Physiological characterization and identification of genes differentially expressed in response to drought induced
by PEG 6000 in Populus canadensis leaves. J. Plant Physiol. 165, 932–941 (2008).
51. Banerjee, A. & Roychoudhury, A. WRKY proteins: signaling and regulation of expression during abiotic stress responses. Sci.
World J. 2015, 807560 (2015).
52. Golldack, D., Li, C., Mohan, H. & Probst, N. Tolerance to drought and salt stress in plants: unraveling the signaling networks.
Front. Plant Sci. 5, 151 (2014).
Scientific Reports | (2021) 11:5548 | https://doi.org/10.1038/s41598-021-85220-7 13
Vol.:(0123456789)You can also read