Data Analytic Approaches for Mining Process Improvement-Machinery Utilization Use Case - MDPI
←
→
Page content transcription
If your browser does not render page correctly, please read the page content below

resources
Article
Data Analytic Approaches for Mining Process
Improvement—Machinery Utilization Use Case
Edyta Brzychczy 1, * , Paulina Gackowiec 1            and Mirko Liebetrau 2
 1    Faculty of Mining and Geoengineering, AGH University of Science and Technology, 30-059 Cracow, Poland;
      gackowiec@agh.edu.pl
 2    Talpasolutions GmbH, 45327 Essen, Germany; mirko@talpasolutions.com
 *    Correspondence: brzych3@agh.edu.pl

 Received: 5 December 2019; Accepted: 31 January 2020; Published: 7 February 2020

 Abstract: This paper investigates the application of process mining methodology on the processes of a
 mobile asset in mining operations as a means of identifying opportunities to improve the operational
 efficiency of such. Industry 4.0 concepts with related extensive digitalization of industrial processes
 enable the acquisition of a huge amount of data that can and should be used for improving processes
 and decision-making. Utilizing this data requires appropriate data processing and data analysis
 schemes. In the processing and analysis stage, most often, a broad spectrum of data mining algorithms
 is applied. These are data-oriented methods and they are incapable of mapping the cause-effect
 relationships between process activities. However, in this scope, the importance of process-oriented
 analytical methods is increasingly emphasized, namely process mining (PM). PM techniques are
 a relatively new approach, which enable the construction of process models and their analytics
 based on data from enterprise IT systems (data are provided in the form of so-called event logs).
 The specific working environment and a multitude of sensors relevant for the working process causes
 the complexity of mining processes, especially in underground operations. Hence, an individual
 approach for event log preparation and gathering contextual information to be utilized in process
 analysis and improvement is mandatory. This paper describes the first application of the concept of
 PM to investigate the normal working process of a roof bolter, operating in an underground mine.
 By applying PM, the irregularities of the operational scheme of this mobile asset have been identified.
 Some irregularities were categorized as inefficiencies that are caused by either failure of machinery or
 suboptimal utilization of the same. In both cases, the results achieved by applying PM to the activity
 log of the mobile asset are relevant for identifying the potential for improving the efficiency of the
 overall working process.

 Keywords: mining process; data mining; process mining; process improvement; BPM

1. Introduction
     Introducing digitalization to the mining industry provides opportunities to improve productivity [1].
The acquisition of large amounts of machine data allows obtaining a more complete picture and in-depth
knowledge of the efficiency in which processes are carried out. Hence, decision-making can be
supported, and indications for processes efficiency improvement identified [2].
     Mining companies aspire to continuously improve processes to increase the operational efficiency
and safety of their personnel. Mining processes are characterized by very demanding and complex
activities due to the challenging physical aspects (heat, cold, vibrations, noise) and the unpredictable
conditions of work. In such environments, human errors, and defective equipment, as well as natural
hazards, are serious risk factors. Risks in mining operations also arise from the use of heavy equipment
and the occurrence of different types of energy (electrical, mechanical, other), which holistically

Resources 2020, 9, 17; doi:10.3390/resources9020017                           www.mdpi.com/journal/resources
Resources 2020, 9, 17                                                                                   2 of 17

contribute to a volatile environment [3]. Therefore, it is essential to accurately monitor the operational
processes and mine-site equipment, comprehensively, and continuously, as well as to leverage insights
that are generated by the monitoring solutions to support the decision-making process. The essence of
environment and machinery monitoring in an underground mine is exemplified in [4,5].
     Process data may derive from a variety of sources, for example, Enterprise Resource Planning
(ERP) systems, machinery and device monitoring systems, the working environment, or employee
location. The origins of different sources of data cause different degrees of granularity: from the
most general (e.g., geometrical dimensions of the excavation), through more detailed operating states
of machines (work, alarm, shutdown), for simple measurements (e.g., methane, currents in motors,
switching on transformers). It is crucial that all such data are accounted to a specific process and they
should be analyzed in this context, to provide for an in-depth efficiency and safety analysis.
     Scientific publications suggest a variety of approaches for data analyses regarding various
processes or working environment conditions. Most often, these approaches include a broad spectrum
of data mining algorithms, used in the tasks of description [6–10], prediction [11–17], or classification
of phenomena [18–22]. It is worth noting that these data-oriented methods are incapable of mapping the
causal relationship between activities in the process to a degree where inefficiencies can be identified
easily and on-point [23]. Therefore, in case process improvements are thought, it is mandatory to apply
more process-oriented methods, e.g., Process Mining.
     Process Mining (PM) originates in workflow analysis. Meanwhile, it is one of the most commonly
used analytical approaches in Business Process Management (BPM). The tools that are applied in PM
are various and they include techniques, like process model discovery, conformance checking, process
model repair, role discovery, bottleneck analysis, or predicting the remaining flow time [24].
     So far, individual cases of using this type of analysis in mining operations can be found. He et al. [25]
reports on the application of PM to emergency rescue processes of fatal gas explosion accidents in
China, while, in [26,27], the creation of event logs from a longwall monitoring system is presented.
     Contemporary mining machinery is equipped with a wide variety of sensors. However, only
a fraction of the data generated from these sensors is commonly utilized. The main reasons are the
lack of a reliable and common system of data storage and analysis [28], as well as a lack of analytic
expertise among process executors, and managers.
     This paper presents the very first application of the PM approach for the analysis of mobile mining
asset operation. The remainder of this paper is structured, as follows. In Section 2, to generate common
basic understanding, introduction to selected concepts, such as the business process management, data
mining, and process mining is presented. In this section, challenges related to PM implementation into
the mining domain are also briefly described. The process mining analysis of roof bolter operation,
based on the created event log, is presented in Section 3. The results of our analysis are discussed
and the potentials for process improvement are identified. Finally, Section 4 concludes the paper and
provides several directions for future work, pointing out the value of PM application in the effective
management of mining machinery operations.

2. Materials and Methods

2.1. Business Process Management
     This section will introduce the basics of Business Process Management (BPM) to achieve a general
understanding of how process optimization is carried out. BPM has received considerable attention
in recent years due to its potential for significantly increasing productivity and saving costs [29].
This discipline can be seen as an alignment of Information Technology (IT) infrastructure (e.g., data
gathering systems, like an ERP tool) with current organizational demands of process improvement [30].
BPM is an iterative approach and it promotes the constant improvement of processes and procedures
in organizations.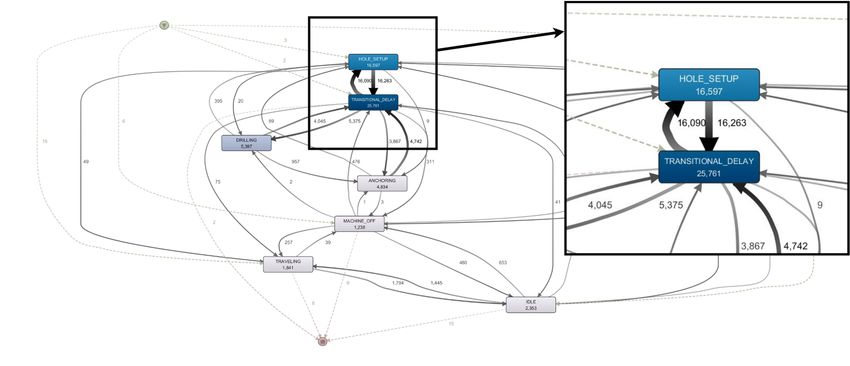
Resources 2020, 9, 17                                                                                  3 of 17

      The overall process architecture of the considered organization should be defined first in order to
identify the critical processes. The evaluation of the processes can then be carried out with respect to
its relevance to the whole process chain, as well as the identified degree of efficiency. This leads to a
process hierarchy to most efficiently perform the process improvement.
      BPM addresses different activities aiming for process improvement, generally presented as a cycle,
referred to as the BPM cycle.
      The BPM cycle consists of the following phases [31]:

•     process model discovery,
•     process analysis,
•     process redesign,
•     process implementation, and
•     process monitoring and controlling.

      Process model discovery helps to define a model that reflects how and in what sequence the
processes are implemented in the organization (“as-is” model). At this stage, techniques for automatic
model detection that are based on data can be used in addition to analyzing documentation, observations,
and interviews. The current state of the process is documented in the form of one or several models.
      Process analysis is carried out in order to identify errors that typically occur and lead to an extended
duration or workload of the considered process. For this step, documentation and quantification
concerning process effectiveness measures are crucial. In terms of the latter, various quantitative and
qualitative analytic techniques are used (e.g., value-added analysis, why-why method, flow analysis,
simulations [31]).
      Process redesign suggests changes in the process that potentially reduce the identified errors
(as investigated in the process analysis stage) and allow for the process sequence to be performed with
improved efficiency. The effect of this stage is the “to-be” process model (redesigned, enhanced model).
      Process implementation is the stage where the suggested changes or “to-be” process model is
applied for the first time. Here, efficiency gains are actually generated for the first time.
      The final stage is monitoring and controlling the process by analyzing data from the implemented
process. It is investigated whether the changes have brought the assumed effects, and an overall higher
process efficiency was achieved.
      One can see that the process improvement requires process modeling and its analysis. PM can be
used in these phases, as well as in the process monitoring and control phase. Our research focuses
on the first two steps (process model discovery and process analysis) to point out inefficiencies and
potential for optimization. Section 2.3 will present a characteristic of the PM approach.

2.2. Data Mining—Data-Oriented Approach in Process Analytics
     Data mining is the exploration and analysis of large data sets to discover meaningful, previously
unknown patterns and rules [32]. It is a component of a broader process, called knowledge discovery
from databases (KDD), which also contains a selection of data, data pre-processing and cleaning, data
transformation, as well as interpretation and evaluation phases [33].
     Based on the kinds of investigated patterns, tasks in data mining can be classified into [34]:
description, estimation, prediction, classification, clustering, and association.
     Nowadays, the usefulness of various types of data mining algorithms for discovering new,
potentially useful patterns and dependencies in data that can be used in the decision-making process
are commonly known. However, their application is rather poor when it comes to process analysis
(understood as a series of interrelated activities).
     Among decision-makers and practitioners, managerial dashboards that descriptively present the
“state” of the process are very popular [35]. On dashboards, most frequently, descriptive statistics,
visualizations, and less frequently correlations are presented for information and decision-making
The primary issue for creating such a report is to have sufficient data available to identify the
activities occurring in the process, as well as defining their start and end time. Obtaining suitable
data that are related to service processes or manufacturing processes from ERP systems is usually not
a problem. However, the identification of activities must be carried out separately and usually
requires expert domain knowledge in the case of processes carried out by mobile equipment in the
Resources 2020, 9, 17 4 of 17
mining industry. The identification of activities in the process most often involves algorithms that are
formulated based on rules formulated by experts for selected variables. These variables or signals
purposes.
include Figure 1 presents
e.g., rotational an example
speed, current dashboard,
in engines, including
hydraulic process
pressures ofperformance statistics for
different components, a roof
boom
bolter machine.
position and movement, and location in the excavation.
Figure 1. An
Figure example
1. An of of
example dashboard
dashboard showing
showing machine
machineperformance and
performance working
and workingprocess
processdefinition
definition
during an an
during average working
average workingshift of of
shift a roof bolter
a roof in in
bolter anan
underground mining
underground operation
mining [36].
operation [36].
AsThe
canprimary
be seen in Figure
issue for 1, the general
creating such machine
a report isstatuses
to havehave been defined
sufficient as idle, machine
data available off,the
to identify
traveling,
activities oroccurring
working (Figure 1 upper part).
in the process, as wellThis
as classification
defining theirgives
startaand
briefend
overview of the utilization
time. Obtaining suitable
anddataperformance of thetomachine.
that are related Such classifications
service processes can usually
or manufacturing be applied
processes from ERP with basic data,
systems as
is usually
available from theHowever,
not a problem. engine control system [37]. of activities must be carried out separately and usually
the identification
The presented
requires expert domainsummary
knowledgeanalytics,
in thealthough they have
case of processes undoubted
carried practical
out by mobile advantages
equipment in the
(simplicity, generalization
mining industry. of information),
The identification are static
of activities and
in the they do
process notoften
most reflect the dynamic
involves nature
algorithms thatofare
theformulated
process as based
opposed to selected
on rules PM techniques.
formulated by expertsHowever,
for selectedprimary classification
variables. and generation
These variables or signals
of include
event logse.g.,are crucial speed,
rotational for creating
currentlabeled data to
in engines, apply PM
hydraulic techniques,
pressures as briefly
of different explainedboom
components, in
Section
position2.4 and
and movement,
presented inandSection 3.1. in the excavation.
location
As can be seen in Figure 1, the general machine statuses have been defined as idle, machine
2.3.off,
Process Mining—Process-Oriented
traveling, or working (Figure Approach1 upper and Software
part). in Process Analytics
This classification gives a brief overview of the
utilization
In recent years PM has become a very fast-growing discipline thatusually
and performance of the machine. Such classifications can focusesbeonapplied with basic
the analysis of
data, as available from the
processes while using event data. engine control system [37].
TheThe presenteddata
underlying summary analytics,
structure used inalthough
PM is an they havelog,
event undoubted
including practical
definedadvantages
data about(simplicity,
process
generalization of information), are static and they do not reflect the dynamic
implementation. The three essential elements of an event log are case id, referring to a particular nature of the process
case,
as opposed to selected PM techniques.
event/activity name, and timestamp of the event [38]. However, primary classification and generation of event logs
areTable
crucial for creating labeled data to apply
1 presents an example of a simple event log. PM techniques, as briefly explained in Section 2.4 and
presented in Section 3.1.
2.3. Process Mining—Process-Oriented Approach and Software in Process Analytics
In recent years PM has become a very fast-growing discipline that focuses on the analysis of
processes while using event data.
The underlying data structure used in PM is an event log, including defined data about process
implementation. The three essential elements of an event log are case id, referring to a particular case,
event/activity name, and timestamp of the event [38].
Resources 2020, 9, 17 5 of 17
Table
Resources 1 8,
2019, presents an example
x FOR PEER REVIEW of a simple event log. 5 of 17
Table 1.
Table An example
1. An example schematic
schematic event
event log.
log.
Case id
Case Id Activity
Activity Timestamp
Timestamp
11 AA 01.04.2017 00:56:15
01.04.2017 00:56:15
11 B B 01.04.2017 01:24:25
01.04.2017 01:24:25
11 C C 01.04.2017
01.04.2017 01:52:14
01:52:14
11 DD 01.04.2017
01.04.2017 01:52:35
01:52:35
11 E E 01.04.2017
01.04.2017 01:59:21
01:59:21
22 AA 01.04.2017 02:13:35
01.04.2017 02:13:35
22 C C 01.04.2017 02:15:17
01.04.2017 02:15:17
22 B B 01.04.2017
01.04.2017 02:22:06
02:22:06
22 DD 01.04.2017
01.04.2017 02:23:08
02:23:08
22 F F 01.04.2017
01.04.2017 02:24:31
02:24:31
33 A A 01.04.2017 02:35:17
01.04.2017 02:35:17
33 B B 01.04.2017
01.04.2017 02:41:44
02:41:44
33 C C 01.04.2017
01.04.2017 02:46:09
02:46:09
33 D D 01.04.2017
01.04.2017 02:49:09
02:49:09
33 E E 01.04.2017
01.04.2017 02:55:37
02:55:37
Event logs can also store additional information,
information, e.g.,
e.g., the
the name
name ofof the
the resource
resource (person
(person oror device)
device)
executing the
the activity
activityor
orother
othercontextual
contextualdata
data(e.g.,
(e.g.,size
sizeofofan anorder,
order,value
valueofofananinvoice)
invoice)[24].
[24].
One of the main tasks of PM is process model discovery, which involves transforming input data
from IT systems supporting process into a model without
without using
using aa priori
priori information
information about
about the
the process.
process.
In addition to discovering process models from event logs, PM includes
addition to discovering process models from event logs, PM includes [39]: [39]:
•• Conformance
Conformance checking—based
checking—based on on comparing
comparing the the existing
existing model
model withwith actual
actual eventevent log records.
log records. This
This task allows for checking whether the process steps performed in the event
task allows for checking whether the process steps performed in the event log are consistent withlog are consistent
with
the the and
model model versa,vice
viceand versa,
while while
taking taking
various various
types typesinto
of models of models
account,into account,
including, forincluding,
example,
for example,
procedural, procedural, organizational,
organizational, declarative,
declarative, or business or business rules.
rules.
•• Enhancement—based
Enhancement—basedononananin-depth in-depthperformance
performanceanalysis
analysisofofthe
the implemented
implemented process
process by using
contextual
contextualinformation
information recorded
recorded ininthe
theevent
eventlog.
log.This
Thistask
taskisisused
usedto to expand
expand and
and improve
improve the
existing
existing process model (e.g., by indicating process bottlenecks, capacity of individual resources,
process model (e.g., by indicating process bottlenecks, capacity of individual resources,
frequency
frequency ofof
activities, loops
activities, loops analysis).
analysis).
ThePM
The PMtasks
tasksare
arepresented
presentedininFigure
Figure2.2.
Process Mining
Figure 2. Process Mining (PM)
(PM) tasks
tasks and corresponding outputs—based on [39].
In general,
In general, process
process models
models can
can be
be classified
classified according
according to
to the
the degree
degree of
of formality.
formality. The
The first
first group
group is
is
informal models
informal models(e.g.,
(e.g.,Data
DataFlow
FlowDiagram,
Diagram,Gantt
Ganttchart).
chart).Their
Their main
main purpose
purpose is to
is to provide
provide insights
insights or
support discussion, but cannot be used for enactment and rigorous analysis. The second group is formal
models (e.g., Petri nets), allowing for deeper analysis and enactment. However, these models may be
more difficult to construct than informal models. In practice, semi-formal models also exist (e.g.,
Resources 2020, 9, 17 6 of 17
or support discussion, but cannot be used for enactment and rigorous analysis. The second group is
formal models (e.g., Petri nets), allowing for deeper analysis and enactment. However, these models
may be more
Resources 2019,difficult to construct
8, x FOR PEER REVIEW than informal models. In practice, semi-formal models also 6 ofexist
17
(e.g., Business Process Model and Notation (BPMN), Unified Modelling Language (UML) activity
BusinessEvent-driven
diagrams, Process ModelProcess
and Notation
Chain(BPMN),
(EPCs)) Unified
[40]. Modelling Language (UML) activity diagrams,
Event-driven Process Chain (EPCs)) [40].
The most basic process modeling notation is a transition system that consists of states and
The that
transitions mostcorrespond
basic process modelingbeing
to activities notation is a transition
executed [41]. The system that best
oldest and consists of states formal
investigated and
transitions that correspond to activities being executed [41]. The oldest and best investigated formal
process models are Petri nets [42]. In the process modeling, a particular class of Petri nets is taken into
process models are Petri nets [42]. In the process modeling, a particular class of Petri nets is taken into
consideration, namely, workflow net (WF-net) [43], which is the most popular construct in the process
consideration, namely, workflow net (WF-net) [43], which is the most popular construct in the process
of model discovery. However, in practice, very often directly follows models are used.
of model discovery. However, in practice, very often directly follows models are used.
Directly-follows models are variants of transitions systems and lie between transition systems and
Directly-follows models are variants of transitions systems and lie between transition systems and
higher-level
higher-levellanguages
languages(e.g.,
(e.g.,Petri
Petri net). Their popularity
net). Their popularitystemsstemsfromfromsimplicity,
simplicity, the
the ability
ability to to express
express
relationships that cannot be interpreted in a precise manner, and scalability
relationships that cannot be interpreted in a precise manner, and scalability [41]. Directly-follows[41]. Directly-follows
models
models cancanbebedefined
definedasasaadirected graph G
directed graph G= (V, E).
= (V, E). Vertices
VerticesVVdenotedenotethe theactivities
activitiesof of a process.
a process.
Directed edges
Directed edges E ⊆ V
⊆ × V express that the target activity can be immediately executed
express that the target activity can be immediately executed after the sourceafter the source
activity in in
activity a process
a process instance
instance[44].
[44].An
Anopen
open graph might be
graph might beextended
extendedby bymarking
markingsomesome vertices
vertices as as start
start
and completion
and completionvertices
vertices (Figure 3).However,
(Figure 3). However,unlikeunlike Petri
Petri nets,
nets, it is itnot
is able
not able to express
to express concurrency
concurrency (see
(see activity
activity B and
B and activity
activity C relation
C relation in Figure
in Figure 3). 3).
Figure3.3.AAdirectly-follows
Figure directly-follows model forthe
model for theevent
eventlog
logpresented
presentedinin Table
Table 1. 1.
Discovering
Discovering directly-follows
directly-followsmodelsmodelsvery
very often produceslarge
often produces largeprocess
processmodels
modelsthat
that can
can bebe reduced
reduced
with
withfiltering
filteringofofedges.
edges.Domain
Domainexperts
expertscan
caneasily
easily interpret the
the simplistic
simplisticmodels
models[41].
[41].Directly-follows
Directly-follows
models
models areare widely
widely used
usedinincommercial
commercialsoftware
software for
for PM, while
whilePetri
Petrinet
netand
andother
othermodeling
modeling formalisms
formalisms
(e.g., BPMN,
(e.g., BPMN, process
processtrees)
trees)arearemostly
mostly used in in academic
academictools.
tools.
In In 2018,
2018, Gartnerreleased
Gartner releasedMarket
Market Guide
Guide for PM PM [45]
[45] with
withaadescription
descriptionofof1515PMPMtools
toolsand their
and their
vendors.
vendors. The The majorityofofPM
majority PMtools
toolsare
areof
ofaa commercial
commercial type.
type. The
Themost
mostrecognized
recognizedtools
toolsinclude
includeProM
ProM
(academic),
(academic), Disco(Fluxicon),
Disco (Fluxicon),Celonis
Celonis PM PM (Celonis),
(Celonis),Minit
Minit(Minit),
(Minit),and ARIS
and PMPM
ARIS (Software
(SoftwareAG)AG)[46].[46].
AllAllPM PM tools
tools supportprocess
support processmodel
modeldiscovery
discovery asas well
well as
as performance
performance analysis.
analysis.Nevertheless,
Nevertheless,
mainly academic tools (ProM [47], APROMORE [48]) support
mainly academic tools (ProM [47], APROMORE [48]) support conformance checking as conformance checking as a result
a result of of
formal models’ usage in a process
formal models’ usage in a process model discovery. model discovery.
Performance analysis of the process includes, among others, time (how fast a process is executed),
Performance analysis of the process includes, among others, time (how fast a process is executed),
cost (how much a process execution costs), and quality (how well the process meets customer
cost (how much a process execution costs), and quality (how well the process meets customer
requirements and expectations). Existing PM tools support the analysis of entire processes or activities
requirements and expectations). Existing PM tools support the analysis of entire processes or activities
therein concerning performance measures, such as cycle time, processing time, and waiting time. They
therein concerning performance measures, such as cycle time, processing time, and waiting time.
can pinpoint bottlenecks, resource underutilization (which are particularly useful in mining
They can pinpoint bottlenecks, resource underutilization (which are particularly useful in mining
operations), and other performance issues that are observed over time [46]. Analysis of other process
operations),
perspectives and other
(cost, performance
quality) due to issues
processthat are observed
model enhancement overdepends
time [46].
onAnalysis
contextual of information
other process
perspectives
recorded in(cost, quality)
an event due to
log. Very process
often, model
in this task,enhancement
additional data depends
mining on contextual
techniques are information
used, i.e.,
recorded in an
classifiers [49]. event log. Very often, in this task, additional data mining techniques are used, i.e.,
classifiers [49].
A comprehensive overview of PM applications has been concluded in [50]. According to the
A comprehensive
authors, overview
the most significant fieldofforPM
PMapplications
implementation hasisbeen concluded
the industrial in [50].which
domain, According to the
stems from
authors, the most
the Industry 4.0 significant
objectives offield for PM
turning implementation
traditional is thesystems
manufacturing industrial
intodomain, which stems
Cyber-Physical Systems from
the(CPS).
Industry 4.0 objectives of turning traditional manufacturing systems
Some use cases of PM in the context of manufacturing can be found in [51–56]. into Cyber-Physical Systems
(CPS). Some use cases of PM in the context of manufacturing can be found in [51–56].
Resources 2019, 8, x FOR PEER REVIEW 7 of 17
Resources 2020, 9, 17 7 of 17
2.4. Implementation
Resources 2019, 8, x FOR of Process
PEER Mining
REVIEW into Mining Domain—Approach and Challenges 7 of 17
The main challenge of PM implementation into the mining domain is the preparation of a
2.4.
2.4.Implementation
ImplementationofofProcess
ProcessMining
Mininginto
intoMining
MiningDomain—Approach
Domain—Approach and and Challenges
Challenges
suitable event log, which reflects the process stages (activities) properly and enables analysis for
The
The main
valuable challenge
insights
main ofofPM
regarding
challenge PM
the implementation
process intointo
improvement.
implementation the the
miningmining
domaindomain
is the is the preparation
preparation of a
of a suitable
suitable event
eventNowadays,
log, log,
which whichcompanies
mining
reflects reflects
the the
process process
arestages stages (activities)
well equipped
(activities) with various
properly properly
IT systems
and and (from
enables enables
analysis analysis
SCADA for
to ERP
for valuable
valuable
class of insights
solutions),regarding
supplying the process
data
insights regarding the process improvement. improvement.
pipeline with a different kind of information and data abstraction
level;Nowadays,
however, the
Nowadays, mining
mining companies
crucial processes
companies areinwell
are equipped
a mining
well equipped with
withvarious
operation (relatedIT
various ITtosystems (from
(fromSCADA
technological
systems to
operations)
SCADA toERP
are
ERP
class
classof
mainly ofsolutions),
solutions),supplying
supported by low-level
supplying data pipeline
pipelinewith
monitoring
data aadifferent
systems.
with kind
kind of
A monitoring
different of information
system canand
information data
record
and abstraction
datahundreds
abstraction of
level;
sensorshowever, the
or PLCthe
level; however, crucial
readings processes
crucial (variables
processes inin a mining
of abinary operation
miningoroperation
real type) (related to technological
with atoshort
(related operations)
time interval
technological are
(seconds,
operations) are
mainly
mainly supported
milliseconds); hence,
supported by low-level
bythe monitoring
direct analysis
low-level systems.
of raw
monitoring data isApointless
systems. monitoring
A fromsystem
monitoring process
systemcan record
analytics
can hundreds
point
record of
of view.
hundreds
sensorsPMor
of sensors PLC
or PLCreadings
implementation
readingsin(variables
the miningof domain
(variables binary
of binaryor real
requires
or realtype)
type)with
witha aphases,
preparation short
shorttime
which
time interval (seconds,
are presented
interval (seconds, in
milliseconds);
Figure 4.
milliseconds); hence, the direct analysis of raw data is pointless from process analytics
hence, the direct analysis of raw data is pointless from process analytics point of view. point of view.
PM
PMimplementation
implementationininthe themining
miningdomain
domain requires
requires preparation
preparation phases,
phases,which
whichareare
presented
presented in
Figure 4.
in Figure 4.
Figure 4. A general approach of PM implementation into mining domain.
The main preparation
Figure phasesapproach
Figure4.4.AAgeneral
general includeofof
approach data
PM pre-processing,
PMimplementation
implementationinto activity
into miningdefinition,
mining domain. and event log
domain.
creation.
The main
The
Miningmainenvironments,
preparation
preparationphases such include
phases asinclude data
moisture, pre-processing,
data pre-processing,
dust, temperature,activity definition,
activity andothers,
definition,
vibrations, and event
andlog creation.
event
very log
often
Mining
creation. environments, such as moisture, dust, temperature, vibrations,
influence sensor readings. Data pre-processing is needed to exclude outliers or abnormal behavior and others, very oftento
influence
Mining sensor readings.
environments, Data
such pre-processing
as moisture, is needed
dust, to exclude
temperature, outliers
vibrations,
utilize the data for identifying process steps or machine conditions (in addition to standard data or abnormal
and others, behavior
very oftento
utilize
influencethe data for identifying
sensor readings.
quality checking). A commonly process steps
Data pre-processing or
used quantitative machine
is needed conditions
approach to exclude (in addition
outliers
for cleaning to standard
or abnormal
or smoothing data
behavior
data quality
to
is the so-
checking).
utilize
called robust A regression
the data commonly usedThe
for identifying
[57]. quantitative
process
objective approach
steps
of or machine
this for cleaning
technique conditions or smoothing
(in addition
is to identify data
the impact is
toof athe
standard
dataso-called
data
outlier
robust
quality
on regression
the whole data[57].
checking). Aset. The
commonly
In objective
case used
the of this technique
quantitative
relevance of such is to identify
approach
outliers for thetoimpact
cleaning
is found of a datadata
orinsignificant,
be smoothing outlier
the is on so-
the
course the
of
whole
called data
robust
the data set. In case
regression
set can the relevance
[57]. TheThe
be smoothened. of such
objective outliers
of this
result of is found
this technique to be insignificant,
techniqueisisvisualized
to identifyon thethe the
impact course
basis of of
of aandata the data
outlier
exemplary
setthe
on
datacan be
whole
set smoothened.
data set.
displayed InThe
caseresult
in Figure of this technique
5.the relevance is visualized
of such outliers on the
is found basis
to be of an exemplary
insignificant, data set
the course of
displayed in Figure 5.
the data set can be smoothened. The result of this technique is visualized on the basis of an exemplary
data set displayed in Figure 5.
5. Result
Figure 5.
Figure Result of
ofRobust
RobustQuadratic
QuadraticRegression
Regressionforfor
data cleaning/smoothing
data of aof
cleaning/smoothing hydraulics signal
a hydraulics [36].
signal
[36].
Robust Quadratic Regression was applied in the given case. Cleaned data are further used in the
Figure 5. Result of Robust Quadratic Regression for data cleaning/smoothing of a hydraulics signal
activity definition phase.
[36].
Resources 2020, 9, 17                                                                                8 of 17

      The next step, activity definition phase can be seen as a transition from raw data to the events
that represent the execution of activity in a process [58]. In the PM domain, such issue is known as
event abstraction. In the same sense, human activity recognition (HAR) can be seen [59]. Various
approaches for event abstraction can be used in this phase: unsupervised learning (e.g., clustering),
supervised learning (e.g., classification with labeled data), behavioral patterns analysis, and others.
A recent review on this subject is presented in [58].
      In the case of mining processes, widely known approaches (e.g., clustering) are often failing
because of the high variability of the process itself. There can be discovered states or activities (on
various levels of abstraction), which cannot be easily interpreted, even by domain experts. On the other
side, unsupervised techniques can bring interesting insights in the form of automatically discovered
abnormal states in process realization, which can be helpful, e.g., for predictive maintenance purposes.
For general process activity definition, supervised techniques seem to be more suitable due to clear
rules for activity labeling provided by a domain expert.
      A crucial issue that is related to the creation of an event log is its level of abstraction. A too
general level (e.g., the definition of “ working”, “ idle”, “ traveling”, “ not working”) will not provide
valuable findings for process improvement. On the other hand, a low level of event log abstraction
can produce too complex and too detailed process models, thus making analysis difficult. The use
of rule-based activity definition (labeling by experts) should guarantee the proper level of event log
abstraction; however, it is strongly related to analytic needs and the involvement of domain experts.
Dependency on the domain expert to provide the necessary information is one of the main limitations
of the existing approaches in event log preparation. However, combining approaches from different
areas (e.g., complex event processing) is seen as interesting future work of the PM community in
the integration of separately developed ideas and techniques into more generic solutions that enable
event abstraction [58]. Until then, the creation of a well-abstracted event log will rather be based on
an adaptive approach in the mining domain, while taking process complexity and variability into
consideration. The proposal of the adaptive approach for longwall mining, also dealing with other
issues related to event log creation (e.g., lack of case id), was presented in [26].
      In the next section, we present our results for PM application to the data of a roof bolter machine,
starting with the description of our event log creation.

3. Results

3.1. Process Description and Event Log Creation
     The roof bolter’s primary objective is to secure the overlying strata of mining tunnels by installing
rock bolts. The machine’s status can always be defined as either “idle”, “ machine off”, “ traveling”,
or “working“, as can be seen in Figure 6.
     For a more detailed performance analysis, the process steps that are carried out in the machine
status defined as “working“ have been identified by utilizing corresponding characteristic machine
data streams.
     The machine status working is subdivided into the process steps: “anchoring”, “transitional
delay”, “hole setup”, and “drilling”, all of which are only possible when the machine´s drilling mode
(opposite to driving mode) is activated, and the hydraulic support legs are extended.
     The contained activities of working status are defined by the set of rules provided by a domain
expert. Different relevant signals sourced from the machine are taken into account and pre-processed
to achieve a suitable classification of activities. The activities are classified, as follows:

•     Hole setup—before the hole can be drilled and directly after a bolt is installed, the boom needs to
      be positioned under the initial/next planned drill hole. This process is called the hole setup and it
      is defined by a number of hydraulic signals, which are indicating boom movement in different
      directions, as can be seen in Figure 7.
3. Results
3.1. Process Description and Event Log Creation
The roof bolter’s primary objective is to secure the overlying strata of mining tunnels by installing
rock 2020,
Resources bolts.9,The
17 machine’s status can always be defined as either “idle”, “ machine off”, “ traveling”,
9 of 17 or
“working“,
Resources 2019, 8,as canPEER
x FOR be seen in Figure
REVIEW 6. 9 of 17
Figure 6. Statuses and process steps of the roof bolter operation.
For a more detailed performance analysis, the process steps that are carried out in the machine
status defined as “working“ have been identified by utilizing corresponding characteristic machine
data streams.
The2019,
Resources machine
8, x FORstatus
PEERworking
REVIEW is subdivided into the process steps: "anchoring", "transitional delay", 9 of 17
“hole setup”, and “drilling”, all of which are only possible when the machine´s drilling mode (opposite
Figure 6.and
to driving mode) is activated, Statuses and process
the hydraulic steps oflegs
support the roof bolter operation.
are extended.
The contained activities of working status are defined by the set of rules provided by a domain
ForDifferent
expert. a more detailed
relevant performance
signals sourced analysis,
from thethemachine
process are
steps thatinto
taken are account
carried out
andinpre-processed
the machine
status defined as “working“ have been identified by utilizing corresponding
to achieve a suitable classification of activities. The activities are classified, as follows: characteristic machine
data streams.
• HoleThesetup—before
machine statusthe hole can
working be drilled and
is subdivided directly
into after asteps:
the process bolt is installed, the
"anchoring", boom needs
"transitional to be
delay",
positioned under the initial/next planned drill hole. This process is called the hole
“hole setup”, and “drilling”, all of which are only possible when the machine´s drilling mode (opposite setup and it is
defined by a number of hydraulic signals, which are indicating
to driving mode) is activated, and the hydraulic support legs are extended. boom movement in different
directions, as canactivities
The contained be seen6.in
Figure ofFigure
Statuses
working7. status
and processaresteps of theby
defined roof
thebolter
set ofoperation.
rules provided by a domain
expert. Different relevant signals sourced from the machine are taken into account and pre-processed
• to achieve
Drilling—once
a suitable the boom is positioned
classification correctly,
of activities. the drilling
The activities process isasthe
are classified, next production process.
follows:
Thus, the rotating drill rod drills a hole into the roof and it is extracted by the machine after
• completion.
Hole setup—before the holeset
Here, another canofbehydraulic
drilled and directly
signals andafter a bolt is installed,
mechanical sensorstheareboom
takenneeds to be
into account,
such as rpm of the drill itself and the position of the drill boom in respect to the anchor itboom
positioned under the initial/next planned drill hole. This process is called the hole setup and is
defined by a number of hydraulic signals, which are indicating boom movement in different
(Figure 8).
directions, as can be seen in Figure 7.
Figure 7. Explanatory signal sequence defined as "hole setup" activity [36].
• Drilling—once the boom is positioned correctly, the drilling process is the next production process.
Thus, the rotating drill rod drills a hole into the roof and it is extracted by the machine after
completion. Here, another set of hydraulic signals and mechanical sensors are taken into account,
such as rpm of the drill itself and the position of the drill boom in respect to the anchor boom (Figure
8).
Figure 7. Explanatory signal sequence defined as “hole setup” activity [36].
Figure 7. Explanatory signal sequence defined as "hole setup" activity [36].
• Drilling—once the boom is positioned correctly, the drilling process is the next production process.
Thus, the rotating drill rod drills a hole into the roof and it is extracted by the machine after
completion. Here, another set of hydraulic signals and mechanical sensors are taken into account,
such as rpm of the drill itself and the position of the drill boom in respect to the anchor boom (Figure
8).
Figure 8. 8.Specific
Figure Specificsignal
signalsequence
sequence defined
defined asas “drilling” activity.Arrows
"drilling" activity. Arrowsindicate
indicate single
single drill
drill events
events
deriving
derivingfrom
froma acombination
combinationofofsignals
signals [36].
[36].
• • Anchoring—after
Anchoring—after the the drill
drill holehole is completed,
is completed, an anchor
an anchor is automatically
is inserted inserted automatically or at the
or at the operator's
operator’s request into the hole, and torque is applied to secure the rock bolt. Again,
request into the hole, and torque is applied to secure the rock bolt. Again, different hydraulic sensors different
hydraulic
and the boom position are providing a signature like sequence to identify the activity (Figure 9). the
sensors and the boom position are providing a signature like sequence to identify
activity (Figure 9).
• Figure 8. Specific
Transitional delaysignal
is thesequence
state whendefined
the as "drilling" hydraulic
machine’s activity. Arrows indicate
system single drill
is switched on;events
however, no
deriving from a combination of signals [36].
work is being performed (a.k.a. hydraulic standby). It can happen when manual work is required
by the operator to continue production, e.g., changing the drilling rod/head or loading new bolts
• Anchoring—after the drill hole is completed, an anchor is inserted automatically or at the operator's
into the bolt magazine. Therefore, this process step is still considered to be a part of the machine
request into the hole, and torque is applied to secure the rock bolt. Again, different hydraulic sensors
status working.
and the boom position are providing a signature like sequence to identify the activity (Figure 9).
Resources 2020, 9, 17 10 of 17
Resources 2019, 8, x FOR PEER REVIEW 10 of 17
Figure
Figure9. 9.Specific
Specificsignal
signalsequence
sequencedefined
defined as
as “anchoring”. Arrowsindicate
"anchoring". Arrows indicate single
single anchoring
anchoring events.
events.
In In
reference
reference totoFigure
Figure7,7,two
twofull
fulldrilling
drilling and
and bolting cycles can
bolting cycles canbe
bederived
derived[36].
[36].
• Table 2 presents
Transitional delaya fragment of when
is the state the event log resulting
the machine's from the
hydraulic classification
system described
is switched above. no
on; however, Case
identification (id) isperformed
work is being represented as shift
(a.k.a. id. Each
hydraulic shift starts/ends
standby). typically
It can happen when with “traveling”,
manual “idle”, or
work is required
“machine
by theoff” status.to continue production, e.g., changing the drilling rod/head or loading new bolts
operator
into the bolt magazine. Therefore, this process step is still considered to be a part of the machine
status working. Table 2. A fragment of roof bolter operation event log.
Table 2 presents
Shift Id of the event log resulting Timestamp
a fragmentActivity Timestamp
from the classification described above. Case
Activity Start Activity End "idle", or
identification (id) is represented as shift id. Each shift starts/ends typically with "traveling",
. . . status.
"machine off" ... ... ...
1 DRILLING 2019-07-31 22:24:15 2019-07-31 22:24:55
1 TRANSITIONAL_DELAY 2019-07-31
Table 2. A fragment of roof bolter 22:24:56
operation event log. 2019-07-31 22:24:56
1 ANCHORING 2019-07-31 22:24:57 2019-07-31 22:25:04
1 Shift id TRANSITIONAL_DELAY Timestamp 22:25:05 Timestamp
2019-07-31 2019-07-31 22:25:09
Activity
1 HOLE_SETUP Activity Start22:25:10 Activity
2019-07-31 End 22:25:10
2019-07-31
1 … …
TRANSITIONAL_DELAY …
2019-07-31 22:25:11 …
2019-07-31 22:25:11
1 1 DRILLING
HOLE_SETUP 2019-07-31 22:24:15
2019-07-31 2019-07-31
22:25:12 22:24:55 22:25:16
2019-07-31
1 1 TRANSITIONAL_DELAY
TRANSITIONAL_DELAY 2019-07-31 2019-07-31 22:25:17
22:24:56 2019-07-31
2019-07-31 22:24:5622:25:19
1 1 DRILLING
ANCHORING 2019-07-31
2019-07-31 22:25:20
22:24:57 2019-07-31
2019-07-31 22:25:04 22:25:58
1 1 TRANSITIONAL_DELAY
TRANSITIONAL_DELAY 2019-07-31 2019-07-31 22:25:59
22:25:05 2019-07-31
2019-07-31 22:25:0922:25:59
1 1 ANCHORING
HOLE_SETUP 2019-07-31
2019-07-31 22:26:00
22:25:10 2019-07-31
2019-07-31 22:25:10 22:26:08
1 1 TRANSITIONAL_DELAY
TRANSITIONAL_DELAY 2019-07-31 2019-07-31 22:26:09
22:25:11 2019-07-31
2019-07-31 22:25:1122:26:11
1 1 HOLE_SETUP
HOLE_SETUP 2019-07-31
2019-07-31 22:26:12
22:25:12 2019-07-31
2019-07-31 22:25:16 22:26:13
... 1 ...
TRANSITIONAL_DELAY ...
2019-07-31 22:25:17 ...
2019-07-31 22:25:19
1 DRILLING 2019-07-31 22:25:20 2019-07-31 22:25:58
1 TRANSITIONAL_DELAY 2019-07-31 22:25:59 2019-07-31 22:25:59
The analyzed event log contains a history of 34 shifts from a period of one month. The results of
1 ANCHORING 2019-07-31 22:26:00 2019-07-31 22:26:08
our PM analysis are1 presented in the next section.2019-07-31 22:26:09 2019-07-31 22:26:11
TRANSITIONAL_DELAY
1 HOLE_SETUP 2019-07-31 22:26:12 2019-07-31 22:26:13
3.2. Process Modeling
… and Analysis with… Process Mining … …
In event log, 34 cases (each case is defined as different instance of the analyzed process) and
The analyzed event log contains a history of 34 shifts from a period of one month. The results of
58021 events are recorded with the relative frequency, as follows: “transitional delay”—44.4%,
our PM analysis are presented in the next section.
“hole setup”—28.61%, “drilling”—9.3%, “anchoring”—8.33%, “idle”—4.06%, “traveling”—3.17%, and
“machine off”—2.13%.
3.2. Process Modeling and Analysis with Process Mining
Figure 10 shows the general view of the analyzed process (process map developed in Disco
softwareIn [60,61]).
event log, 34 cases (each case is defined as different instance of the analyzed process) and 58021
events are recorded with the relative frequency, as follows: "transitional delay"—44.4%, "hole setup"—
28.61%, "drilling"—9.3%, "anchoring"—8.33%, "idle"—4.06%, "traveling"—3.17%, and "machine off"—
2.13%.
Figure 10 shows the general view of the analyzed process (process map developed in Disco
software [60,61]).Resources 2020, 9, 17 11 of 17
Resources 2019, 8, x FOR PEER REVIEW 11 of 17
Figure 10.General
Figure10. Generalprocess
processmodel
modelofofthe
theroof
roofbolter
bolteroperation
operationwith
withabsolute
absolutefrequencies
frequenciesofofactivities.
activities.
This visualization identifies the most dominant paths in the process. The frequencies of the
This visualization identifies the most dominant paths in the process. The frequencies of the
activities are displayed at the arcs as well as in the activities themselves. The process most frequently
activities are displayed at the arcs as well as in the activities themselves. The process most frequently
started with “traveling”, so the machine has moved to the place where work is carried out. The start
started with "traveling", so the machine has moved to the place where work is carried out. The start
frequency for this activity equates to 15 cases. The most frequent end activity in the process is “idle”
frequency for this activity equates to 15 cases. The most frequent end activity in the process is "idle" (15
(15 cases).
cases).
By analyzing case duration in the process, the following findings can be confirmed: the longest-running
By analyzing case duration in the process, the following findings can be confirmed: the longest-
case was performing for 7 h 29 min. The shortest duration is 5 h 34 min. The median execution time
running case was performing for 7 h 29 min. The shortest duration is 5 h 34 min. The median execution
for cases in the data set is 6.8 h. In the analyzed dataset within the existing variants, three specific
time for cases in the data set is 6.8 h. In the analyzed dataset within the existing variants, three specific
times of day when cases started could be identified: 5:00 am, 1:00 pm, and 9:00 pm, which correspond
times of day when cases started could be identified: 5:00 am, 1:00 pm, and 9:00 pm, which correspond
to the times of the shifts beginning in the flexible shift system.
to the times of the shifts beginning in the flexible shift system.
To make the analysis more accurate, all of the paths of the workflow have been revealed, and the
To make the analysis more accurate, all of the paths of the workflow have been revealed, and the
result is presented in Figure 11.
result is presented in Figure 11.
In total, the most frequent activities in the process are “hole setup” and “transitional delay”.
Attention should be paid to the second of the mentioned activities, which is executed most often in
the analyzed process, whereas, in terms of efficiency, it is unfavorable, because it does not provide
any added value in the process. In the process map, the most frequent paths in the process between
“transitional delay” and “hole setup”, as well as the loop with these activities are to be pointed out.
Based on detailed process visualization, some exceptions to the standard/regular process workflow
sequence could be identified. In Figure 11, three shifts in the dataset are shown that started with the
“hole setup” activity. These examples may be considered as peculiar in the usual process.
Additionally, the analysis was carried out from a performance point of view to gain detailed
knowledge regarding process execution. The performance metrics of the process consider cumulated
duration for performing each activity as well as total delays on each path. Visualization of the process
performance enables an analysis of parameters such as, e.g., minimum, maximum, or mean values of
duration between activities, which are marked as red arrows. In the process map, the most intense
coloring has highlighted the longest durations. As could be noticed based on the total duration ofThis visualization identifies the most dominant paths in the process. The frequencies of the
activities are displayed at the arcs as well as in the activities themselves. The process most frequently
started with "traveling", so the machine has moved to the place where work is carried out. The start
frequency for this activity equates to 15 cases. The most frequent end activity in the process is "idle" (15
cases).
Resources
By2020, 9, 17 case duration in the process, the following findings can be confirmed: the longest-
analyzing 12 of 17
running case was performing for 7 h 29 min. The shortest duration is 5 h 34 min. The median execution
Resources 2019, 8, x FOR PEER REVIEW 12 of 17
time for cases in the data set is 6.8 h. In the analyzed dataset within the existing variants, three specific
activities (Figure 12), the most time-consuming activities in the process are “drilling” and “traveling”,
times ofFigure
day when cases started map
could be identified: 5:00 am, 1:00 pm, and 9:00 pm, which correspond
for which the11. Detailed process
accumulated of the
durations roofall
over bolter operation
cases in thewith absolute frequencies
concerned period areofabout
activities
54 (in
and 46 h,
to the times
Disco of the shifts
software). beginning in the flexible shift system.
respectively. The shortest duration is determined for activity “anchoring”, for which the aggregated
To make the analysis more accurate, all of the paths of the workflow have been revealed, and the
duration equals 15.8
result isInpresented h.
total, theinmost
Figure 11.
frequent activities in the process are "hole setup" and "transitional delay".
Attention should be paid to the second of the mentioned activities, which is executed most often in the
analyzed process, whereas, in terms of efficiency, it is unfavorable, because it does not provide any
added value in the process. In the process map, the most frequent paths in the process between
"transitional delay" and "hole setup", as well as the loop with these activities are to be pointed out.
Based on detailed process visualization, some exceptions to the standard/regular process
workflow sequence could be identified. In Figure 11, three shifts in the dataset are shown that started
with the "hole setup" activity. These examples may be considered as peculiar in the usual process.
Additionally, the analysis was carried out from a performance point of view to gain detailed
knowledge regarding process execution. The performance metrics of the process consider cumulated
duration for performing each activity as well as total delays on each path. Visualization of the process
performance enables an analysis of parameters such as, e.g., minimum, maximum, or mean values of
duration between activities, which are marked as red arrows. In the process map, the most intense
coloring has highlighted the longest durations. As could be noticed based on the total duration of
activities (Figure 12), the most time-consuming activities in the process are "drilling" and "traveling",
for which the accumulated durations over all cases in the concerned period are about 54 and 46 h,
Figure 11. Detailed
respectively. process
The shortest map of is
duration thedetermined
roof bolter operation with
for activity absolute frequencies
"anchoring", for whichofthe
activities (in
aggregated
Disco software).
duration equals 15.8 h.
Figure 12. Process model of the roof bolter operation with total duration metric (in Disco software).
Figure 12. Process model of the roof bolter operation with total duration metric (in Disco software).
Activities “drilling” and “anchoring”, as well as “hole setup”, are the main activities in the roof
bolter operation. Their existence,
Activities "drilling" frequency,asand
and "anchoring", wellduration
as "holeare understandable.
setup", are the main However,
activities inthe
theanalysis
roof
of the performance
bolter process
operation. Their map found
existence, that the
frequency, high-impact
and duration are area in a process are
understandable. paths connected
However, the analysiswith
step
of “transitional
the performancedelay”, which
process maptakes
foundaround
that the29 h in total. area
high-impact This indelay is related
a process to manual
are paths operations
connected with
stepprocess,
in the "transitional delay",
which which
cannot takes around
be classified by 29 h in total.
machine data.ThisHowever,
delay is related to manual
the necessity ofoperations
changing in drill
the process, which cannot be classified by machine data. However, the necessity of changing
bits and re-charging bolts for a steady process is evident. The time that is spent in “transitional delay” drill bits
andnot
does re-charging bolts
contain any for of
type a steady
idlingprocess
duringistheevident.
working Thestate
timeofthat
theismachine.
spent in "transitional
Regarding delay" does
the efficiency
not contain
increase, any type
the reduced of idling
share during the
of transitional working
delay state oftothe
with respect machine.
total working Regarding the efficiency
time towards a potential
increase,should
minimum the reduced shareinto
be taken of transitional delay with respect to total working time towards a potential
consideration.
minimum should be taken into consideration.You can also read