CRYPTOCURRENCY CHARTS - NOVEMBER 8 2021 - London Real
←
→
Page content transcription
If your browser does not render page correctly, please read the page content below

CRYPTOCURRENCY CHARTS - NOVEMBER 8 2021

CRYPTOCURRENCY CHARTS - NOVEMBER 8   2021

Avalanche (AVAX)
                                                    AVAX has made history in the last few days by
                                                    breaking its previous all-time high. AVAX has given a
                                                    return of 12.4% in the last 24Hrs and 44.6% in the
                                                    last 7 days.

                                                    Avalanche technical indicators and price action show
                                                    a strong upside momentum. The last weekly candle
                                                    closed above the previous resistance level of $80 with
                                                    a strong bullish engulfing pattern. At the moment of
                                                    this analysis, AVAXUSD is trading at $92 with a
                                                    current market dominance of 0.68% and $1.8Bn as
                                                    trading volume.

                                                    The ongoing price rally seems to be printing new
                                                    highs, with the next target being the $100
                                                    psychological zone. If the upside momentum of
                                                    AVAXUSD gets exhausted, the price can bounce
                                                    back to the $80 support zone. If the $80 liquidity level
                                                    does not get respected, the price can retrace until the
                                                    $60 area.
CRYPTOCURRENCY CHARTS - NOVEMBER 8   2021

Terra (LUNA)

                                                LUNA has provided investors with a 18.9% return in
                                                the last 7 days. Terra's protocol token broke the $50
                                                resistance level on November 4th and has
                                                consolidated around the area since then. In the daily
                                                chart, it is evident that bulls have tried to push the
                                                price back to the recent $53 ATH level, but they have
                                                failed to bring the price above the historical mark.

                                                In the daily timeframe, it is observable that price
                                                action has formed an ascending wedge since
                                                September 2021. A bullish breakout of this market
                                                pattern can certainly make the price reach new highs,
                                                with the next profit target being the $60 liquidity level.
                                                If price breaks the pattern to the downside,
                                                LUNAUSD could drop to the $40-$35 support line.
CRYPTOCURRENCY CHARTS - NOVEMBER 8     2021

Uniswap (UNI)                                   From the DeFi space, UNI has been one of the least
                                                volatile assets this week, providing insignificant gains
                                                compared with its competitors. UNIUSD has given a
                                                return of 2.2% in the last trading sessions and 3.6% in 7
                                                days. At the time of writing, UNI’s 24hr volume is at $212
                                                Million.

                                                UNIUSD price action is moving sideways, with a clear
                                                consolidation in the daily timeframe. Price has been
                                                ranging between the $28 and $22 zones, with no sign of
                                                a possible breakout yet.

                                                Investors are cautiously waiting for the price to break the
                                                accumulation range before taking any further positions
                                                in this pair.

                                                If the token’s price action closes above the $30
                                                resistance level, UNIUSD would be breaking a
                                                descending wedge formed since May 2021, which can
                                                cause a significant bullish rally back to the $44 liquidity
                                                level. On the contrary, if bulls fail to hold the current
                                                level, bears can push the price below the $20-$15 area.
CRYPTOCURRENCY CHARTS - NOVEMBER 8   2021

Chainlink (LINK)

                                                    LINKUSD has officially broken the descending
                                                    market pattern (highlighted in blue) and now seems
                                                    to be heading towards the next $40 resistance level.
                                                    If bulls succeed to break the current liquidity area,
                                                    Chainlink could potentially surge to the previous
                                                    May's peak at $52. The pair is proving traders with a
                                                    good Risk-to-Reward setup if the previous scenario
                                                    plays out.

                                                    In the daily and weekly timeframe, candlesticks are
                                                    showing a shift to bullish momentum. In the last few
                                                    trading sessions, LINKUSD has printed a total return
                                                    of 5.5% (24hrs) and 13.6% in the last 7 days. At the
                                                    moment, traders are monitoring the $35 resistance.
                                                    If the price finds hostility around the area, the asset
                                                    can retrace back to the $20 support zone.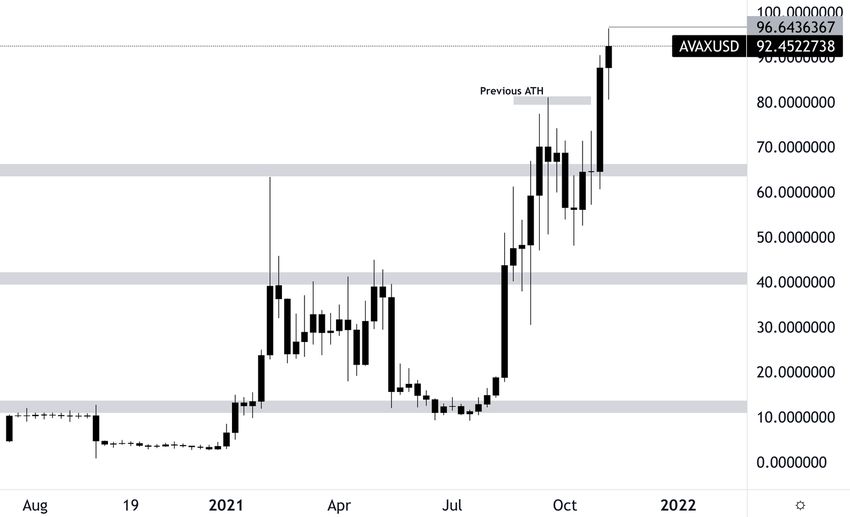
CRYPTOCURRENCY CHARTS - NOVEMBER 8    2021

Fantom (FTM)
                                                FTM is currently trading at $2.9. The pair has added
                                                1.52% in gains in the last 24hrs. Investors have placed
                                                FTMUSD on their radar as price action seems to be
                                                breaking an accumulation zone. Fantom has traded
                                                sideways since the 29th of October and now bulls are
                                                pushing the price outside the range.

                                                If the price continues on its path, FTM could retest its
                                                previous high at $3.6, and possibly print a new record
                                                at $4. A successful daily closure above the $2.9 area,
                                                can give traders enough confidence to go long in this
                                                pair.

                                                A bearish scenario could become probable only if bulls
                                                fail to clear the current resistance area. Rejection from
                                                this level should encourage selling pressure, bringing
                                                the price below $2.6. There is also a prominent
                                                ascending support area (highlighted in the chart) which
                                                can also become a realistic zone for the price to
                                                bounce from.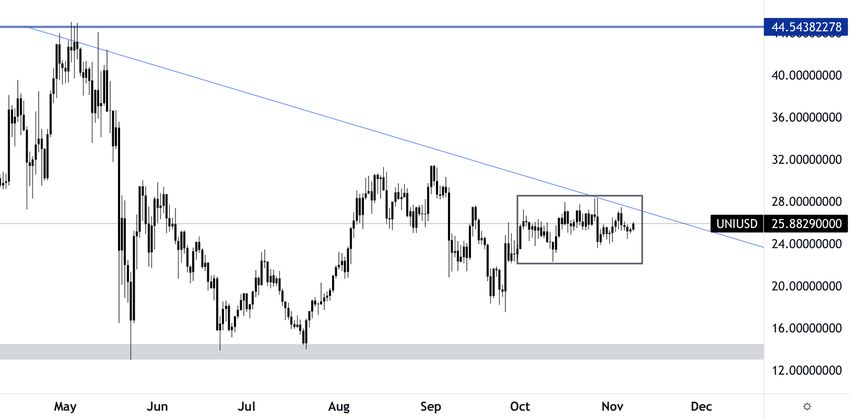
You can also read