Cross-Cultural Awareness and Attitudes Toward Threatened Animal Species
←
→
Page content transcription
If your browser does not render page correctly, please read the page content below
ORIGINAL RESEARCH
                                                                                                                                                  published: 31 May 2022
                                                                                                                                        doi: 10.3389/fpsyg.2022.898503

                                                Cross-Cultural Awareness and
                                                Attitudes Toward Threatened Animal
                                                Species
                                                Jennifer Bruder *, Lauren M. Burakowski *, Taeyong Park , Reem Al-Haddad ,
                                                Sara Al-Hemaidi , Amal Al-Korbi and Almayasa Al-Naimi

                                                Department of Arts and Sciences, Carnegie Mellon University in Qatar, Doha, Qatar

                           Edited by:           The preservation of our planet’s decreasing biodiversity is a global challenge. Human
                Eugenio De Gregorio,
                                                attitudes and preferences toward animals have profound impacts on conservation policies
         Università Link Campus, Italy
                                                and decisions. To date, the vast majority of studies about human attitudes and concern
                      Reviewed by:
                       Pavol Prokop,            toward animals have focused largely on western, educated, industrialized, rich and
      Comenius University, Slovakia             democratic (i.e., WEIRD) populations. In order to mitigate biodiversity loss globally, an
               Jonathan Richmond,
Western Ecological Research Center,
                                                understanding of how humans make decisions about animals from multicultural
   United States Geological Survey              perspectives is needed. The present study examines familiarity, liking and endorsement
             (USGS), United States
                                                of government protection amongst six broad cultural groups living in Qatar for five
                      Andrew Carter,
 Defenders of Wildlife, United States           threatened animal species indigenous to the Arabian Gulf. Our findings highlight similarities
                   *Correspondence:             and differences across cultures toward animals. Overall, familiarity did not predict
                       Jennifer Bruder          endorsement for government protection after liking was accounted for. Liking, however,
            jbruder@andrew.cmu.edu
                Lauren M. Burakowski
                                                emerged as an important predictor of endorsement for government protection across
                 lburakow@gmail.com             cultures, although the degree of animal liking varied culturally. WEIRD and South East
                                                Asian participants showed similar and more positive attitudes toward animals compared
                   Specialty section:
         This article was submitted to          to the other groups. Participants from the Arabian Gulf, Sub-Saharan Africa, Middle East
           Environmental Psychology,            and North Africa, and South Asia responded similarly toward the animals. Interestingly,
               a section of the journal
                                                the Arabian Gulf group demonstrated significantly less liking and protection endorsement
               Frontiers in Psychology
                                                for animals, including those animals which play an important role in their culture. This
           Received: 17 March 2022
            Accepted: 28 April 2022             research highlights intriguing avenues for future research and points to liking as a possible
            Published: 31 May 2022              universal human attitude toward animals that influences decision making about conservation
                             Citation:          across all cultures while suggesting applications for improving education.
    Bruder J, Burakowski LM, Park T,
           Al-Haddad R, Al-Hemaidi S,           Keywords: culture, animal, attitudes, liking, familiarity, conservation, Qatar, Arabian Gulf
     Al-Korbi A and Al-Naimi A (2022)
       Cross-Cultural Awareness and
 Attitudes Toward Threatened Animal
                                                      On aime ce qui nous a émerveillé, et on protège ce que l’on aime. - Jacques Cousteau
                              Species.
           Front. Psychol. 13:898503.                 In the end we will conserve only what we love. We will love only what we understand. We will
     doi: 10.3389/fpsyg.2022.898503                   understand only what we are taught. - Baba Dioum

Frontiers in Psychology | www.frontiersin.org                                         1                                             May 2022 | Volume 13 | Article 898503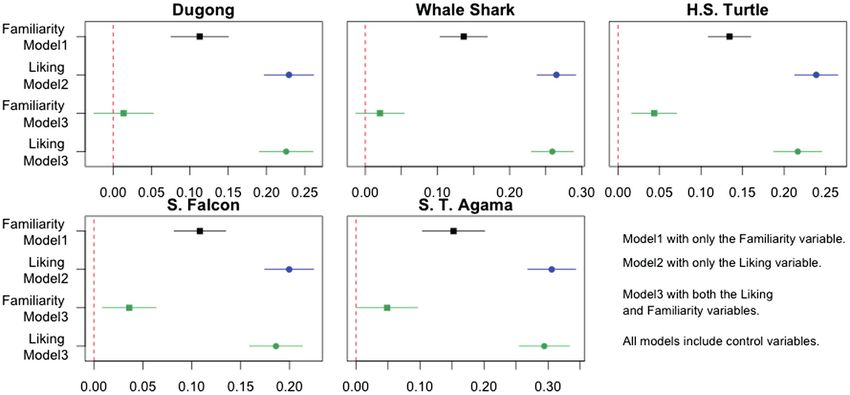
Bruder et al.                                                                                             Culture Influences Attitudes Toward Animals

INTRODUCTION                                                              which factors motivate decision making around individual
                                                                          conservation behaviors.
The rapid loss of biodiversity on our planet is a global challenge.           Using intended donations as a measure for conservation
According to the International Union for Conservation of                  intentions in the general population, Echeverri et al. (2017)
Nature Red List (IUCN), the number of animals worldwide                   asked Canadian undergraduates how much they liked, were
that are added to endangered and critically endangered lists              familiar with and would be willing to donate to conserve four
is rapidly increasing (International Union for Conservation of            endangered North American animals. Participants’ subjective
Nature, 2021). Biodiversity loss is overwhelmingly accelerated            familiarity with an animal correlated positively with liking for
by humans, who are altering the planet at an unprecedented                each animal, suggesting that the more subjects felt they knew
rate (Steg and Vlek, 2009; Secretariat of the Convention on               about a particular animal, the more they liked them. Familiarity
Biological Diversity, 2020; WWF, 2020).                                   was found to be unrelated to one’s intention to donate for
    Reversing biodiversity loss requires a holistic and                   conservation, whereas liking emerged as a significant predictor
representative understanding of human attitudes and behavior              of participants’ WTP for an animal’s conservation. These results
toward animals across all cultural perspectives. Because animal           suggest that although knowledge leads to more positive attitudes
conservation is a global issue, it is necessary to understand             toward animals, it is the positive attitude, not the knowledge,
human behavior collectively. However, investigations of human             that results in pro-conservation intentions toward animals.
attitudes toward animals have been predominantly conducted                Beliefs about endangered status only influenced intended
with WEIRD (western, educated, industrialized, rich, democratic)          donations for the most liked and least liked animals in the
populations (e.g., Amiot and Bastian, 2014), or have explored             study. In a follow-up study (Ibid), the researchers asked American
attitudes toward animals in isolated cultural contexts with               and Indian M-Turk participants about their familiarity, liking
regionally-specific questions (e.g., Heinen and Shrivastava, 2009;        and WTP for the same animals. Once again, subjective familiarity
McLennan and Hill, 2012; Buckley et al., 2017). Research on               was positively related to liking. Liking again predicted intended
the influence of human attitudes toward animals and effects               donations for all animals; however, familiarity also emerged
on policy clearly demonstrate how human preferences for                   as a significant predictor of intended donations for three of
certain types of animals influence decision making and policies           the four animals. Thus, the role of liking and familiarity were
related to conservation efforts (Coursey, 1994; Metrick and               not uniform across these two studies. One reason for this
Weitzman, 1996; Czech et al., 1998; Knegtering et al., 2002;              finding may be related to culture; however, the authors did
Tisdell et al., 2005; Mahoney, 2009; Tisdell, 2014); however,             not analyze the results of their study by culture, so it is not
these studies are limited in their global reach. Thus, scientists,        possible to know if culture played a role in the findings.
policymakers and educators need to understand how all people                  Martín-López et al. (2007) surveyed Spanish and European
decide the worth of animals. This understanding can be leveraged          National Park visitors on animal preference and measured their
to improve people’s perception of animals and in turn to nudge            WTP for 15 species native to the National Park (they also
behavior and decision making in support of biodiversity                   included 5 plant species). Participants differed on their
initiatives. More concretely, this knowledge can aid in the               motivations to visit the park, and these motivations were related
development of conservation programs for global audiences.                to tendencies to think about animals from different perspectives.
One promising avenue of research is to determine if there are             For example, short-term visitors tended to view animals on
psychological universals related to human attitudes toward                utility and familiarity, whereas nature enthusiasts and
animals that might be leveraged to empower global policymakers,           environmental professionals had stronger stances related to
educators and scientists to create overarching global mitigation          ethics and ecological-scientific considerations. All visitors ranked
strategies (i.e., Norenzayan and Heine, 2005). To empower                 animals in a similar order, indicating strong positive attitudes
these stakeholders, cross-cultural research needs to explore              toward megafauna, and ranked birds highest overall, followed
important questions including how humans decide the worth                 by mammals, reptiles, fish, and invertebrates. Overwhelmingly,
of animals, how these decisions relate to perceived need for              the authors found affective factors (i.e., animal liking), more
protection for animals, and how these decisions influence human           strongly influenced WTP than economic factors or scientific
behavior and government policy.                                           considerations, especially amongst visitors with less knowledge
    One method researchers have employed to investigate the               and concern about environmental issues. Knowledge and
relationship between attitudes toward conservation and                    education about biodiversity issues did moderate the results
biodiversity is the willingness-to-pay (WTP) procedure (Martín-           for visitors with expert knowledge about the animals, suggesting
López et al., 2007; Tsi et al., 2008; Wang and Jia, 2012;                 an important role for specific education on these issues.
Echeverri et al., 2017; Dörge et al., 2022). The WTP procedure                In France, Colléony et al. (2017) measured actual donations
when used to study attitudes toward animals assumes that                  as part of an animal adoption program given for endangered
people will pay for the conservation of an animal according               zoo animals, against the type of animal adopted, animal charisma,
to their perceptions of that animal’s worth, typically in the             phylogenetic distance from humans, IUCN threat level and
form of a monetary donation to support conservation. The                  the order the animal appeared alphabetically in the adoption
definition of worth is largely subjective, and may include                list. Animals with higher charisma ratings were more likely
many criteria such as aesthetic, emotional, economic and                  to be adopted, although they received less funding than
scientific factors. This paradigm allows researchers to explore           non-charismatic animals, suggesting that those people who

Frontiers in Psychology | www.frontiersin.org                         2                                        May 2022 | Volume 13 | Article 898503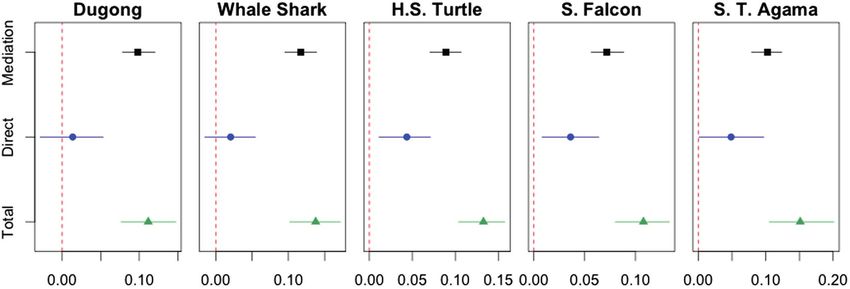
Bruder et al.                                                                                                Culture Influences Attitudes Toward Animals

chose less charismatic animals more thoughtfully participated               consequences for broader conservation attitudes, where
in the adoption program. Interestingly, adoption of a                       interactions with religion, childhood experiences, diet, gender
non-charismatic animal did not correlate with biodiversity                  and age have been found to shape thought (e.g., Busch et al.,
concern. Additionally, animals that appeared at the beginning               2020; Randler et al., 2021); however, even in broader contexts
of the alphabetically ordered adoption list were also more likely           related to human-environment interactions, the literature lacks
to be adopted, suggesting participants employed a cognitive                 cross-cultural investigations (Tam and Milfont, 2020).
shortcut to make their adoption decision. Finally, the IUCN                     The present study aims to address these attitudes in a multi-
threat level of the animal had no influence on animal adoption.             cultural context in Qatar, a small, rich peninsular state in the
Similarly, in a survey of Slovak zoos, Fančovičová et al. (2021)            Arabian Gulf. Qatar’s terrestrial habitat is arid desert and the
found zoo donations to be influenced most strongly by animal                coastline is long, shallow and warm. Compared to WEIRD
attractiveness and phylogenetic closeness to humans, where                  countries, Qatar is arguably Educated, Industrialized and Rich,
threat status only played a small role compared to animal                   but it is neither Western nor Democratic. Its population is
factors. These findings highlight the possibility that people take          extraordinarily multicultural. Approximately 85% of Qatar’s
a simple and biased approach to animal conservation decisions,              population are expatriates. Qatar does not have an immigration
picking animals which are most liked and most readily available.            policy, so foreigners living in Qatar stay only for the duration
It is important to underline potential differences between                  of their work visas (a few months to 20+ years). In part because
paradigms that measure intended versus actual donations to                  there is limited long term immigration in the country, there
animal conservation. For example, in Germany Dörge et al.                   is little mixing between citizens and expatriates, and people
(2022) measured both intended and actual donations to insects.              tend to maintain close ties to their home cultures and traditions.
Though all respondents were favorable toward insect conservation,           Estimated population demographics reveal the rich nature of
a significant intention-behavior gap was found in their response            the multi-cultural environment in Qatar: Indian nationals are
patterns, where their intentions to donate to insect conservation           the most prevalent group (22%), followed by Nepalese and
were larger than their actual donations. These findings suggest             Bangladeshi (13%), other Arab (13%), Filipino (7%), Pakistani
that using the willingness to pay procedure has some limitations            (4%) and Sri Lankan (5%), and interestingly, Qatari nationals
when drawing conclusions about how people will actually                     (11%) are a minority in their own country. The percentage of
behave (also see Kanya et al., 2019).                                       WEIRD foreigners is around 5%. The vast majority of people
    Results from studies employing the WTP procedure comparing              in Qatar (>90%) live in the capital city, Doha (Snoj, 2019).
different types of animals highlight how personal preferences                   We launched a nation-wide survey to query citizens and expatriates
toward animals have a stronger impact on decision making                    (residents) about their awareness and attitudes toward five threatened
than knowledge about the animals or endangered status in the                species indigenous to the Arabian Gulf region. The present study
general population (for further discussion see: Gunnthorsdottir,            is unique in that it measured attitudes toward threatened species
2001; Marešová and Frynta, 2008; however, for different                     across a diverse range of cultures all living in the same geographical
perspectives see Tisdell, 2014). The notion that people are willing         area, and compared these attitudes to the most commonly investigated
to pay more for certain types of animals is in line with research           WEIRD population. Many of the participants are citizens of countries
on flagship species (Clucas et al., 2008; Small, 2012). Flagship            which have not been previously studied with regard to awareness
species are popular, charismatic animals that serve as symbols              and attitudes toward animals and conservation. In order to understand
for acquiring public support to promote conservation awareness              basic awareness of the animals, we first asked participants to
and action. Examples of flagship species include the giant panda            indicate their degree of familiarity with each animal, followed by
(Ailuropoda melanoleuca), the tiger (Panthera tigris) or the African        whether or not they liked the animal. We then asked participants
elephant (Loxodonta africana), all of which have subjective charm           to which degree they endorsed the animal for government protection.
or a defining, appealing characteristic (Ducarme et al., 2013).             We replaced willingness to pay with willingness to endorse
Due to their perceived charisma, flagship species can generate              government action in order to avoid potential cultural confounds
increased conservation donations (e.g., Bowen-Jones and Entwistle,          related to perceptions and attitudes toward charity. Specifically,
2002; Fazey et al., 2005; Sitas et al., 2009), and play a crucial           culture is a source of psychological and behavioral variation, and
role in conservation programs, though this comes with both                  thus, the concept of charity may be culturally variable (e.g.,
advantages and disadvantages (see Ducarme et al., 2013). Overall,           Norenzayan and Heine, 2005). In addition, there is a wide disparity
charismatic species are typically large mammals and vertebrates             between income levels in Qatar, so the meaning of a donation
who possess something people value as attractive and/or positive,           amount will not be consistent across groups.
such as intelligence, beauty, valor, singularity or strong symbolism.           We investigated three main questions. First, do participants
    Taking into consideration the role that human attitudes in              from different cultural groups rank animals with the same
western contexts play in conservation behavior and that these               order preference? This question is interesting to explore in
attitudes are moderated by preferences for animals, it is therefore         light of many findings which suggest that humans have particular
important to understand to what degree, if any, human attitudes             affinity for certain animals (e.g., typically mammals) and less
toward animals vary across cultures (Norenzayan and Heine,                  for others (e.g., typically reptiles) and to determine if these
2005). Arguably, animal charisma is subjective and differences              biases generalize across cultures. If culture impacts relative
in animal liking may be reasonably assumed to exist across                  preferences for animals, we expect to discover significant
cultures. Indeed, culture has been demonstrated to have important           variability in the patterns of liking across cultures.

Frontiers in Psychology | www.frontiersin.org                           3                                         May 2022 | Volume 13 | Article 898503
Bruder et al. Culture Influences Attitudes Toward Animals
Second, do people from diverse cultures have different attitudes population in the world after Australia (Preen, 2004; Marshall
with regard to familiarity, liking and endorsement for government et al., 2018). Dugongs are threatened in Qatar mainly due to
protection toward threatened animals in Qatar? As there is their slow reproduction, destruction of their coastal habitat,
little previous literature to predict whether or not cultural sea sport, commercial fishing, and pollution (Marsh and
differences in familiarity, liking and endorsement for conservation United Nations Environment Programme, 2002; Rabaoui
will emerge, we investigated cultural questions from an exploratory et al., 2021). According to the IUCN, the dugong is vulnerable
stance. However, if culture plays a role, we expect Arabian with decreasing status (Marsh and Sobtzick, 2019).
Gulf participants to have a closer relationship to some of our • The whale shark (Rhincodon typus), the world’s largest fish,
species studied due to the role the species have in their culture. appears between April and September about 90 km off Qatar’s
Third, what is the likely mechanism that leads people to endorse coastline to feed on plankton and tuna eggs (Robinson et al.,
government protection for threatened animals? Existing literature 2013). Observations indicate that the Arabian Gulf is home
(e.g., Colléony et al., 2017; Echeverri et al., 2017) led us to predict to one of the world’s largest gatherings of whale sharks (Bach
that an individual’s willingness to endorse an animal for conservation and Al-Jaidah, 2012; Robinson et al., 2013) as it offers an
will be mediated by animal liking, over and above familiarity. If abundance of food due to the unique marine characteristics
this relationship can be demonstrated cross-culturally, it can help of the region (Bach et al., 2014; Robinson et al., 2017). The
improve policy decisions and guide future research into successful whale shark’s life cycle and migration habits are poorly
interventions supporting animal conservation. understood; therefore, its conservation requires global efforts.
It is currently listed as endangered and decreasing (Pierce and
Norman, 2016).
• The hawksbill sea turtle (Eretmochelys imbricata), a reptile, is
MATERIALS AND METHODS the only sea turtle that nests in Qatar. Nesting occurs along
This paper reports findings from a nation-wide survey in Qatar Qatar’s eastern coastline between April and June (Chatting
that was approved by the Carnegie Mellon University in Qatar et al., 2018). About 200 sea turtles nest each year in three sites
(CMU-Q) local Institutional Review Board (Protocol #1603679- in Qatar, as well as other sites in the Arabian Gulf (Pilcher
3). Data were collected between February 22 and April 9, et al., 2014). The hawksbill sea turtle is listed as critically
2021. Facebook and Instagram advertisements targeted Qatari endangered with a decreasing status (Mortimer and Donnelly,
residents and citizens who were 18 years of age or above. While 2008). In the Arabian Gulf, the hawksbill sea turtle faces
scrolling through their Facebook/Instagram newsfeeds, potential threats due to rapid coastal expansion, widespread loss of
participants were invited to “Volunteer to support research marine habitat and climate change (Marshall et al., 2020).
about awareness of Qatar’s natural heritage” and presented with • The saker falcon (Falco cherrug) is undergoing a rapid
a post containing the study flyer, information sheet, and a decline and is listed as endangered and decreasing by the
link to the online survey. All recruitment materials were provided IUCN (BirdLife International, 2021). The saker falcon is
in both Arabic and English. If participants wished to participate Qatar’s national bird and plays an important role in Qatar’s
in the study, the link directed them to CMU-Q’s Qualtrics cultural heritage. Traditionally, the saker falcon had been
platform. Participants could then choose to take the survey used to hunt and is still used by locals for recreational
in Arabic or in English. The survey consisted of three sections. hunting in all the Arabian Gulf states. The species faces
The first section included the Nature Relatedness Scale-6 threats due to trapping of birds for recreational use, pollution
(Nisbet and Zelenski, 2013) and modified questions about and habitat destruction.
moral stances toward nature (Graham et al., 2009). The questions • The spiny-tailed agama, locally known as Dhub (Uromastyx
about moral stances explored participants’ views around aegyptia), is currently listed as vulnerable and decreasing by
protecting and treating animals fairly, agency in protecting the IUCN (Wilms et al., 2012). It is a burrowing lizard that
animals, and the role of institutions in supporting protection. lives in loose colonies and feeds on low vegetation. This reptile
In the current set of analyses, these items were used as control is found on the Arabian Peninsula and throughout the
variables and will be presented in a separate paper. Arabian Gulf countries such as parts of Egypt, Iraq, Iran and
The second section asked participants to answer three Jordan. It faces threats due to habitat loss from land
questions about a diverse subset of threatened and indigenous reclamation, overgrazing, pollution and quarrying.
species to Qatar and the Arabian Gulf. Participants were not Participants were asked about each animal in succession in
told during the study that the animals were threatened. The a randomized order. A color photograph of the animal was
five animals were chosen from the IUCN Red List for threatened displayed, followed by these three questions:
and endangered species and because they are indigenous to
Qatar, which means that Qatar’s government, citizens and 1. Are you familiar with the ?
residents play a critical role in conservation of these species: 2. How much, if at all, do you like the ?
3. How much, if at all, do you think the government should
• The dugong (Dugong dugon), a close relative of the manatee prioritize protection of the ?
and commonly referred to as a sea cow, is a relatively large
marine mammal which is found in Qatar’s shallow coastal Participants were given the following four-point Likert
waters. The resident dugong population is the second largest scale to respond to question 1: I do not recognize this animal;
Frontiers in Psychology | www.frontiersin.org 4 May 2022 | Volume 13 | Article 898503Bruder et al. Culture Influences Attitudes Toward Animals
A little; Somewhat; A lot. Questions 2 and 3 were not presented TABLE 1 | Descriptive statistics for demographic characteristics.
if participants said they did not recognize the animal. For
Number of
those respondents who indicated some degree of recognition, Characteristics
respondents
Percentage
a four-point Likert scale with the following options was
presented for questions 2 and 3: Not at all; A little; Gender Female 1,140 47.76
Somewhat; A lot. Male 1,229 51.49
In the final section of the survey, participants were asked Prefer not to say 18 0.75
their age, gender, nationality they most strongly identified with; Age 18–22 463 19.36
highest level of education obtained and years living in Qatar. 23–30 805 33.65
A total of 3,418 social media users clicked on the link
31–40 753 31.48
to our survey. Of these, 244 did not meet the inclusion
41–50 275 11.50
criteria and 582 respondents did not complete the survey.
51–60 79 3.30
Overall, a representative sample of 2,612 citizens and residents
of Qatar completed the survey. From these, 218 participants 61–70 13 0.54
chose not to divulge their nationality and are therefore not 71–80 2 0.08
considered in the present analysis. Table 1 presents the 81+ 2 0.08
demographics according to gender, age, education and years Education Elementary school or less 23 0.97
in Qatar of the remaining 2,394 respondents. Officially in High school graduate 494 20.73
Qatar, only 25% of the population is female; however, in College/Vocational/ 275 11.54
our survey 47.8% of respondents were female. The official Associate’s degree
gender imbalance is skewed due to a large influx of foreign Bachelor’s degree 1,070 44.90
male laborers for construction projects. It is likely that the Master’s degree 439 18.42
laborers did not participate in our survey, perhaps due to Professional degree 44 1.85
language barriers or disinterest. Participant ages ranged from (e.g., MD, JD, DD)
18 to over 81 years of age. The majority of the respondents PhD or other Doctoral 38 1.59
were between the ages of 18–40 (84.5%) years of age. Those degree
who participated were educated, with 78.3% of respondents Years in Qatar Less than 5 665 28.09
indicating education beyond high school. Finally, reflecting 5–10 649 27.42
the expatriate nature of many of Qatar’s residents, 28.1% 11–20 614 25.94
of participants resided in Qatar for less than 5 years and a 21–30 290 12.25
further 53.36% indicated living in Qatar between 5 and 31–40 89 3.76
20 years. 41–50 43 1.82
Overall, respondents hailed from 96 unique nationalities 51–60 13 0.55
(see Table 2). The most frequent nationality was Indian (31.7%), 61–70 0 0.00
followed by Qatari (10.9%), Pakistani (7.8%) and Filipino/a
71+ 4 0.17
(5.8%). This distribution is representative of the multi-cultural
population in Qatar. For example, Indian nationals make up Of the total 2,394 respondents used in our analysis, 2,387 answered the question
the largest percentage of any nationality living in Qatar at about gender, 2,392 reported their age, 2,383 responded to the question about
education, and 2,367 answered how long they had lived in Qatar.
21.9%, Pakistani nationals are estimated at 4.7%, Filipino/a
nationalities at 7.4%, and Qataris at 10.5%. Note, Qatari nationals
are a minority in Qatar (Snoj, 2019). fine-grained analysis of the local population. We understand
For data analysis, survey respondents were divided into that there are variations in cultures within these large groupings,
six groups based on the nationality they most strongly however based on other studies and on regional proximity,
identified with (Table 2): (a) Arabian Gulf (n = 273); (b) we feel that these are meaningful cultural groups. A group
Middle East and North Africa (MENA, excluding Arabian of “Mixed” participants was created (n = 78) which included
Gulf; n = 505); (c) South Asia (n = 1,065); (d) South East participants from cultures and countries for which we did
Asia (S. East Asia, n = 176); (e) Sub-Saharan Africa (Africa, not have sufficient data to form regional groups, and for
n = 125); and (f) WEIRD (n = 172). The WEIRD group was which we expected to see no systematic variation in animal
formed by combining nationalities from North America, preferences and attitudes based on the assumption that culture
Western Europe, Australia and New Zealand and has been influences response patterns. Response rate by gender varied
previously described in the literature (Henrich et al., 2010; significantly across groups, with high female response rates
Klein et al., 2018). The remaining groups were created using in the Arabian Gulf, South East Asian, WEIRD and the
the same regional criteria from the United Nations, Economic Mixed groups. Interestingly, more males than females responded
and Global Affairs, Statistics Division for use in the Sustainable in the MENA and Sub-Saharan African groups. The WEIRD
Development Goals (SDG) indicators (United Nations Statistics group tended to be older and more educated than the other
Division, 2022). We divided the Arabian Gulf as a separate groups, and the Arabian Gulf was the youngest group on
group from the MENA group in order to have more average. MENA participants lived in Qatar for a similar
Frontiers in Psychology | www.frontiersin.org 5 May 2022 | Volume 13 | Article 898503Bruder et al. Culture Influences Attitudes Toward Animals
TABLE 2 | Country names (respondent number) by regional group and associated group percentage of female respondents, median age, median education and
median years in Qatar.
% Median Median years
Group name (N) Country (n) Median education
Female age in Qatar
Arabian Gulf (273) Qatar (261), United Arab Emirates (3), Saudi Arabia (4), Bahrain (1), Oman 72 23–30 Bachelor’s Degree 21–30
(3), Kuwait (1)
MENA (505) Algeria (25), Egypt (97), Iran (9), Iraq (5), Jordan (68), Lebanon (29), Libya 44 31–40 Bachelor’s Degree 11–20
(4), Morocco (16), Palestine (36), Sudan (95), Syria (47), Tunisia (42), Turkey
(9), Yemen (23)
Sub- Saharan Africa Burkina Faso (1), Cape Verde (1), Eritrea (6), Ethiopia (1), Ghana (5), Kenya 35 31–40 College/Vocational/ 5–10
(125) (50), Mauritania (1), Mauritius (3), Mozambique (1), Nigeria (18), Somalia (9), Associate’s degree
South Africa (17), Tanzania (1), Uganda (10), Zimbabwe (1)
South Asia (1,065) Afghanistan (2), Bangladesh (60), India (758), Nepal (10), Pakistan (186), 36 23–30 Bachelor’s Degree 5–10
Sri Lanka (49)
South East Asia (176) Indonesia (18), Malaysia (14), Myanmar (1), Philippines (138), Singapore (5) 73 31–40 Bachelor’s Degree 5–10
WEIRD (172) Australia (9), Austria (1), England (59), Canada (17), France (19), Germany 63 31–40 Bachelor’s Degree 5–10
(7), Ireland (8), Italy (7), Netherlands (1), New Zealand (2), Norway (1),
Portugal (5), Scotland (4), Spain (6), Switzerland (1), Wales (2), USA (23)
Mixed (78) Albania (4), Argentina (1), Armenia (1), Azerbaijan (1), Belarus (1), 79 31–40 Bachelor’s Degree Less than 5
Bosnia and Herzegovina (1), Brazil (6), Chile (1), China (3), Colombia (7),
Costa Rica (2), Croatia (2), Estonia (1), Georgia (1), Greece (5), Hungary (1),
Japan (2), Kazakhstan (3), Kyrgyzstan (4), Mexico (7), Peru (1), Poland (2),
Romania (7), Russia (2), Serbia (1), South Korea (1), Suriname (1), Tonga
(1), Tajikistan (1), Trinidad and Tobago (1), Ukraine (5), Venezuela (1)
number of years as their age, suggesting that many members of two parts. First, we run three linear regression models to
of this group may have been born in Qatar. The other groups compare the effects of familiarity and liking on the endorsement
had spent significantly less time in the country, suggesting of government protection. Second, we build on the linear
they were more transient expatriates. regression analysis results to hypothesize a mechanism about
Of the three main questions, first, we ask do participants how familiarity and liking influence the endorsement of
from different cultural groups rank animals with the same government protection. To test our hypothesis, we use the
order preference? To answer this question, we provide potential outcomes approach to causal mediation analysis
descriptive statistics for each cultural group’s preference rank. (Imai et al., 2010a,b) and the mediation R package (Tingley
Besides, we conduct paired t-tests for ranking preferences et al., 2014). This approach clarifies the identification
to understand mean differences between the ranked animals assumptions required to estimate the mediation and the direct
by group. effects. Furthermore, it allows researchers to conduct a sensitivity
Second, do people from diverse cultures have different analysis so that they can assess how much the estimated
attitudes toward threatened animals in Qatar? To address our effect would be influenced by a possible violation of
second question, we implement a series of linear regression the assumptions.
analyses where we consider three dependent variables:
familiarity, liking, and endorsement of government protection,
respectively. Our control variables include gender, age, RESULTS
education, years lived in Qatar, nature-relatedness scores (NR-6;
Nisbet and Zelenski, 2013), and moral stances toward nature Ranking of Animal Preferences by Cultural
(based on Graham et al., 2009) as these variables could be Group
correlated with the dependent variables and cultural Figure 1 depicts the ranked order from most to least preferred
backgrounds. Given the discrete nature of our dependent animal across country groups. To summarize, each of the
variables, we also run a series of ordered logistic regression groups demonstrated clear animal preferences, and the order
analyses to ensure that our substantive conclusions were robust of animal preference follows a similar pattern across groups.
to different model choices. The hawksbill sea turtle (T) is ranked or tied for first place
Third, what is the likely mechanism that leads people to as the preferred animal for each group, with the exception
endorse government protection for threatened animals? To of South Asia, where it ranked second. The whale shark
address our third question, we examine how participants’ (W) and the dugong (D) are consistently grouped together
familiarity with and liking of the threatened animals influence in the rankings of each country group (i.e., they do not
their endorsement of government protection for the animal. differ significantly from each other), except for the South
By answering this question, we aim to deepen our understanding Asian group. The spiny-tailed agama (A) was ranked
of how the three different types of attitudes toward endangered significantly lowest by each cultural group, however note
animals are related. Our analysis for this question consists this difference was less pronounced in the WEIRD group.
Frontiers in Psychology | www.frontiersin.org 6 May 2022 | Volume 13 | Article 898503Bruder et al. Culture Influences Attitudes Toward Animals FIGURE 1 | Ranking of Animal Preferences by Culture. D = Dugong. W=Whale shark. T = H.S. Turtle. F = S. Falcon, A = S.T. Agama. p: p-values from paired t-tests. ns: not significant at 0.05. Only the saker falcon (F) shows meaningful rank differences Although none of the pairs for the African group’s mean across groups. difference tests reveal a significant difference at the 0.05 level, Figure 1 also depicts the paired t-tests’ p-values for the overall, it appears that the African group’s preferences are mean differences between the ranked animals by group. For similar to the Arabian Gulf and MENA groups’ preferences. instance, in the top left panel for the Arabian Gulf group Similarly, the South Asian group’s overall pattern is more or the value of p = 0.088 reflects the mean difference between less similar to the Arabian Gulf and MENA groups’ patterns, the hawksbill sea turtle and the saker falcon. Below, while the South Asian group’s rankings for the five animals we interpret the paired t-test results briefly at the 0.05 are all significantly different. significance level and detailed analysis is provided in Finally, the South East Asian group’s preferences and the Supplementary Figure S1. WEIRD group’s preferences are similar to each other. Both The Arabian Gulf group’s preferences and the MENA group’s groups like the hawksbill sea turtle significantly more than preferences are identical from a statistical point of view. The the other animals. The dugong, whale shark, and saker falcon hawksbill sea turtle and the saker falcon are grouped together are grouped together in second place. While the South East at the top of the ranking. The dugong was ranked significantly Asian group’s relative dislike for the spiny-tailed agama over lower than the hawksbill sea turtle, but does not differ significantly the other animals is statistically significant, the WEIRD group’s from the whale shark. Finally, the spiny-tailed agama is liked tendency to rank the spiny-tailed agama lower than the saker the least. falcon is short of statistical significance. Frontiers in Psychology | www.frontiersin.org 7 May 2022 | Volume 13 | Article 898503
Bruder et al.                                                                                              Culture Influences Attitudes Toward Animals

Do Attitudes Toward Threatened Species                                    for South East Asians who indicated more familiarity with
Differ Across Cultures?                                                   the dugong than the WEIRD group [t(2,373) = 4.94, p < 0.000].
To address our second question, we implemented a series of                For the whale shark, the MENA [t(2,373) = −3.63, p < 0.000]
linear regression analyses and a series of ordered logistic               and Sub-Saharan Africa [t(2,373) = −1.97, p = 0.049] groups were
regression analyses to ensure that our substantive conclusions            significantly less familiar with the it than the WEIRD group,
were robust to different model choices. We found that the                 and the South East Asians were significantly more familiar
substantive conclusions derived from the ordered logistic models          with the whale shark than WEIRD participants [t(2,373) = 3.76,
were identical to the conclusions based on our linear regression          p < 0.000].
models. Thus, we focus here on the results from our linear                   Panel B in Figure 2 depicts the linear regression results
regression models without loss of generality; the ordered logistic        for each animal across cultures for liking. Generally, WEIRD
estimation results can be found in Supplementary Figure S2.               participants showed a trend of increased animal liking compared
   Figure 2 depicts the linear regression results for each                to the other groups (p-values range from 0.000 to 0.044), except
animal across cultures for familiarity (Panel A), liking (Panel           for the dugong for which the South East Asian and the WEIRD
B) and endorsement of government protection (Panel C).                    participants do not differ significantly [t(1,579) = 0.278, p = 0.781]
For each of the models, the WEIRD group was used as a                     and the saker falcon for which the South Asian and the WEIRD
baseline (set to zero and depicted by the red dotted line)                groups do not differ [t(2,257) =1.47, p = 0.143]. Examining the
for comparison and effect sizes with 95% confidence intervals             95% CIs, it is clear that the WEIRD group behaves exceptionally:
(CIs) are shown. If a group’s 95% CI does not cross the                   most of the other groups do not differ significantly from one
red dotted line, it means that the group is significantly                 another with regards to animal liking. It is striking that the
different from the WEIRD group at the 0.05 significance                   Arabian Gulf group does not like the saker falcon
level. We chose the WEIRD group as the baseline without                   [t(2,257) = −2.89,      p = 0.004]     or     spiny-tailed      agama
loss of generality. Our substantive conclusions do not change             [t(1,549) = −6.81, p < 0.000] more than WEIRD participants,
when the baseline group varies. In order to make sense of                 considering the high familiarity (see Panel A) and the cultural
the effect sizes, we can consider the following example.                  significance of these animals.
Panel A plots the country groups’ familiarity ratings for                    Finally, Panel C depicts the linear regression results for
each animal. With respect to the dugong, the effect size                  each animal across cultures for endorsement of government
value for the Arabian Gulf participants (depicted by the                  protection, our proxy for the WTP procedure used in other
black square) is −0.64, which represents the difference                   studies. The Arabian Gulf participants endorsed all of the
between the Arabian Gulf group and the baseline WEIRD                     animals less for protection than WEIRD participants [dugong:
group for familiarity with the dugong. Thus, respondents                  t(1,573) = −1.98, p = 0.048; whale shark: t(2,216) = −3.60, p = 0.000;
from the Arabian Gulf are predicted to be less familiar                   hawksbill sea turtle: t(2,127) = −2.18, p = 0.029; saker falcon:
with the dugong than the WEIRD group by 0.64, where                       t(2,246) = −2.25, p = 0.025; spiny-tailed agama: t(1,540) = −4.44,
the value of 1 means one level in the measurement used.                   p < 0.000]. MENA and South Asian participants behaved similarly,
This measurement was in response to the question “Are                     endorsing all animals, except the saker falcon, less for protection
you familiar with the < animal >?” and used the Likert scale              than WEIRD participants [MENA: dugong: t(1,573) = −3.14,
which ranged from 1 (“I do not recognize this animal”) to                 p = 0.002; whale shark: t(2,216) = −4.83, p < 0.000; hawksbill sea
4 (“a lot”). In contrast, if we examine the familiarity plot              turtle:    t(2,127) = −2.43,     p = 0.01;    spiny-tailed     agama:
for the spiny-tailed agama (Panel A, far right), the Arabian              t(1,540) = −4.32, p < 0.000. South Asia: dugong: t(1,573) = −2.55,
Gulf respondents are predicted to be much more familiar                   p = 0.011; whale shark: t(2,216) = −2.39, p = 0.017; hawksbill sea
with the spiny-tailed agama than the WEIRD group by about                 turtle: t(2,127) = −2.60, p = 0.009; spiny-tailed agama:
1 Likert scale point (approximately 0.92).                                t(1,540) = −3.11, p = 0.002]. South East Asian and Sub-Saharan
   Overall, the linear regression results demonstrate cultural            African participants did not differ from the WEIRD group,
differences for familiarity, liking and endorsement of government         except in the case of the dugong, where South East Asians
protection. Panel A reveals respondents from the Arabian Gulf             were more likely to endorse it for protection [t(1,573) = 2.15,
and MENA regions, and to some degree Sub-Saharan Africa                   p = 0.032].
indicated increased familiarity for the saker falcon [Arabian
Gulf: t(2,375) = 4.54, p < 0.000; MENA: t(2,375) = 3.37, p = 0.001;       Which Mechanism Might Lead to
Africa: t(2,375) = 3.27, p = 0.001] and spiny-tailed agama [Arabian       Endorsement of Government Protection
Gulf: t(2,372) = 8.27, p < 0.000; MENA: t(2,372) = 3.82, p < 0.000;       for Threatened Animals?
Africa: t(2,372) = 1.74, p = 0.082] compared to the WEIRD group.          To address our third question, we examined how participants’
All other groups indicated less familiarity with the dugong               familiarity with and liking of the threatened animals influence
[Arabian Gulf: t(2,373) = −5.76, p < 0.000; MENA: t(2,373) = −9.63,       their endorsement of government protection for the animal.
p < 0.000; Africa: t(2,373) = −6.53, p < 0.000; South Asia:               By answering this question, we aim to deepen our understanding
t(2,373) = −9.70, p < 0.000] and the hawksbill sea turtle [Arabian        of how the three different types of attitudes toward endangered
Gulf: t(2,372) = −3.02, p = 0.003; MENA: t(2,372) = −4.80,                animals are related.
p < 0.000; Africa: t(2,372) = −4.54, p < 0.000; South Asia:                  First, we ran three linear regression models to compare
t(2,372) = −4.98, p < 0.000] than WEIRD participants, except              the effects of familiarity and liking on the endorsement of

Frontiers in Psychology | www.frontiersin.org                         8                                         May 2022 | Volume 13 | Article 898503
Bruder et al.                                                                                                                     Culture Influences Attitudes Toward Animals

    A

    B

    C

  FIGURE 2 | Ordinary least squares coefficients and 95% confidence intervals (CI): Comparing different nationalities. The red dotted line in each plot indicates the
  baseline WEIRD group. If a certain group’s 95% CI does not cross the red dotted line, it means that the group is significantly different from the WEIRD group at the
  0.05 significance level. The “Mixed” group is omitted from the plot for the sake of simplicity though it is included in the analyses. Panel (A): familiarity. Panel (B):
  liking. Panel (C): endorsement of government protection.

Frontiers in Psychology | www.frontiersin.org                                         9                                                May 2022 | Volume 13 | Article 898503
Bruder et al. Culture Influences Attitudes Toward Animals
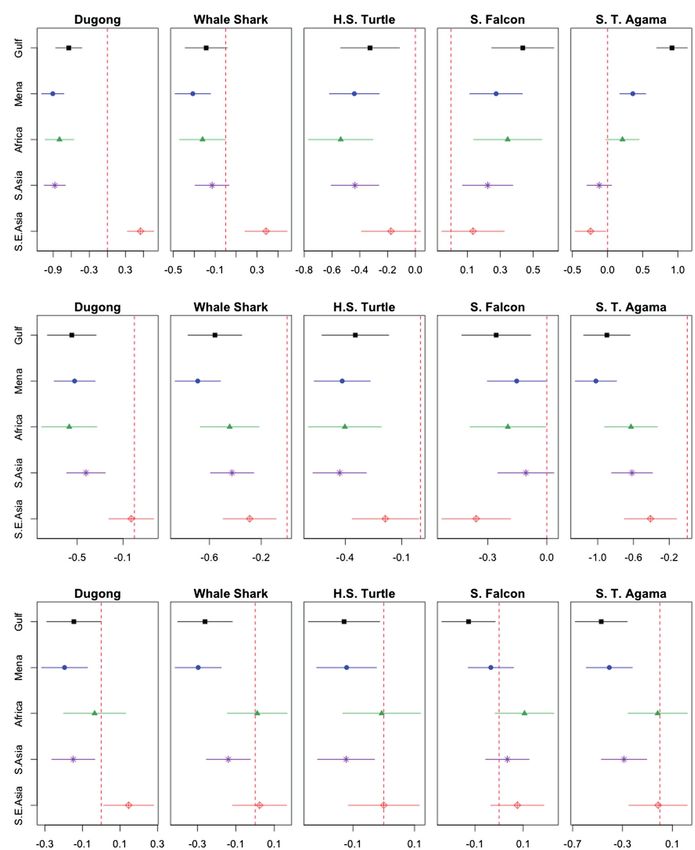
government protection. Figure 3 displays our regression for liking is also considered. In contrast, the estimated effect
analysis results. Each of the five plots displays the ordinary of liking obtained from Model 2 does not significantly decline
least squares coefficients and 95% CIs that come from three after controlling for familiarity in Model 3. For example, the
different linear regression models. In Model 1 and Model blue circle in the dugong case indicates that the estimated
2, we investigate the relationship between familiarity and effect of liking is about 0.229 [t(1,527) = 14.00, p < 0.000] in
endorsement and the relationship between liking and Model 2. The green circle in the same plot reveals that the
endorsement, respectively. Model 3 includes both familiarity estimated effect of liking is about 0.225 [t(1,524) = 12.64, p < 0.000]
and liking as predictors for the endorsement of government after the variable for familiarity is included in Model 3.
protection.1 These results allow us to better understand how the three
In order to introduce Figure 3, let us take the example types of attitudes toward threatened animals are related. First,
of the dugong: the black square and the black line in the plot the extent to which participants are familiar with a threatened
for the dugong indicate the estimated effect of familiarity with animal does not uniquely explain their endorsement of
the dugong on the endorsement of government protection for government protection for the animal. Rather, the amount of
the animal and its 95% CIs. These are derived from Model variance in the endorsement of government protection explained
1 where only the variable for familiarity, along with the control by familiarity mostly overlaps with what liking explains. Second,
variables, are included. On the other hand, the green square although familiarity and liking are correlated and jointly explain
and the green line in the same plot represent Model 3’s the endorsement of government protection, liking explains a
familiarity variable. large amount of unique variance in the endorsement of
Most notably, the results suggest that the effect of familiarity government protection that familiarity cannot explain.
diminishes significantly after accounting for liking, whereas We continued to build on the above results to delve
the effect of liking remains virtually the same after accounting further into the relationship between the three types of
for familiarity. Continuing to use the dugong example, the attitudes toward threatened animals. Our finding that
estimated effect of familiarity is about 0.11, and it is statistically familiarity does not uniquely explain participants’ endorsement
distinguishable from zero at the 0.05 level according to Model of government protection while liking does might be due
1 [t(1,530) = 5.92, p < 0.000]. However, the estimated effect to the mediating role of liking between familiarity and the
shrinks to about 0.014, and it is no longer different from zero endorsement of government protection. In other words, the
at the 0.05 level according to Model 3 [t(1,524) = 0.69, p = 0.490]. effect of familiarity with an animal on the endorsement of
Similar patterns appear in the other animal cases such that government protection might exert mostly via how much
the effect of familiarity weakens significantly after the variable they like the animal.
In Figure 4, the mediation effect graphically illustrates our
The three models’ control variables are consistent with the control variables
1 hypothesis, which suggests that the extent to which participants
used in the previous subsection. Full regression analysis results are available like the animal mediates the effect of familiarity on the
in Supplementary Tables S1-S5. endorsement of government protection. This hypothetical
FIGURE 3 | Ordinary least squares coefficients and 95% confidence intervals: Comparing the effects of familiarity and liking on the endorsement of government
protection.
Frontiers in Psychology | www.frontiersin.org 10 May 2022 | Volume 13 | Article 898503Bruder et al. Culture Influences Attitudes Toward Animals
or liking. Thus, we included the same pretreatment covariates
as in the previous analyses to minimize a possible violation
of the assumption. Additionally, we implemented a sensitivity
analysis to ensure that a possible violation of the first and
second assumptions would not significantly change our analysis
results. The results of the sensitivity analysis can be found
in Supplementary Figure S3.
We used the mediation R package (Tingley et al., 2014).
The mediation package performs a mediation analysis based
on two steps. The first step fits two regression models. To
begin with, we fit the model for the mediating variable--liking.
The right-hand side of this model includes the treatment
variable--familiarity and pretreatment covariates. We also fit
the model for the outcome variable--endorsement, in which
the right-hand side variables include the same variables as the
FIGURE 4 | Model. The total effect of familiarity on the extent to which
people endorse government protection is decomposed into two causal first model and additionally the mediating variable. The
pathways. The top pathway reflects a mechanism through which the effect of pretreatment covariates used in each of these two models are
the extent to which people are familiar with the threatened animal is mediated demographic characteristics (age, gender, and education), the
by how much they like the animal. The bottom direct pathway between composite measure of nature-relatedness, and the seven variables
familiarity and endorsement represents alternative mechanisms not intervened
for moral stances toward nature. Thereafter, the second step
by how much they like the animal.
computes the mediation effect and the direct effect using
simulated potential values that are generated from the two
regression models.
mechanism suggests that the more familiar with the animal The results are displayed in Figure 5. Each point in Figure 5
people are, the more they like the animal, and once they like is an estimated effect of a one-level increase in familiarity on
the animal, they tend to endorse government protection for the likelihood of endorsing government protection. Each
the animal. horizontal line indicates uncertainty about the estimated effect
The bottom pathway in Figure 4 captures all other mechanisms at the traditional 0.05 level. The red dotted lines indicate a
not intervened by our hypothetical mechanism. We call this null effect.
pathway the direct effect of familiarity on the endorsement The estimated mediation effect represented by the black
of government protection. The total effect of familiarity on square point in each plot is positive and statistically
the endorsement of government protection is the sum of the distinguishable from zero in every case (ps < 0.000).2 For example,
mediation effect and the direct effect. the black square point in the left-most plot indicates that a
We build on the potential outcomes approach to causal one-level increase in participants’ familiarity with the dugong
mediation analysis (Imai et al., 2010a,b) to test our hypothesis. is predicted to increase the level of endorsing protection for
We made two assumptions to identify the mediation and the animal by about 0.1 by making people like the dugong. All
direct effects in our analysis, following the sequential other mechanisms not intervened by liking, which correspond
ignorability assumption proposed by Imai et al. (2010b). to the direct effect, do not have a significant impact on the
First, we assume familiarity is independent of potential likelihood of endorsing government protection for the dugong
outcomes for endorsement of government protection and (p = 0.44).
liking, after controlling for pretreatment covariates. Since A similar pattern appears in every case as the five plots
the extent to which people are familiar with an animal is in Figure 5 show. Although the direct effect is statistically
based on their knowledge, we are less concerned about the significant at the 0.05 level in the cases of the hawksbill sea
possibility that people’s subjective liking or endorsement of turtle (p = 0.004) and the saker falcon (p = 0.02), it contributes
government protection affects familiarity. Nevertheless, to the total effect far less than the mediation effect. To be specific,
individual characteristics associated with liking could the mediation effect is predicted to contribute to about 0.65–0.88
be correlated with familiarity. Hence, we control for of the total effect in every case.
demographic characteristics, nature-relatedness, and moral These results support our hypothesis that the extent to which
stances toward nature as pretreatment covariates to minimize people like a threatened animal mediates the link between
contamination from individual characteristics. people’s familiarity with the animal and their endorsement of
The second assumption is that the extent to which people government protection. We also find that these results remain
like a threatened animal is independent of potential outcomes constant across different cultural groups. Based on our findings,
for endorsement of government protection given the observed we suggest that there exists a cross-cultural mechanism through
pretreatment covariates and the observed values for familiarity. which people’s familiarity with an animal at risk tends to make
Similar to the first assumption, this assumption would
be violated if individual characteristics associated with The values of p were computed using nonparametric bootstrap confidence
2
endorsing government protection are correlated with familiarity intervals by the mediation package.
Frontiers in Psychology | www.frontiersin.org 11 May 2022 | Volume 13 | Article 898503Bruder et al. Culture Influences Attitudes Toward Animals
FIGURE 5 | Mediation analysis results: estimated mediation, direct, and total effects and 95% nonparametric bootstrap confidence intervals. Red dotted lines at 0
indicate a null effect.
them like the animal, and their subjective liking, in turn, on their opinions about the need for animal conservation.
increases the likelihood of their endorsing government protection Despite the fact that the participants in our study were
for the animal. interested in animals and conservation (as suggested by
their self-selection without incentive to participate, and
overall high levels of liking for animals), their responses
DISCUSSION exhibited significant variability in attitudes toward animals.
The general agreement across cultures in ranking order is
The present study provides the first comparison of attitudes striking: Across every culture, the hawksbill sea turtle was
toward threatened animals and conservation across a wide highly ranked and the spiny-tailed agama ranked consistently
range of cultural groups, including understudied populations. lowest. It is interesting that the dugong did not rank higher,
The goal of this research was threefold: to assess the ranking as mammals are typically ranked the most charismatic
of animals across diverse cultural groups; to examine the ways species, at least amongst Westerners, although most species
in which responses to questions about familiarity, liking and ranked as charismatic are terrestrial (Albert et al., 2018;
endorsement for government protection toward indigenous Courchamp et al., 2018). Although reptiles are generally
animals in the Arabian Gulf might vary across diverse cultural considered to be non-charismatic species (e.g., Tisdell et al.,
groups; and to explore potential mechanisms leading people 2006), turtles have been shown to be an exception in other
to endorse government protection for threatened animals. As studies and cultures (e.g., Senko et al., 2011; Borgi and
the first study about this topic to address a diverse sample Cirulli, 2015). Other studies have found that a fear of
from a single geographic location, we shed light on how the reptiles appears across cultures (Arrindell, 2000; Ceríaco,
attitudes of people toward animals compare across cultures. 2012; Pandey et al., 2016; Pinheiro et al., 2016) and from
Our data reveal both strikingly similar shared attitudes toward a young age (e.g., Prokop and Fančovičová, 2013), suggesting
animals across the diverse cultures studied and some intriguing a culturally universal dislike for most reptiles. The spiny-
cultural variation. tailed agama is a fairly typical reptile, but the hawksbill
Previous findings (e.g., Martín-López et al., 2007) have sea turtle is arguably atypical: It is graceful, non-threatening,
demonstrated that people living closer in geographic distance and its survival is clearly jeopardized by human activities.
to animals are more aware of and express more concern for It would seem our results support the finding that the
animals near to them. In our study, all participants lived in hawksbill sea turtle is a strikingly charismatic marine reptile
the same small peninsular state of Qatar, and thus were similarly that could potentially serve as a universally appealing flagship
geographically located. A primary difference between participants species. In Qatar, the high ranking of the hawksbill sea
in this study is in cultural backgrounds. In our analyses, WEIRD turtle could be also be influenced by recent efforts to raise
participants were compared with participants from the Arabian awareness. For example, the turtles have appeared periodically
Gulf, Middle East and North African (MENA), Sub-Saharan in the local news and the Qatari government closes a
Africa, South East Asia, and South Asia. popular beach in the summer for nesting. It is possible
that these conservation activities have influenced people’s
perceptions and attitudes to some degree. To address these
Similarities Across Cultures possibilities, future research is needed to understand how
One of the most important results from our study was the marketing campaigns and conservation efforts in Qatar
influential role of a person’s subjective liking of animals impact attitudes, perceptions and behaviors of residents.
Frontiers in Psychology | www.frontiersin.org 12 May 2022 | Volume 13 | Article 898503You can also read