COVIDDEEP: SARS-COV-2/COVID-19 TEST BASED ON WEARABLE MEDICAL SENSORS AND EFFICIENT NEURAL NETWORKS
←
→
Page content transcription
If your browser does not render page correctly, please read the page content below
1

CovidDeep: SARS-CoV-2/COVID-19 Test Based
  on Wearable Medical Sensors and Efficient
              Neural Networks
    Shayan Hassantabar, Novati Stefano, Vishweshwar Ghanakota, Alessandra Ferrari, Gregory N. Nicola,
                    Raffaele Bruno, Ignazio R. Marino, and Niraj K. Jha, Fellow, IEEE

      Abstract—The novel coronavirus (SARS-CoV-2) has led to a pandemic. Because of its highly contagious nature, it has spread rapidly,
      resulting in major disruption to public health and a huge loss of human life. In addition, due to governmental orders for isolation and social
      distancing, it has also had a severe negative impact on the world economy. As a result, it is widely recognized now that widespread
      testing is key to containing the spread of the disease and opening up the economy. However, the current testing regime based on
      Reverse Transcription-Polymerase Chain Reaction for SARS-CoV-2 (the virus that causes COVID-19) has been unable to keep up with
      testing demands, and also suffers from a relatively low positive detection rate in the early stages of the disease. Hence, there is a need
      for an alternative approach for repeated large-scale testing of SARS-CoV-2/COVID-19. The emergence of wearable medical sensors
      (WMSs) and novel machine learning methods, such as deep neural networks (DNNs), points to a promising approach to address this
      challenge. WMSs enable continuous and user-transparent monitoring of the physiological signals. However, disease detection based on
      WMSs/DNNs and their deployment on resource-constrained edge devices remain challenging problems. To address these problems, we
      propose a framework called CovidDeep that combines efficient DNNs with commercially available WMSs for pervasive testing of the virus
      (in asymptomatic cases) as well as the disease (in the symptomatic cases). CovidDeep does not depend on manual feature extraction. It
      directly operates on WMS data and some easy-to-answer questions in a questionnaire whose answers can be obtained through a
      smartphone application. We collected data from 87 individuals, spanning four cohorts including healthy, asymptomatic (but
      SARS-CoV-2-positive) as well as moderately and severely symptomatic COVID-19 patients. We trained DNNs on various subsets of the
      features automatically extracted from six WMS and questionnaire categories to perform ablation studies to determine which subsets are
      most efficacious in terms of test accuracy for a four-way classification to distinguish among the four cohorts. The highest test accuracy
      obtained was 99.6%. Since different WMS subsets may be more accessible (in terms of cost, availability, etc.) to different sets of people,
      we hope these DNN models will provide users with ample flexibility. Since data collection was limited to only 87 individuals (because of
      the intensive nature of data collection), we also experimented with augmenting the real training dataset with a synthetic training dataset
      drawn from the same probability distribution. We used the synthetic dataset to impose a prior on the DNN weights. Furthermore, we
      leveraged a grow-and-prune DNN synthesis paradigm to simultaneously learn both the weights and the network architecture. Addition of
      synthetic data and use of grow-and-prune synthesis boosted the accuracy of the various DNNs further and simultaneously reduced their
      size and floating-point operations by an order of magnitude. This makes the CovidDeep DNNs both accurate and efficient, in terms of
      memory requirements and computations. The resultant DNNs can be easily deployed on edge devices, e.g., smartwatch or smartphone,
      which has the added benefit of preserving patient privacy.

      Index Terms—COVID-19 test; grow-and-prune synthesis; neural networks; SARS-CoV-2; synthetic data generation; wearable medical
      sensors.
                                                                                 F

1    I NTRODUCTION
                                                                                     of COVID-19 include fever, cough, fatigue, and myalgia.
S   ARS-C O V-2, also known as novel coronavirus, emerged
    in China, and soon after spread across the globe. The
World Health Organization (WHO) named the resultant
                                                                                     However, in more serious cases, it can lead to shortness of
                                                                                     breath, pneumonia, severe acute respiratory disorder, and
disease COVID-19. COVID-19 was declared a pandemic                                   heart problems, and may lead to death [2]. It is of paramount
on March 11, 2020 [1]. In its early stages, the symptoms                             importance to detect which individuals are infected at as
                                                                                     early a stage as possible in order to limit the spread of
This work was supported by NSF under Grant No. CNS-1907381.                          disease through quarantine and contact tracing. In response
Shayan Hassantabar and Niraj K. Jha are with the Department of Elec-
                                                                                     to COVID-19, governments around the world have issued
trical Engineering, Princeton University, Princeton, NJ, 08544 USA, e-
mail:{seyedh,jha}@princeton.edu. Novati Stefano and Alessandra Ferrari are           social distancing and self-isolation orders. This has led
with the Division of Infectious Diseases Unit, Fondazione IRCCS Policlinico          to a significant increase in unemployment across diverse
San Matteo, Pavia, Italy, e-mail: {S.Novati,alessandra.ferrari}@smatteo.pv.it.       economic sectors. As a result, COVID-19 has triggered an
Raffaele Bruno is with the Division of Infectious Diseases Unit, Fon-
dazione IRCCS Policlinico San Matteo, Pavia, Italy, and the Department               economic recession in a large number of countries [3].
of Medical, Surgical, Diagnostic and Pediatric Science, University of Pavia,              Reverse Transcription-Polymerase Chain Reaction (RT-
Italy, e-mail: {raffaele.bruno@unipv.it}. Vishweshwar Vinnakota and Gregory          PCR) is currently the gold standard for SARS-CoV-2 detection
N. Nicola are with NeuTigers, Inc., Brooklyn, NY 11201, USA, e-mail:                 [4]. This test is based on viral nucleic acid detection in sputum
{vishu,greg}@neutigers.com. Ignazio R. Marino is with Thomas Jefferson
University and Jefferson Health, Philadelphia, PA 19107, USA, e-mail:                or nasopharyngeal swab. Although it has high specificity,
{Ignazio.Marino@jefferson.edu}.                                                      it has several drawbacks. The RT-PCR test is invasive and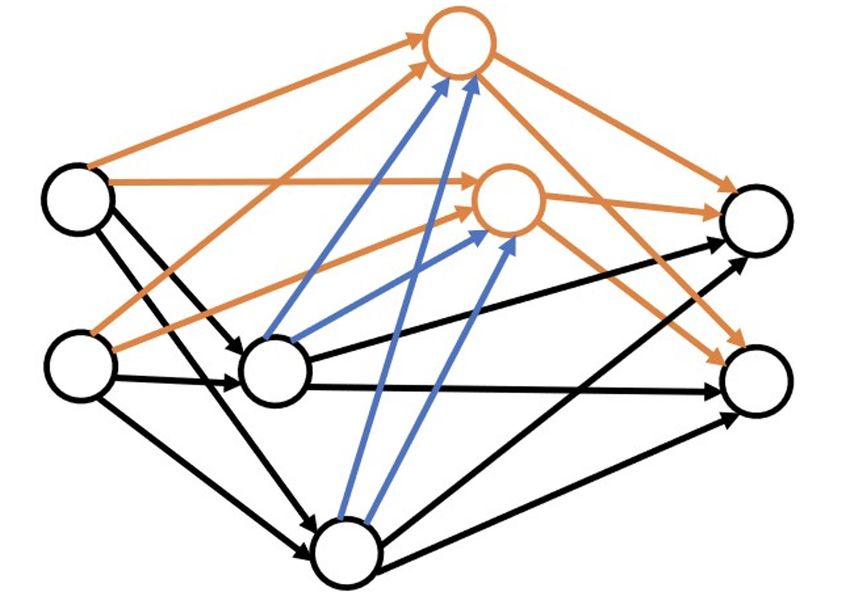
2

uncomfortable, and non-reusable testing kits have led to            not only improves accuracy, but also shrinks model size and
significant supply chain deficiencies. SARS-CoV-2 infection         reduces the computation costs of the inference process.
can also be assessed with an antibody test [5]. However,               The major contributions of this article are as follows:
antibody titers are only detectable from the second week of
                                                                        •   We propose CovidDeep, an easy-to-use, accurate, and
illness onwards and persist for an uncertain length of time.
                                                                            pervasive SARS-CoV-2/COVID-19 detection frame-
The antibody test is also invasive, requiring venipuncture
                                                                            work. It combines features extracted from physiologi-
which, in combination with a several-day processing time,
                                                                            cal signals using WMSs and simple-to-answer ques-
makes it less ideal for rapid mass screening. In the current
                                                                            tions in a smartphone application-based questionnaire
economic and social situation, there is a great need for an
                                                                            with efficient DNNs.
alternative SARS-CoV-2/COVID-19 detection method that is
                                                                        •   It uses an intelligent synthetic data generation module
easily accessible to the public for repeated testing with high
                                                                            to obtain a synthetic dataset [28], labeled by decision
accuracy.
                                                                            rules. The synthetic dataset is used to pre-train the
    To address the above issues, researchers have begun
                                                                            weights of the DNN architecture.
to explore the use of artificial intelligence (AI) algorithms
                                                                        •   It uses a grow-and-prune DNN synthesis paradigm
to detect COVID-19 [6]. Initial work concentrated on CT
                                                                            that learns both an efficient architecture and weights
scans and X-ray images [4], [7]–[20]. A survey of such
                                                                            of the DNN at the same time [29], [30].
datasets can be found in [21], [22]. These methods often
                                                                        •   It provides a solution to the daily SARS-CoV-
rely on transfer learning of a convolutional neural network
                                                                            2/COVID-19 detection problem. It captures all the
(CNN) architecture, pre-trained on large image datasets, on
                                                                            required physiological signals non-invasively through
a smaller COVID-19 image dataset. However, such an image-
                                                                            comfortably-worn WMSs that are commercially avail-
based AI approach faces several challenges that include lack
                                                                            able.
of large datasets and inapplicability outside the clinic or
hospital. In addition, other work [23] shows that it is difficult       The rest of the article is organized as follows. Section
to distinguish COVID-19 pneumonia from influenza virus              2 reviews background material. Section 3 describes the
pneumonia in a clinical setting using CT scans. Thus, the           CovidDeep framework. Section 4 provides implementation
work in this area is not mature yet.                                details. Section 5 presents experimental results. Section 6
    CORD-19 [24] is an assembly of 59000 scholarly arti-            provides a short discussion on CovidDeep and possible
cles on COVID-19. It can be used with natural language              directions for future research. Finally, Section 7 concludes the
processing methods to distill useful information on COVID-          article.
19-related topics.
    AI4COVID-19 [25] performs a preliminary diagnosis of
COVID-19 through cough sample recordings with a smart-              2   BACKGROUND
phone application. However, since coughing is a common              In this section, we discuss background material related to
symptom of two dozen non-COVID-19 medical conditions,               the CovidDeep framework. It involves recent methods for
this is an extremely difficult task. Nonetheless, AI4COVID-19       synthesizing and training efficient DNN architectures.
shows promising results and opens the door for COVID-19                 One approach is based on the use of efficient build-
diagnosis through a smartphone.                                     ing blocks. For example, MobileNetV2 [31] uses inverted
    The emergence of wearable medical sensors (WMSs)                residual blocks to reduce model size and floating-point
offers a promising way to tackle these challenges. WMSs can         operations (FLOPs). ShuffleNet-v2 [32] uses depth-wise
continuously sense physiological signals throughout the day         separable convolutions and channel-shuffling operations to
[26]. Hence, they enable constant monitoring of the user’s          ensure model compactness. Spatial convolution is one of the
health status. Training AI algorithms with data produced            most expensive operations in CNN architectures. Shift [33]
by WMSs can enable pervasive health condition tracking              uses shift-based modules that combine shifts and point-wise
and disease onset detection [27]. This approach exploits            convolutions to significantly reduce computational cost and
the knowledge distillation capability of machine learning           storage needs. FBNetV2 uses differentiable neural architec-
algorithms to directly extract information from physiological       ture search to automatically generate compact architectures.
signals. Thus, it is not limited to disease detection in the        Efficient performance predictors, e.g., for accuracy, latency,
clinical scenarios.                                                 and energy, are also used to accelerate the DNN search
    We propose a framework called CovidDeep for daily               process [34], [35].
detection of SARS-CoV-2/COVID-19 based on off-the-shelf                 In addition, DNN compression methods can be used
WMSs and compact deep neural networks (DNNs). It                    to remove redundancy in DNN models. Han et al. [36]
bypasses manual feature engineering and directly distills           propose a pruning methodology to remove redundancy from
information from the raw signals captured by available              large CNN architectures, such as AlexNet and VGG. Pruning
WMSs. It addresses the problem posed by small COVID-19              methods are also effective on recurrent neural networks [37].
datasets by relying on intelligent synthetic data generation        Combining network growth with pruning enables a sparser,
from the same probability distribution as the training data         yet more accurate, architecture. Dai et al. [29], [38] use the
[28]. These synthetic data are used to pre-train the DNN            grow-and-prune synthesis paradigm to generate efficient
architecture in order to impose a prior on the network              CNNs and long short-term memories. SCANN [30] uses
weights. To cut down on the computation and storage costs of        feature dimensionality reduction alongside grow-and-prune
the model without any loss in accuracy, CovidDeep leverages         synthesis to generate very compact models for deployment
the grow-and-prune DNN synthesis paradigm [29], [30]. This          on edge devices and Internet-of-Things sensors. It allows the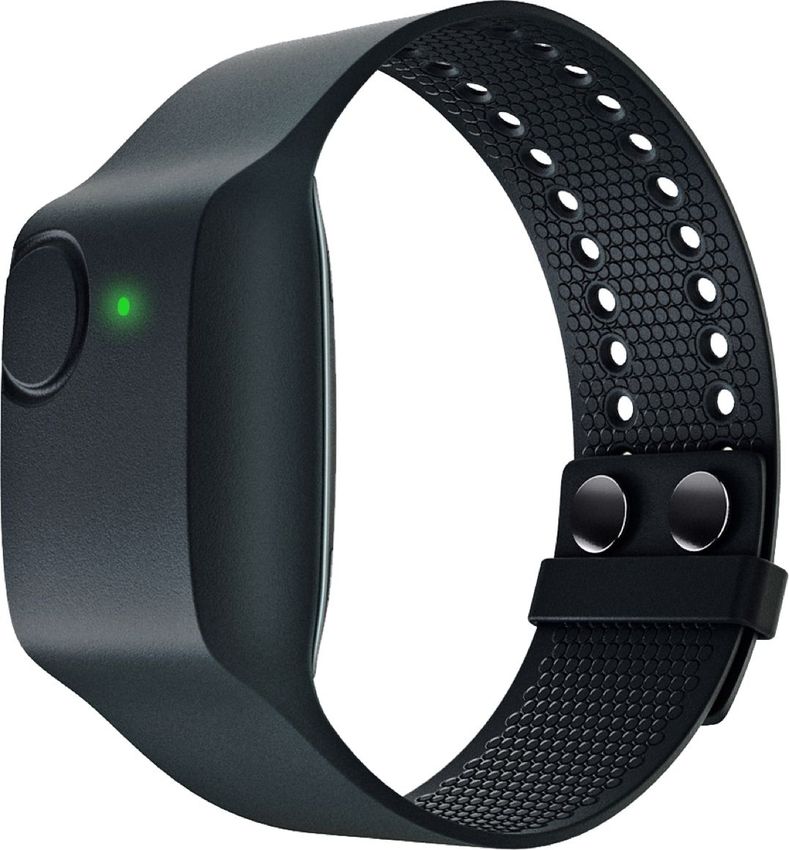
3

depth of the architecture to be changed during the training                     We collected data on age, gender, weight, height,
process.                                                                        and smoking/drinking (yes/no), but did not find
   Orthogonal to the above works, low-bit quantization of                       them to be useful either because of overfitting or
DNN weights can also be used to reduce FLOPs. A ternary                         being unrepresentative. All the relevant data sources
weight representation is used in [39] to significantly reduce                   are aggregated into a comprehensive data input for
computation and memory costs of ResNet-56, with a limited                       further processing.
reduction in accuracy.                                                     •    Model training: CovidDeep uses different types of
                                                                                DNN models: (i) those trained on the raw data only,
                                                                                (ii) those trained on raw data augmented with syn-
3     M ETHODOLOGY                                                              thetic data to boost accuracy, and (iii) those subjected
In this section, we present the CovidDeep framework. First,                     to grow-and-prune synthesis for both boosting accu-
we give an overview of the entire framework. Then, we                           racy further and reducing model size. The first type
describe the DNN architecture that is used in CovidDeep for                     of DNN model uses a few hidden layers. The second
inference. We also describe how synthetic data generation                       type of DNN model is trained based on a system
can be used to impose a prior on the DNN weights and then                       called TUTOR [28] and is suitable for settings where
use the DNN grow-and-prune synthesis paradigm to boost                          data availability is limited. It provides the DNN with a
the test accuracy further and ensure computational efficiency                   suitable inductive bias. The third type of DNN model
of the model.                                                                   is based on the grow-and-prune DNN synthesis
                                                                                paradigm and employs three architecture-changing
3.1       Framework overview                                                    operations: neuron growth, connection growth, and
                                                                                connection pruning. These operations have been
The CovidDeep framework is shown in Fig. 1. CovidDeep
                                                                                shown to yield DNNs that are both accurate and
obtains data from two different sources: physiological signals
                                                                                efficient [30].
and questionnaire. It has two flows: one that does not use syn-
                                                                           •    Model inference: CovidDeep enables the users to
thetic data and another one that does. When synthetic data
                                                                                have SARS-CoV-2/COVID-19 detection decision on
are not used, the framework just uses the real dataset divided
                                                                                their edge device on demand.
into three categories: training, validation, and test. It trains
the DNNs with the training dataset and picks the best one                  Next, we discuss the CovidDeep DNN architecture.
for the given set of features based on the validation dataset,
and finally tests this DNN on the test dataset to obtain the         3.2       Model architecture
test accuracy. However, when the real training dataset size is
small, it is often advantageous to draw a synthetic dataset          Fig. 2 shows the processing pipeline of the CovidDeep
from the same probability distribution. CovidDeep uses               framework. The architecture takes the data inputs (shown
synthetic data generation methods to increase the dataset            at the bottom) and generates a prediction, i.e., the detection
size and use such data to pre-train the DNN architecture.            decision, (shown at the top). The pipeline consists of four
Then, it uses grow-and-prune synthesis to generate inference         steps: data pre-processing, synthetic data generation and
models that are both accurate and computationally-efficient.         architecture pre-training, grow-and-prune synthesis, and
The models generated by CovidDeep are efficient enough to            output generation through softmax.
be deployed on the edge, e.g., the smartphone or smartwatch,             In the data pre-processing stage, data normalization and
for SARS-CoV-2/COVID-19 inference.                                   data alignment/aggregation are done.
    Next, we discuss the data input, model training, and                   •    Data normalization: This step is aimed at changing
model inference details.                                                        feature values to a common scale. While data normal-
                                                                                ization is not always required, it is highly beneficial
      •    Data input: As mentioned above, physiological sig-
                                                                                in the case of datasets that have features with very
           nals and a questionnaire are the two sources of data
                                                                                different ranges. It leads to better noise tolerance and
           input to the model. The physiological signals are
                                                                                improvement in model accuracy [40]. Data normal-
           derived from WMSs embedded in a smartwatch as
                                                                                ization can be done in several ways, such as min-max
           well as a discrete pulse oximeter and blood pressure
                                                                                scaling and standardization. In this work, we use
           monitor. These signals can be easily obtained in a
                                                                                min-max scaling to map each data input to the [0, 1]
           non-invasive, passive, and user-transparent manner.
                                                                                interval. Scaling can be done as follows:
           The list of these signals includes Galvanic skin re-
           sponse (GSR), inter-beat interval (IBI) that indicates                                          x − min(x)
                                                                                             xscaled =
           the heart rate, skin temperature, oxygen saturation,                                          max(x) − min(x)
           and blood pressure (systolic and diastolic). We also
                                                                           •    Data alignment/aggregation: The data from different
           collected blood volume pulse (BVP) data from the
                                                                                WMSs may have different start times and frequencies.
           smartwatch. However, we did not find the BVP
                                                                                In order to merge them into a dataset, we need to syn-
           data to be useful in distinguishing among various
                                                                                chronize the data streams based on their timestamps.
           healthy and virus-positive groups. Moreover, in the
                                                                                The answers to the questions in the questionnaire are
           questionnaire, we asked the following yes/no ques-
                                                                                also added to the final dataset.
           tions: immune-compromised, chronic lung disease,
           cough, shortness of breath, chills, fever, muscle pain,   Synthetic data generation: The training dataset generated in
           headache, sore throat, smell-taste loss, and diarrhea.    the above manner is next used to generate a synthetic dataset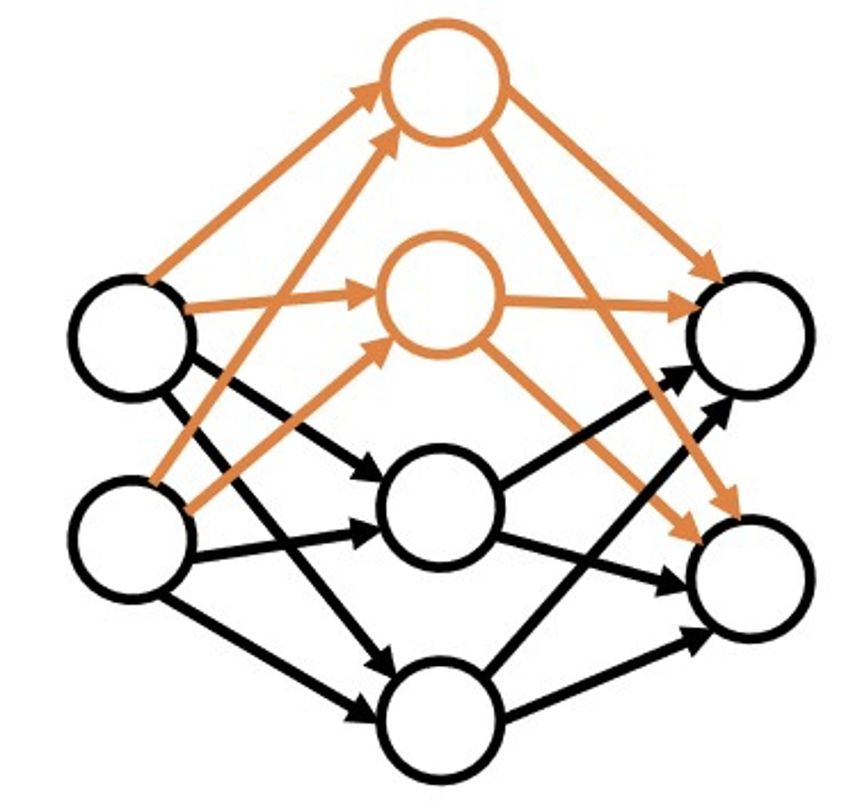
4

             Data input                                                       DNN training                                                                 Deployment

           Physiological

                 BP

                GSR                           Pre-training on synthetic data                              Grow-and-prune training
                 …                                 DT/RF

                                                                       KB
                 Ox.
                                                           Training         Pre-trained NNs

                                         Comprehensive                                                Initial             Neuron              Connection
                                            Dataset                                                architecture           growth                growth

                                                                                                     Connection
                                                                                                                                                            Edge-side
                                                                                                                                        Final
                                                           Syn data
                                                                                                      pruning                       architecture            Inference
           Questionnaire
                                                                      MND

               Cough                                                  GMM

               Fever                                                  KDE

                 …

Fig. 1. Schematic diagram of the CovidDeep framework (GSR: Galvanic skin response, IBI: inter-beat interval, Ox.: oxygen saturation, BP: blood
pressure, DT/RF: decision tree/random forest, NN: neural network, KB: knowledge-base, MND: multi-variate Normal distribution, GMM: Gaussian
mixture model, KDE: kernel density estimation).

                                                                                                                  DT/RF
                                                Softmax

                                                                                                                                                   KB

                                              Sparsely-connected
                                              neurons                                                                              Training                 Pre-trained NNs

                                                                                                  Comprehensive
                                                                                                     Dataset

                               …              Fully-connected
                                                                                                                                   Syn data
                                                    layers
                                                                                                                                               MND

                                                                                                                                              GMM
                    Syn. data gen.
                                                                                                                                               KDE

         Data pre-processing
                                                                                      Fig. 3. The schematic diagram for pre-training of the DNN model with
                                                                                      the synthetic dataset (DT/RF: decision tree/random forest, NN: neural
                                                                                      network, KB: knowledge-base).
        WMS physiological signals

               Questionnaire
                                                                                                    WMSs and questionnaire, is modeled as a normal
                                                                                                    distribution to generate the synthetic data.
Fig. 2. An illustration of the CovidDeep processing pipeline to generate                      •     Using Gaussian mixture model (GMM): This ap-
predictions from data inputs.                                                                       proach uses a multi-dimensional GMM to model
                                                                                                    the data distribution. The optimal number of GMM
                                                                                                    components is obtained with the help of a valida-
that is used to pre-train the DNN. These synthetic data and
                                                                                                    tion dataset. Subsequently, the synthetic dataset is
pre-training steps are based on the TUTOR framework [28].
                                                                                                    generated from this GMM.
The schematic diagram of the training scheme based on
                                                                                              •     Using kernel density estimation (KDE): This approach
synthetic data is shown in Fig. 3. The synthetic dataset is
                                                                                                    uses non-parametric density estimation to estimate
generated in three different ways in TUTOR:
                                                                                                    the probability distribution as a sum of many kernels.
    •    Using multi-variate Normal distribution (MND): In                                          In our implementation, KDE is based on the Gaussian
         this approach, the real training dataset, i.e., the one                                    kernel function. The synthetic data are generated
         obtained as a fraction of the data obtained from the                                       based on samples generated from this model.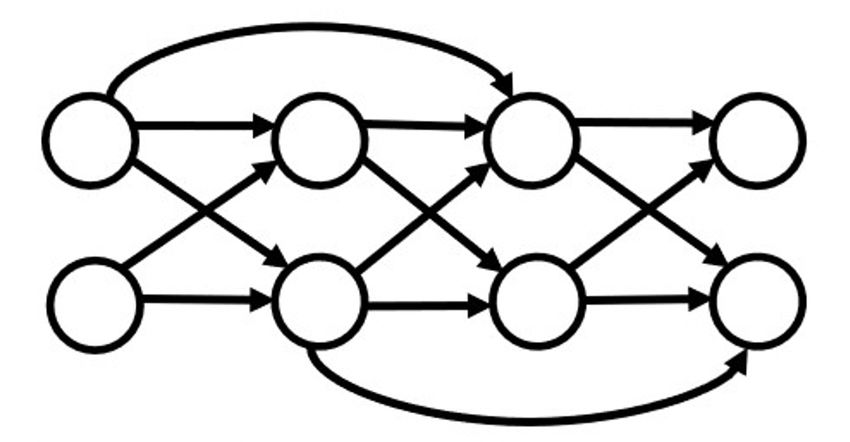
5
Building a knowledge base (KB): After generation of the Algorithm 1 Connection growth algorithm
synthetic data, we need to label the data points. To this Input: W ∈ RM ×N : weight matrix of dimension M × N ;
end, we build a KB from the real training dataset. Decision M ask ∈ RM ×N : weight mask of the same dimension as
tree (DT) and random forest (RF) are two classical machine the weight matrix; Network P ; W.grad: gradient of the
learning methods that are inherently rule-based. In fact, each weight matrix (of dimension M × N ); data D; α: growth
decision path in a decision tree, from the root to a leaf, can ratio
be thought of as a rule. Therefore, we aim to identify the set if full growth then
of rules that best describe the data. We use such a model as a M ask[1:M,1:N ] = 1
KB to label the generated synthetic dataset. else if gradient-based growth then
Training with synthetic data: We use the labeled synthetic Forward propagation of data D through network P
data to impose a prior on the DNN weights. To accomplish and then back propagation
this, we pre-train the DNN model by using the generated syn- Accumulation of W.grad for one training epoch
thetic dataset. This provides the network with an appropriate t = (α×M N )th largest element in the |W.grad| matrix
inductive bias and helps the network to “get underway.” This for all w.gradij do
helps improve accuracy when data availability is limited. if |w.gradij | > t then
M askij = 1
3.3 Grow-and-prune synthesis of the DNN end if
end for
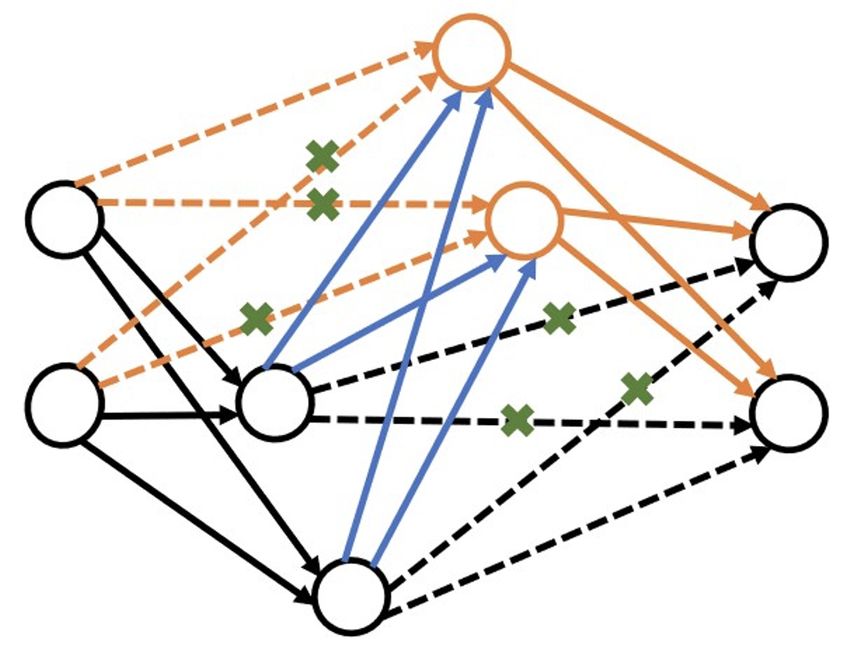
In this section, we discuss the grow-and-prune synthesis end if
paradigm [29], [30]. The approach presented in [30] allows W = W ⊗ M ask
the depth of the DNN to grow during synthesis. Thus, a Output: Modified weight matrix W and mask matrix M ask
hidden neuron can receive inputs from any neuron activated
before it (including input neurons) and can feed its output to
any neuron activated after it (including output neurons). As Algorithm 2 Connection pruning algorithm
a result, the depth of the model is determined based on how Input: Weight matrix W ∈ RM ×N ; mask matrix M ask of
the hidden neurons are connected, enabling the depth to the same dimension as the weight matrix; α: pruning
be changed during training. We use three basic architecture- ratio
changing operations in the grow-and-prune synthesis process t = (α × M N )th largest element in |W |
that are discussed next. for all wij do
Connection growth: This activates the dormant connections if |wij | < t then
in the network. The weights of the added connections are M askij = 0
set to 0 and trained later. We use two different methods for end if
connection growth: end for
W = W ⊗ M ask
• Gradient-based growth: This approach was first Output: Modified weight matrix W and mask matrix M ask
introduced by Dai et al. [29]. Algorithm 1 shows the
process of gradient-based growth. Each weight matrix
has a corresponding binary mask of the same size.
We apply connection pruning after neuron growth and
This mask is used to disregard the inactive connec-
connection growth in each iteration. Grow-and-prune train-
tions. The algorithm adds connections to reduce the
ing runs for a pre-defined number of iterations. Finally, the
loss function L significantly. To this end, the gradients
architecture that performs the best on the validation dataset
of all the dormant connections are evaluated and their
is chosen.
effectiveness ranked based on this metric. During
a training epoch, the gradients of all the weight
matrices for all the data mini-batches are captured in 4 I MPLEMENTATION D ETAILS
the back-propagation step. An inactive connection is In this section, we first explain how the data were obtained
activated if its gradient magnitude is large relative to from 87 individuals and how various datasets were prepared
the gradients in its associated layer. from the data. We also provide implementation details of the
• Full growth: This connection growth restores all the CovidDeep DNN model.
dormant connections in the network to make the
DNN fully-connected. 4.1 Data collection and preparation
Connection pruning: Connection pruning deactivates the We collected physiological signals and questionnaire data
connections that are smaller than a specified threshold. under an Institutional Research Board (IRB) approval at
Algorithm 2 shows this process. San Matteo Hospital in Pavia, Italy. 30 individuals were
Neuron growth: This step adds neurons to the network and healthy (referred to as Cohort 1) and the remaining were
thus increases network size. This is done by duplicating SARS-CoV-2-positive with varying levels of disease severity.
existing neurons in the architecture. To break the symmetry, The SARS-CoV-2-positive cases were categorized into three
random noise is added to the weights of all the connections other cohorts: asymptomatic (Cohort 2 with 27 individuals),
related to the newly added neurons. The neurons to be symptomatic-hospitalized (Cohort 3 with 13 individuals),
duplicated are either selected randomly or based on higher and symptomatic-intubated (Cohort 4 with 17 individuals).
activation values. The process is explained in Algorithm 3. Distinguishing among these cohorts is important to ascertain
6

Algorithm 3 Neuron growth algorithm                                                               TABLE 1
                                           M ×N                               Data types collected in the CovidDeep framework
Input: Network P ; weight matrix W ∈ R        ; mask matrix
   M ask of the same dimension as the weight matrix; data
   D; candidate neuron nj to be added; array A of activation             Data type                         Data source
   values for all hidden neurons                                         Immune-compromised                Questionnaire
                                                                         Chronic lung disease              Questionnaire
   if activation-based selection then                                    Shortness of breath               Questionnaire
      forward propagation through P using data D                         Cough                             Questionnaire
      i = argmax (A)                                                     Fever                             Questionnaire
   else if random selection then                                         Muscle pain                       Questionnaire
                                                                         Chills                            Questionnaire
      randomly pick an active neuron ni                                  Headache                          Questionnaire
   end if                                                                Sore throat                       Questionnaire
   M askj· = M aski· , M ask·j = M ask·i                                 Smell/taste loss                  Questionnaire
                                                                         Diarrhea                          Questionnaire
   wj· = wi· + noise, w·j = w·i + noise
Output: Modified weight matrix W and mask matrix M ask                   Galvanic skin response (µS)       Smart watch
                                                                         Skin temperature (◦ C )           Smart watch
                                                                         Inter-beat interval (ms)          Smart watch
                                                                         Oxygen saturation (%)             Pulse oximeter
who may be spreading the virus unknowingly and how much                  Systolic blood pressure (mmHg)    Blood pressure monitor
medical support is needed for symptomatic individuals with               Diastolic blood pressure (mmHg)   Blood pressure monitor
varying levels of severity. Hence, we train DNN models that
can perform four-way classification.
    To collect the physiological signals, we used commercially     collection lasts for approximately one hour for each partic-
available devices: Empatica E4 smartwatch (sensors we              ipant, during which time we collect sensor data from the
found useful: GSR, IBI, skin temperature), a pulse oximeter,       smartwatch. We stream the data from the smartwatch to the
and a blood pressure monitor. Alongside the physiological          smartphone over Bluetooth in real-time using a smartphone
signals, we employed a questionnaire to collect information        application. This application collects the data and performs
about possible COVID-19-related symptoms from all the              basic validation to ensure data integrity.
individuals. We also collected data about age, gender, weight,         Next, we pre-process the raw data to generate a com-
height, and smoking/drinking (yes/no), but did not rely on         prehensive dataset. To this end, we first synchronize the
these features as they were not necessarily representative         WMS data streams. We then divide the data streams into
of the larger population. Similarly, we collected BVP data         15-second data windows, with 10-second shifts in between
from the smartwatch, but did not find them to be useful            the start times of consecutive windows. The final dataset
in distinguishing the four cohorts. Table 1 shows all the          contains 24329 data instances. We divide this dataset into
data types that we collected and found to be useful. The           three parts: training, validation, and test, with 60%, 20%,
smartwatch data capture the physiological state of the user.       and 20% of the data, respectively. Furthermore, in order to
GSR measures continuous variations in the electrical charac-       conduct ablation studies to gauge the impact of different data
teristics of the skin, such as conductance, which can be caused    streams, we create different datasets, with various subsets of
by variations in body sweat. IBI correlates with cardiac health.   all the features.
Furthermore, skin acts as a medium for insulation, sweat,
and control of blood flow. Although it is not a clear indicator
of internal body temperature, skin temperature helps assess        4.2    Model implementation
skin health. The pulse oximeter indirectly measures blood          We have implemented the CovidDeep framework in PyTorch.
oxygen saturation. It is a comfortable and painless way of         We perform DNN training on the Nvidia Tesla P100 data
measuring how well oxygen is being sent to parts of the            center accelerator, with 16GB of memory. We use CUDAnn
body furthest from the heart, such as the arms and legs.           library to accelerate GPU processing. Next, we give the
Blood pressure exposes various underlying health problems.         details of the implemented DNN architectures trained on the
Last, but not the least, the questionnaire elicits information     different datasets.
that may help improve COVID-19 detection accuracy. From                We train various DNNs (with different numbers of layers
all these sources of data, we derive various subsets as            and different numbers of neurons per layer) and verify their
datasets for use in the CovidDeep framework to see which           performance on the validation dataset. In general, a three-
data features are the most beneficial to obtaining a high          layer architecture with 256, 128, and 4 neurons, respectively,
detection accuracy. In addition, the various sensor subsets        performs the best. The number of neurons in the input layer
have different costs. Hence, our results also let one evaluate     depends on which subset of features is selected for training
test accuracy vs. cost.                                            the DNN. In the case of the full dataset, the input layer has
    Before data collection commences, we inform the partic-        194 neurons, the same number as the dataset dimension. We
ipants about the procedure. We then collect some relevant          obtain the features of the dataset from the 15s data window
information and COVID-19-related symptoms in response              as follows. Sensor data collected from the smartwatch in the
to a questionnaire. We place the pulse oximeter on the index       data window consist of 180 signal readings, hence 180 fea-
finger of the user for blood oxygen measurement. We also           tures, from the three data streams running at 4Hz. We derive
obtain the systolic/diastolic blood pressure measurements.         11 features from the 11 questionnaire questions. Finally, we
We place the smartwatch on the participant’s wrist. Data           append the pulse oximeter oxygen saturation measurement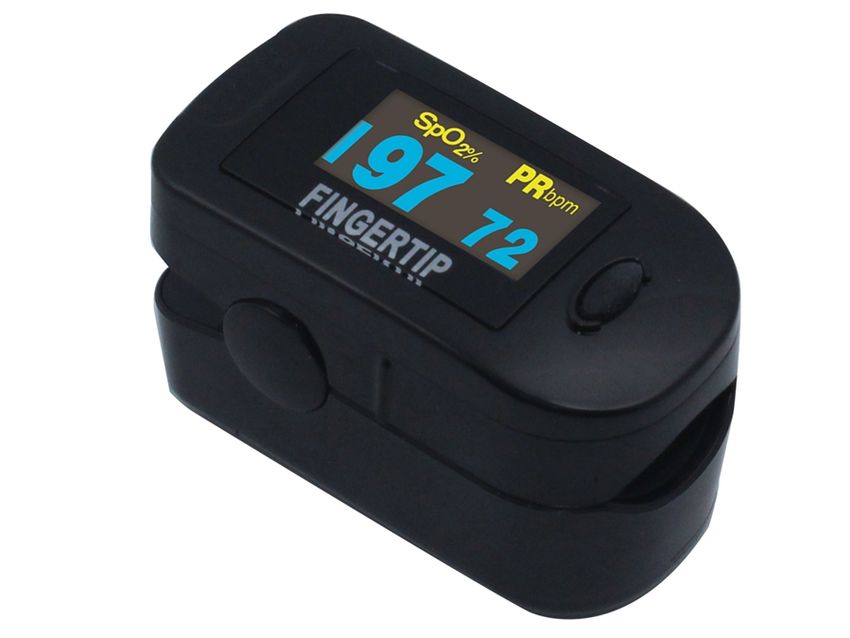
7

and systolic/diastolic blood pressure measurements to obtain                                       TABLE 2
a feature vector of length 194.                                       Confusion matrix for the most accurate four-way classification model
    We use leaky ReLU as the nonlinear activation function
in all the DNN layers. As explained in Section 3, we generate              Label↓\Prediction→      C1      C2     C3     C4     Total
three DNNs for each dataset: (i) DNN trained on the real                           C1             1517     20      0      0      1537
training dataset, (ii) DNN pre-trained on the synthetic dataset                    C2               0     1760     0      0      1760
                                                                                   C3               0       0     374     0       374
and then trained on the real training dataset, and (iii) DNN                       C4               0       0      0    1195     1195
synthesized and trained with the grow-and-prune synthesis                         Total           1517    1780    374   1195     4866
paradigm.

4.3       Network training                                           achieves a test accuracy of 99.6%. The model achieves an
We use the Adam optimizer for DNN training, with a                   FPR of only 1.3%. The low FPR means that the model does
learning rate of 1e-3 and batch size of 256. We use 100000           not raise many false alarms. It also results in a 0.0% FNR
synthetic data instances to pre-train the network architecture.      for Cohorts 2, 3, and 4, denoted as FNR(2), FNR(3), and
Moreover, in the grow-and-prune synthesis phase, we train            FNR(4), (each FNR refers to the ratio of the number of false
the network for 20 epochs each time the architecture changes.        predictions for that cohort divided by the total number of
We apply network-changing operations over five iterations.           data instances of that type). The 0.0% FNRs demonstrate the
In this step, we use pruning to achieve a pre-defined number         ability of the DNN model to not miss virus-positive cases.
of connections in the network.                                       Moreover, the Macro F1 score of the DNN model is also high:
                                                                     99.7%.
5     E XPERIMENTAL R ESULTS                                             Next, we compare the three DNN models, trained on the
                                                                     real training dataset, with the aid of synthetic data, and with
In this section, we analyze the performance of CovidDeep             the aid of grow-and-prune synthesis, for the most accurate
DNN models. We target four-way classification among the              case in Table 3. We see that even though the test accuracy of
four cohorts described earlier. In addition, we perform an           the DNN model trained on just the real dataset is already
ablation study to analyze the impact of different subsets            very high, use of synthetic data and then grow-and-prune
of features as well as different steps of CovidDeep DNN              synthesis is able to push it even higher. The impact of the
synthesis.                                                           second and third DNN models is more pronounced when
    The CovidDeep DNN models are evaluated with four                 the test accuracy of the first model is not that high (which
different metrics: test accuracy, false positive rate (FPR), false   would happen when we drop various features in the ablation
negative rate (FNR), and F1 score. These terms are based on          studies), as we will see next.
the following:
      •    True positive (negative): SARS-CoV-2/COVID-19
                                                                     5.2   Ablation studies
           (healthy) data instances classified as SARS-CoV-
           2/COVID-19 (healthy).                                     In this section, we report results on various ablation studies.
      •    False positive (negative): healthy (SARS-CoV-             We begin by considering DNN models trained on features
           2/COVID-19) data instances classified as SARS-CoV-        obtained from subsets of the six data categories (five sensors
           2/COVID-19 (healthy).                                     and the questionnaire). This helps us understand the impact
                                                                     of each of these categories and their various combinations.
These metrics evaluate the model performance from different          Then, we analyze the impact of different parts of the
perspectives. Test accuracy evaluates its overall prediction         CovidDeep training process, pre-training with synthetic data,
power. It is simply the ratio of all the correct predictions on      and grow-and-prune synthesis.
the test data instances and the total number of such instances.          Since there are six data categories from which the
The FPR is defined as the ratio of the number of negative,           corresponding features are obtained, there are 64 subsets.
i.e., healthy, instances wrongly categorized as positive (false      However, one of these subsets is the null subset. Thus, we
positives) and the total number of actual negative instances.        evaluate the remaining 63 subsets. For these evaluations, we
The FNR is the ratio of positives that yield negative test           only consider the first two types of DNN models, referred
outcomes. Thus, there is an FNR for each of the following            to as DNN Model 1 and 2. We consider grow-and-prune
cohorts: 2, 3, and 4. Because of the four-way classification,        synthesis-based models later. The results shown in Table 4
the F1 score we report is the Macro F1 score.                        correspond to the case when features from only one, two
                                                                     or three data categories are chosen, and in Table 5 when
5.1       Model performance evaluation                               features from four, five or six data categories are chosen.
We obtained the highest test accuracy with a DNN model                   We first notice that DNN Model 2 generally performs
trained with the grow-and-prune synthesis paradigm on the            better than DNN Model 1 across the various performance
dataset that contained features from four categories: GSR,           metrics. This underscores the importance of using synthetic
pulse oximeter (Ox), blood pressure (BP), and questionnaire          data when the available dataset size is not large. Second,
(Q). Table 2 shows the confusion matrix for four-way                 we observe that since this is a four-way classification, only
classification among the four cohorts: Cohort 1 (healthy),           25% accuracy is possible by randomly predicting one of
Cohort 2 (asymptomatic-positive), Cohort 3 (symptomatic-             the four cohorts. Thus, even single data categories (GSR,
hospitalized), and Cohort 4 (symptomatic-intubated), de-             Temp, IBI, Ox, BP, Q) enable much better prediction than
noted as C1, C2, C3, and C4, respectively. CovidDeep DNN             by chance. These single data categories are still only weak
8

                                                                  TABLE 3
              Test accuracy, FPR, FNRs, and F1 score (all in %) for the three DNN models obtained for the most accurate case

                  DNN model trained on                           Acc.        FPR   FNR(2)   FNR(3)    FNR(4)    F1 Score
                  Real training dataset                           99.3       0.8    0.7       1.9       0.0       99.3
                  Real+synthetic training dataset                 99.4       0.6    0.9       1.1       0.0       99.4
                  Real+synthetic training dataset + grow-prune    99.6       1.3    0.0       0.0       0.0       99.7

learners of the correct label, when used in isolation. Third,            6    D ISCUSSION AND F UTURE W ORK
DNN models, in general, tend to perform better on the
various performance metrics when more data categories
are used. However, this is not always true. For example,                 In this section, we discuss the inspirations we took from the
we obtain the highest accuracy of 99.4% with DNN Model                   human brain in the synthesis process of CovidDeep DNNs. We
2 when only features from four (GSR, Ox, BP, Q) of the                   also discuss future directions in medical research enabled by the
                                                                         CovidDeep framework.
six categories are used. Adding features based on Temp
or IBI or both actually reduces the test accuracy. This may                  An interesting ability of the human brain is to efficiently
be due to the curse of dimensionality. When the number                   solve novel problems in a new domain despite limited prior
                                                                         experience. Inspired by this human capability, CovidDeep
of features increases, in general, the dataset size needs to             uses the TUTOR [28] approach for synthetic data generation
be increased to obtain a good accuracy. For a fixed dataset              and labeling to help the neural network start from a better
size, this curse indicates that the number of features should            initialization point. Use of gradient descent from a learned
be reduced. However, throwing out informative features                   initialization point provides the DNN with an appropriate
would also reduce accuracy. In addition, some features are               inductive bias. Hence, it reduces the need for large datasets
interactive, i.e., work synergistically to increase accuracy.            that are not readily available for SARS-CoV-2/COVID-19 AI
                                                                         research.
Hence, a balance has to be found between accuracy and
the number of features. Finally, when not all sensors are                    The CovidDeep DNN training process takes another inspi-
available (perhaps due to cost reasons), a suitable set that             ration from the human brain development process in the grow-
                                                                         and-prune synthesis step. The human brain undergoes dynamic
still provides reasonable accuracy can be chosen based on                changes in its synaptic connections every second of its lifetime.
the given cost budget. This may help a broader cross-section             Acquisition of knowledge depends on these synaptic rewirings
of the population access the technology.                                 [41]. Inspired by this phenomenon, CovidDeep utilizes the
    To illustrate the effect of the different parts of the               grow-and-prune synthesis paradigm to enable DNN architecture
                                                                         adaptation throughout training. CovidDeep DNNs synthesized
CovidDeep training process, we compare 10 CovidDeep
                                                                         with grow-and-prune synthesis do not suffer from the situation
DNN models, trained based on the different DNN synthesis                 faced by most current DNNs: fixed connections during training.
and training steps. We chose these models from different                 This enables CovidDeep to generate very compact, yet accurate,
accuracy ranges. Table 6 shows comparison results for the                models for SARS-CoV-2/COVID-19 detection.
four-way classification task. We have already compared                       CovidDeep uses physiological signals extracted using com-
various performance metrics for DNN Models 1 and 2                       mercially available devices and achieves high test accuracy. As
earlier. Hence, here, we just report their accuracy, FLOPs, and          a result, it provides a testing mechanism that is accurate, easily
number of model parameters (#Param). Acc.(1) and Acc.(2),                accessible to the general public, and easy for individuals to
respectively, refer to the accuracy of DNN Model 1 and 2.                use. Furthermore, this mechanism only requires a few minutes
                                                                         of data collection from an individual to perform an inference.
The FLOPs and #Param. for these two models are identical.
                                                                         Note that one hour of data collection from each individual
We report all the performance metrics for DNN Model 3 that               was only required for training of the DNN models. It does not
is generated by grow-and-prune synthesis using both real                 require the presence of a nurse or physician during testing. In
and synthetic data. Thus, the starting point for DNN Model               fact, besides the data collected by the smartwatch and discrete
3 synthesis is DNN Model 2. Next, we compare DNN Model                   sensors (for obtaining blood oxygen and blood pressure), the
3 with the other two models based on various measures and                additional information required by the electronic questionnaire
show why it is suitable for deployment on the edge devices.              is small, related to the general health of the subject, and can be
                                                                         easily filled out with a yes/no answer. Thus, CovidDeep has
                                                                         the potential to significantly decrease the spread of SARS-CoV-2,
   •   Smaller model size: It contains 8.2× fewer parame-                save hundreds of thousands of lives, and drastically reduce the
                                                                         need for hospitalization, while also helping the world economy
       ters on an average (geometric mean) than DNN Model                recover.
       1 and 2, thus significantly reducing the memory
                                                                             CovidDeep demonstrates that WMS-based SARS-CoV-
       requirements.
                                                                         2/COVID-19 detection is feasible. Previously, diabetes diagnosis
   •   Less computation: It reduces FLOPs per inference                  was shown to be possible with the help of such sensors [27]. We
       by 8.4× on an average (geometric mean) relative to                believe that WMS-based disease detection is feasible for a large
       DNN Model 1 and 2, thus facilitating more efficient               number of diseases [26].
       inference on the edge devices.                                        Since data were collected from only 87 individuals, despite
   •   Better performance: It improves accuracy on an                    being augmented with synthetic training data drawn from the
       average by 3.3% (1.5%) relative to DNN Model 1                    real training data probability distribution, more work is needed
       (2), while also lowering FPR and FNRs, in general.                for validating the various DNN models in the field, especially
                                                                         since the data were obtained from a single location in Italy. This
                                                                         process has begun across various continents.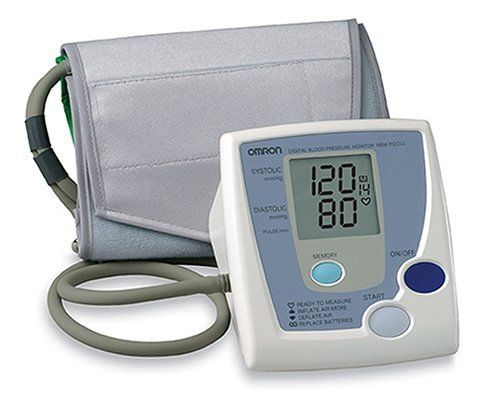
9
TABLE 4
Test accuracy, FPR, FNRs, and F1 score (all in %) for two DNN models obtained for feature subsets from one, two or three data categories
DNN Model 1 DNN Model 2
Data category Acc. FPR FNR(2) FNR(3) FNR(4) F1 Score Acc. FPR FNR(2) FNR(3) FNR(4) F1 Score
GSR 50.8 35.7 47.7 34.0 73.5 47.0 57.0 34.5 44.7 42.0 51.6 54.1
Temp 52.3 50.7 49.0 71.4 34.2 47.7 55.3 48.4 38.1 78.1 39.3 49.5
IBI 52.2 53.6 44.3 75.9 36.7 47.0 53.4 45.7 44.0 76.2 42.3 48.2
Ox 59.5 61.0 24.5 32.4 40.2 58.3 59.5 61.0 24.5 32.4 40.2 58.3
BP 85.3 10.7 29.3 8.6 0.0 85.8 85.6 18.4 21.9 8.6 0.0 86.0
Q 63.3 0.3 94.2 11.8 6.4 65.9 63.3 0.3 94.2 11.8 6.4 65.9
GSR+Temp 64.1 35.3 43.4 20.9 30.2 61.9 75.9 27.3 21.2 22.7 24.8 74.1
GSR+IBI 63.3 40.2 32.2 50.5 34.4 58.8 69.1 36.0 25.9 39.0 29.3 65.3
GSR+Ox 83.5 13.7 15.4 16.3 21.8 82.7 85.1 14.1 15.3 10.4 16.6 84.4
GSR+BP 93.5 8.8 7.7 9.1 1.1 93.2 94.6 8.5 5.5 7.8 0.7 94.2
GSR+Q 83.7 31.8 10.6 11.5 6.4 85.9 83.8 29.9 11.4 10.2 7.6 85.9
Temp+IBI 64.2 44.0 35.8 43.0 23.1 60.7 67.6 44.2 26.0 47.1 22.0 63.6
Temp+Ox 73.8 19.7 37.2 25.1 18.7 73.7 77.2 26.5 26.9 17.9 13.6 77.6
Temp+BP 89.6 7.2 21.1 5.1 0.6 89.9 91.8 7.7 12.9 4.0 3.3 92.0
Temp+Q 75.2 29.5 36.8 7.8 6.6 80.8 76.2 34.5 29.7 7.8 6.6 81.7
IBI+Ox 68.3 33.8 46.0 25.9 9.8 69.2 73.7 45.9 18.9 29.4 11.0 73.7
IBI+BP 83.3 29.4 15.5 15.0 2.7 82.8 86.9 12.4 21.6 13.9 1.2 87.2
IBI+Q 74.5 27.8 40.5 7.0 6.4 79.8 75.3 34.8 32.0 7.5 6.4 80.5
Ox+BP 93.5 1.9 15.4 4.5 0.0 94.6 94.6 1.9 12.3 4.5 0.0 95.6
Ox+Q 76.8 44.8 24.1 4.5 0.0 80.3 78.6 61.0 4.3 7.8 0.0 81.6
BP+Q 88.8 3.3 28.1 0.0 0.0 91.7 88.8 3.3 28.1 0.0 0.0 91.7
GSR+Temp+IBI 76.7 26.8 27.2 23.0 13.2 73.5 82.5 21.7 14.0 21.1 16.2 79.1
GSR+Temp+Ox 88.9 16.8 6.6 4.0 12.4 89.3 90.8 14.4 6.0 4.5 8.8 89.6
GSR+Temp+BP 91.6 15.5 6.2 8.0 2.6 91.9 94.9 6.5 5.8 3.7 2.8 95.1
GSR+Temp+Q 84.3 27.1 14.4 4.3 6.5 87.6 85.9 27.5 11.1 4.5 4.3 88.6
GSR+IBI+Ox 85.5 23.3 9.3 17.6 10.0 84.1 88.7 20.9 7.5 10.7 4.6 86.9
GSR+IBI+BP 93.5 11.3 6.5 5.9 0.7 93.0 94.1 12.5 3.1 7.2 1.1 93.5
GSR+IBI+Q 84.7 28.1 12.2 5.1 6.4 86.2 85.4 28.5 9.8 6.4 6.4 88.4
GSR+Ox+BP 98.1 1.1 3.6 1.6 0.6 98.1 99.0 0.9 1.5 1.6 0.3 98.9
GSR+Ox+Q 92.0 13.9 9.3 2.7 0.0 93.7 93.1 10.9 9.1 2.7 0.0 94.4
GSR+BP+Q 94.8 10.2 5.2 1.9 0.0 95.8 95.0 11.1 3.6 1.9 0.0 96.0
Temp+IBI+Ox 80.4 30.4 19.4 14.4 7.7 79.5 84.0 29.0 11.5 15.8 6.1 83.7
Temp+IBI+BP 91.3 18.5 6.4 4.3 0.9 91.5 94.1 10.7 5.8 3.7 0.5 94.3
Temp+IBI+Q 80.2 23.6 29.3 2.4 6.4 83.9 81.1 26.1 25.2 1.1 6.0 84.3
Temp+Ox+BP 95.8 8.5 3.6 1.3 0.6 96.3 97.1 3.6 4.0 1.1 0.8 97.6
Temp+Ox+Q 82.8 25.1 23.8 7.8 0.2 86.5 81.6 23.6 28.6 7.8 0.1 85.6
Temp+BP+Q 90.4 18.2 10.2 0.8 0.3 92.4 91.1 3.8 20.9 1.3 0.0 92.9
IBI+Ox+BP 95.3 8.9 4.4 2.7 0.3 95.4 97.3 4.6 3.0 2.4 0.0 97.6
IBI+Ox+Q 80.5 28.5 28.7 1.6 0.0 84.5 82.8 32.1 19.1 1.9 0.0 86.2
IBI+BP+Q 87.9 20.2 15.7 0.0 0.3 90.7 88.8 20.4 13.1 0.0 0.2 91.6
Ox+BP+Q 95.0 1.9 12.3 0.0 0.0 96.3 95.3 0.7 12.3 0.0 0.0 96.6
TABLE 5
Test accuracy, FPR, FNRs, and F1 score (all in %) for two DNN models obtained for feature subsets from four, five or six data categories
DNN Model 1 DNN Model 2
Data category Acc. FPR FNR(2) FNR(3) FNR(4) F1 Score Acc. FPR FNR(2) FNR(3) FNR(4) F1 Score
GSR+Temp+IBI+Ox 92.4 11.6 6.4 9.1 3.9 91.3 93.5 9.3 6.0 6.4 3.7 91.8
GSR+Temp+IBI+BP 94.8 10.9 3.6 3.2 0.8 95.0 97.0 5.0 2.6 3.7 0.8 97.0
GSR+Temp+IBI+Q 87.9 16.6 17.1 1.1 2.4 89.5 89.2 16.8 12.2 1.9 3.9 90.8
GSR+Temp+Ox+BP 98.1 2.1 2.8 0.8 0.6 98.3 98.7 2.6 0.4 1.9 0.8 98.5
GSR+Temp+Ox+Q 89.4 28.0 4.2 2.1 0.2 91.6 90.8 18.5 8.8 2.4 0.2 92.8
GSR+Temp+BP+Q 92.6 10.7 10.6 1.9 0.2 94.2 95.8 10.0 2.4 1.3 0.1 96.7
GSR+IBI+Ox+BP 97.9 4.6 1.0 2.4 0.3 97.8 99.1 1.7 0.6 2.1 0.2 98.8
GSR+IBI+Ox+Q 90.8 21.5 6.1 2.7 0.0 92.4 93.7 14.2 4.3 2.7 0.0 94.5
GSR+IBI+BP+Q 92.5 7.5 13.6 1.1 0.4 94.0 94.6 13.3 2.8 1.1 0.3 95.7
GSR+Ox+BP+Q 99.3 0.8 0.7 1.9 0.0 99.3 99.4 0.6 0.9 1.1 0.0 99.4
Temp+IBI+Ox+BP 97.3 3.9 3.6 0.5 0.3 97.6 97.8 3.7 2.5 1.3 0.3 98.0
Temp+IBI+Ox+Q 85.2 24.7 18.6 2.9 0.0 87.6 87.8 17.2 17.7 4.3 0.0 89.4
Temp+IBI+BP+Q 91.2 12.9 12.7 0.3 0.4 93.0 93.4 11.5 8.2 0.0 0.1 94.8
Temp+Ox+BP+Q 94.2 9.0 8.0 0.5 0.0 95.5 94.3 6.6 9.7 1.1 0.0 95.7
IBI+Ox+BP+Q 95.8 4.8 7.3 0.0 0.0 96.8 97.3 7.2 1.2 0.0 0.0 98.0
GSR+Temp+IBI+Ox+BP 98.5 3.1 0.9 1.6 0.3 98.4 98.2 4.3 0.8 1.9 0.2 98.1
GSR+Temp+IBI+Ox+Q 92.5 15.6 6.5 2.4 0.0 93.3 93.7 11.0 7.5 1.9 0.0 94.7
GSR+Temp+IBI+BP+Q 90.6 26.0 3.0 0.8 0.2 92.6 94.8 8.3 7.1 0.0 0.2 95.9
GSR+Temp+Ox+BP+Q 94.0 18.4 0.2 1.9 0.0 95.1 98.0 3.7 1.9 1.9 0.0 98.3
GSR+IBI+Ox+BP+Q 97.7 5.1 1.6 1.6 0.0 97.9 99.1 1.8 0.7 0.8 0.0 99.2
Temp+IBI+Ox+BP+Q 94.0 13.5 4.7 0.3 0.0 95.2 97.2 7.0 1.4 0.3 0.0 97.9
GSR+Temp+IBI+Ox+BP+Q 95.9 4.5 7.4 0.3 0.0 96.8 97.9 3.4 2.7 0.5 0.0 98.3
10

                                                                TABLE 6
                         Comparison of the three DNN models (all performance metrics in %) for various feature sets

                                     DNN Models 1 and 2                                         DNN Model 3
       Data category       Acc.(1)    Acc.(2) FLOPs #Param.      Acc.   FLOPs       #Param     FPR FNR(2) FNR(3)           FNR(4)    F1 Score
       GSR+Ox+BP+Q          99.3       99.4   104.1k    52.2k    99.6     9.6k        5.0k      1.3      0.0       0.0       0.0       99.7
       Temp+IBI+Ox+BP       97.3       97.8    129.1    64.8k    98.8    13.6k        7.0k      2.0      1.4       0.0       0.0       99.1
       GSR+Temp+IBI+BP      94.8       97.0   159.3k    79.9k    99.0    19.6k       10.0k      0.5      1.7       2.4       0.1       98.9
       Ox+BP+Q              95.0       95.3    73.3k    36.9k    95.3     7.6k        4.0k      0.7     12.2       0.0       0.0       96.6
       GSR+IBI+BP           93.5       94.1   128.6k    64.5k    97.5    11.6k        6.0k      2.7      3.7       3.5       0.0       97.7
       GSR+Ox+Q             92.0       93.1    103.k    51.7k    93.3    11.6k        6.0k     10.2      9.0       2.4       0.0       94.7
       Temp+BP+Q            90.4       91.1   103.5k    52.0k    96.2    15.6k        8.0k      3.4      7.6       0.3       0.0       97.1
       GSR+Temp+Ox          88.9       90.8   128.1k    64.3k    96.7    29.6k       15.0k      4.2      3.2       4.3       1.9       96.4
       GSR+IBI+Ox           85.5       88.7   128.1k    64.2k    91.3    15.6k        8.0k     12.6      7.8       4.3       6.1       91.5
       GSR+Ox               83.5       85.1    97.4k    48.9k    85.9     9.6k        5.0k     16.0     13.1       9.1      14.7       85.5

7 C ONCLUSION                                                                  Available: https://apps.who.int/iris/bitstream/handle/10665/
In this article, we proposed a framework called CovidDeep to                   331685/nCoVsitrep01Apr2020-eng.pdf
                                                                        [2]    E. Mahase, “Coronavirus: COVID-19 has killed more people
facilitate daily and pervasive detection of SARS-CoV-2/COVID-
                                                                               than SARS and MERS combined, despite lower case fatality
19. The framework combines off-the-shelf WMSs with efficient                   rate,” British Medical Journal, vol. 368, 2020. [Online]. Available:
DNNs to achieve this goal. CovidDeep DNNs can be easily                        https://www.bmj.com/content/368/bmj.m641
deployed on edge devices (e.g., smartphones and smartwatches)           [3]    M. Nicola, Z. Alsafi, C. Sohrabi, A. Kerwan, A. Al-Jabir, C. Iosifidis,
as well as servers. CovidDeep uses synthetic data generation                   M. Agha, and R. Agha, “The socio-economic implications of the
to alleviate the need for large datasets. In addition, training                coronavirus and COVID-19 pandemic: A review,” Int. J. Surgery,
of CovidDeep DNNs based on the grow-and-prune synthesis                        2020.
paradigm enables them to learn both the weights and the                 [4]    C. Butt, J. Gill, D. Chun, and B. A. Babu, “Deep learning system to
architecture during training. CovidDeep was evaluated based                    screen coronavirus disease 2019 pneumonia,” Applied Intelligence,
on data collected from 87 individuals. The highest accuracy                    p. 1, 2020.
it achieves is 99.6%. However, many subsets of features that            [5]    K. Dheda, S. Jaumdally, M. Davids, J.-W. Chang, P. Gina, A. Pooran,
                                                                               E. Makambwa, A. Esmail, E. Vardas, and W. Preiser, “Diagnosis of
correspond to easily accessible sensors in the market also achieve             COVID-19: Considerations, controversies and challenges in South
high enough accuracy to be practically useful. With more data                  Africa,” Wits Journal of Clinical Medicine, vol. 2, no. SI, p. 3, 2020.
collected from larger deployment scenarios, the accuracy of             [6]    J. Bullock, K. H. Pham, C. S. N. Lam, M. Luengo-Oroz et al.,
CovidDeep DNNs can be improved further through incremental                     “Mapping the landscape of artificial intelligence applications against
learning.                                                                      COVID-19,” arXiv preprint arXiv:2003.11336, 2020.
Contributions: The SARS-CoV-2/COVID-19 detection project                [7]    M. Farooq and A. Hafeez, “COVID-ResNet: A deep learning
was conceived by Niraj K. Jha. He also supervised the dataset                  framework for screening of COVID-19 from radiographs,” arXiv
preparation and DNN model generation efforts. Shayan Has-                      preprint arXiv:2003.14395, 2020.
santabar performed DNN synthesis and evaluation. Vishwesh-              [8]    L. Wang and A. Wong, “COVID-Net: A tailored deep convolutional
war Ghanakota developed the smartphone application for                         neural network design for detection of COVID-19 cases from chest
                                                                               radiography images,” arXiv preprint arXiv:2003.09871, 2020.
data collection, authenticated the credentials of the application
                                                                        [9]    “SIRM COVID-19 Database,” https://www:sirm:org/category/
sending data, ensured data integrity, and ran pre-processing                   senza-categoria/covid-19/.
scripts. Gregory N. Nicola MD and Ignazio R. Marino MD                  [10]   “Diagnosi radiologica e prevenzione della diffusione di COVID-19
defined the patient cohorts, and helped with the IRB approval                  nei dipartimenti di radiologia.” [Online]. Available: https://www.
process. Gregory N. Nicola MD, Ignazio R. Marino MD, and                       sirm.org/wp-content/uploads/2020/03/SIRM-Covid-19.pdf
Bruno Raffaele decided on the questions to be placed in the             [11]   J. Zhang, Y. Xie, Y. Li, C. Shen, and Y. Xia, “COVID-19 screening on
questionnaire. Novati Stefano, Alessandra Ferrari, and Bruno                   chest X-ray images using deep learning based anomaly detection,”
Raffaele collected data from patients and healthy individuals                  arXiv preprint arXiv:2003.12338, 2020.
and labeled the data. All co-authors helped with the revision           [12]   A. Narin, C. Kaya, and Z. Pamuk, “Automatic detection of
and editing of the manuscript.                                                 coronavirus disease (COVID-19) using X-ray images and deep
Acknowledgments: The project was facilitated by the tireless                   convolutional neural networks,” arXiv preprint arXiv:2003.10849,
                                                                               2020.
efforts of Bob Schena (CEO, Rajant Corp.) and Adel Laoui (CEO,
                                                                        [13]   A. Abbas, M. M. Abdelsamea, and M. M. Gaber, “Classification of
NeuTigers, Inc.). Giana Schena and Maria Schena helped with                    COVID-19 in chest X-ray images using DeTraC deep convolutional
buying and transporting the instruments as well as English-                    neural network,” arXiv preprint arXiv:2003.13815, 2020.
to-Italian translations of various documents. Joe Zhang helped          [14]   L. O. Hall, R. Paul, D. B. Goldgof, and G. M. Goldgof, “Finding
initially with feature extraction from the raw dataset. Claudia                COVID-19 from chest X-rays using deep learning on a small
Cirillo coordinated all the administrative work and helped with                dataset,” arXiv preprint arXiv:2004.02060, 2020.
translation of documents to Italian for the IRB application. Ravi       [15]   P. K. Sethy and S. K. Behera, “Detection of coronavirus disease
Jha helped with proofreading of the manuscript.                                (COVID-19) based on deep features,” Preprints, vol. 2020030300, p.
Competing interests: Four of the co-authors of this article,                   2020, 2020.
Niraj K. Jha, Shayan Hassantabar, Vishweshwar Ghanakota, and            [16]   L. Li, L. Qin, Z. Xu, Y. Yin, X. Wang, B. Kong, J. Bai, Y. Lu, Z. Fang,
Gregory N. Nicola MD have equity in NeuTigers, Inc. Neutigers,                 Q. Song et al., “Artificial intelligence distinguishes COVID-19 from
along with Rajant Corporation and Thomas Jefferson University                  community acquired pneumonia on chest CT,” Radiology, p. 200905,
                                                                               2020.
and Jefferson Health, enabled data collection from San Matteo
                                                                        [17]   O. Gozes, M. Frid-Adar, H. Greenspan, P. D. Browning, H. Zhang,
Hospital, Pavia, Italy.                                                        W. Ji, A. Bernheim, and E. Siegel, “Rapid AI development cycle for
                                                                               the coronavirus (COVID-19) pandemic: Initial results for automated
                                                                               detection & patient monitoring using deep learning CT image
R EFERENCES                                                                    analysis,” arXiv preprint arXiv:2003.05037, 2020.
[1]   World Health Organization and others, “Coronavirus disease        [18]   I. D. Apostolopoulos and T. A. Mpesiana, “COVID-19: Automatic
      2019 (COVID-19): Situation report, 72,” 2020. [Online].                  detection from X-ray images utilizing transfer learning with
11
convolutional neural networks,” Physical and Engineering Sciences
in Medicine, p. 1, 2020.
[19] S. Wang, Y. Zha, W. Li, Q. Wu, X. Li, M. Niu, M. Wang, X. Qiu,
H. Li, H. Yu et al., “A fully automatic deep learning system for
COVID-19 diagnostic and prognostic analysis,” medRxiv, 2020.
[20] P. Afshar, S. Heidarian, F. Naderkhani, A. Oikonomou, K. N. Pla-
taniotis, and A. Mohammadi, “COVID-CAPS: A capsule network-
based framework for identification of COVID-19 cases from X-ray
images,” arXiv preprint arXiv:2004.02696, 2020.
[21] R. Kalkreuth and P. Kaufmann, “COVID-19: A survey on public
medical imaging data resources,” arXiv preprint arXiv:2004.04569,
2020.
[22] J. P. Cohen, P. Morrison, and L. Dao, “COVID-19 image data
collection,” arXiv preprint arXiv:2003.11597, 2020.
[23] L. Lin, G. Fu, S. Chen, and J. Tao, “CT manifestation of coronavirus
disease (COVID-19) pneumonia and influenza virus pneumonia: A
comparative study,” American J. Roentgenology, pp. 1–9, 2020.
[24] “COVID-19 Open Research Dataset (CORD-19),” https://pages:
semanticscholar:org/Coronavirus-research.
[25] A. Imran, I. Posokhova, H. N. Qureshi, U. Masood, S. Riaz, K. Ali,
C. N. John, and M. Nabeel, “AI4COVID-19: AI enabled preliminary
diagnosis for COVID-19 from cough samples via an app,” arXiv
preprint arXiv:2004.01275, 2020.
[26] H. Yin and N. K. Jha, “A health decision support system for disease
diagnosis based on wearable medical sensors and machine learning
ensembles,” IEEE Trans. Multi-Scale Computing Systems, vol. 3, no. 4,
pp. 228–241, 2017.
[27] H. Yin, B. Mukadam, X. Dai, and N. Jha, “DiabDeep: Pervasive
diabetes diagnosis based on wearable medical sensors and efficient
neural networks,” IEEE Trans. Emerging Topics in Computing, 2019.
[28] S. Hassantabar, P. Terway, and N. K. Jha, “TUTOR: Training neural
networks using decision rules as model priors,” in progress.
[29] X. Dai, H. Yin, and N. K. Jha, “NeST: A neural network synthesis
tool based on a grow-and-prune paradigm,” IEEE Trans. Computers,
vol. 68, no. 10, pp. 1487–1497, Oct. 2019.
[30] S. Hassantabar, Z. Wang, and N. K. Jha, “SCANN: Synthesis of com-
pact and accurate neural networks,” arXiv preprint arXiv:1904.09090,
2019.
[31] M. Sandler, A. Howard, M. Zhu, A. Zhmoginov, and L.-C. Chen,
“MobileNet v2: Inverted residuals and linear bottlenecks,” in Proc.
IEEE/CVF Conf. Computer Vision and Pattern Recognition, 2018, pp.
4510–4520.
[32] N. Ma, X. Zhang, H.-T. Zheng, and J. Sun, “ShuffleNet v2: Practical
guidelines for efficient CNN architecture design,” arXiv preprint
arXiv:1807.11164, vol. 1, 2018.
[33] B. Wu, A. Wan, X. Yue, P. Jin, S. Zhao, N. Golmant, A. Gholaminejad,
J. Gonzalez, and K. Keutzer, “Shift: A zero flop, zero parameter
alternative to spatial convolutions,” in Proc. IEEE Conf. Computer
Vision and Pattern Recognition, 2018, pp. 9127–9135.
[34] X. Dai, P. Zhang, B. Wu, H. Yin, F. Sun, Y. Wang, M. Dukhan,
Y. Hu, Y. Wu, Y. Jia, P. Vajda, M. Uyttendaele, and N. K. Jha,
“ChamNet: Towards efficient network design through platform-
aware model adaptation,” in Proc. IEEE Conf. Computer Vision and
Pattern Recognition, 2019.
[35] S. Hassantabar, X. Dai, and N. K. Jha, “STEERAGE: Synthesis of
neural networks using architecture search and grow-and-prune
methods,” arXiv preprint arXiv:1912.05831, 2019.
[36] S. Han, H. Mao, and W. J. Dally, “Deep compression: Compressing
deep neural networks with pruning, trained quantization and
Huffman coding,” arXiv preprint arXiv:1510.00149, 2015.
[37] S. Han, J. Kang, H. Mao, Y. Hu, X. Li, Y. Li, D. Xie, H. Luo, S. Yao,
Y. Wang et al., “ESE: Efficient speech recognition engine with
sparse LSTM on FPGA,” in Proc. ACM/SIGDA Int. Symp. Field-
Programmable Gate Arrays, 2017, pp. 75–84.
[38] X. Dai, H. Yin, and N. K. Jha, “Grow and prune compact, fast, and
accurate LSTMs,” IEEE Trans. Computers, vol. 69, no. 3, pp. 441–452,
Mar. 2020.
[39] C. Zhu, S. Han, H. Mao, and W. J. Dally, “Trained ternary
quantization,” arXiv preprint arXiv:1612.01064, 2016.
[40] A. Krizhevsky, I. Sutskever, and G. E. Hinton, “Imagenet classifica-
tion with deep convolutional neural networks,” in Proc. Advances
in Neural Information Processing Systems, 2012, pp. 1097–1105.
[41] S. Grossberg, “Nonlinear neural networks: Principles, mechanisms,
and architectures,” Neural Networks, vol. 1, no. 1, pp. 17–61, 1988.You can also read