CORROSION-RESISTANT STEEL-MGO COMPOSITES AS REFRACTORY MATERIALS FOR MOLTEN ALUMINUM ALLOYS
←
→
Page content transcription
If your browser does not render page correctly, please read the page content below
materials
Article
Corrosion-Resistant Steel–MgO Composites as
Refractory Materials for Molten Aluminum Alloys
Piotr Malczyk 1, *, Tilo Zienert 1 , Florian Kerber 1 , Christian Weigelt 1 , Sven-Olaf Sauke 2 ,
Hubertus Semrau 2 and Christos G. Aneziris 1
 1   Institute of Ceramic, Glass and Construction Materials, TU Bergakademie Freiberg, Agricolastr. 17,
     09599 Freiberg, Germany; tilo.zienert@ikgb.tu-freiberg.de (T.Z.); florian.kerber@ikgb.tu-freiberg.de (F.K.);
     christian.weigelt@ikgb.tu-freiberg.de (C.W.); aneziris@ikgb.tu-freiberg.de (C.G.A.)
 2   ZPF GmbH, Petersaecher 4–6, 74963 Siegelsbach, Germany; sosauke@saukesemrau.de (S.-O.S.);
     prof_semrau@semrau.se (H.S.)
 *   Correspondence: piotr.malczyk@ikgb.tu-freiberg.de; Tel.: +49-37-3139-3626

 Received: 11 September 2020; Accepted: 20 October 2020; Published: 23 October 2020

 Abstract: In this study, a novel metal matrix composite based on 60 vol% 316L stainless steel
 and 40 vol% MgO manufactured by powder metallurgy technology was developed. The corrosion
 resistance of the developed steel–MgO composite material against molten aluminum alloy AlSi7Mg0.3
 was investigated by means of wettability tests and long-term crucible corrosion tests. The wettability
 tests were carried out using the sessile drop method with the capillary purification technique in
 a hot-stage microscope (HSM). Static corrosion tests were performed in molten aluminum alloy at
 850 ◦ C for 168 h to evaluate the impact of pre-oxidation of the composite surface on the corrosion
 resistance. The pre-oxidation of steel–MgO composites was carried out at 850 and 1000 ◦ C for 24 h,
 based on preliminary investigations using thermogravimetry (TG) and dilatometry. The influence of
 the pre-oxidation on the composite structure, the corrosion resistance, and the phase formation at the
 interface between the steel–MgO composite and aluminum alloy was analyzed using SEM/EDS and
 XRD. The impact of the steel–MgO composite material on the composition of the aluminum alloy
 regarding the type, size, and quantity of the formed precipitations was investigated with the aid of
 ASPEX PSEM/AFA and SEM/EBSD. It was revealed that the pre-oxidation of the steel–MgO composite
 at 1000 ◦ C induced the formation of stable MgO-FeO solid solutions on its surface, leading to
 a significant increase of long-term corrosion resistance against the liquid aluminum alloy.

 Keywords: metal matrix composites; molten aluminum; corrosion; wettability; surface oxidation

1. Introduction
      The chemical reactivity of molten aluminum alloys in contact with steel-based materials is well
known and has already been widely studied [1–4]. A short contact time of steel with liquid aluminum
is utilized for the formation of very robust, protective Fe-Al intermetallic layers on steel parts [5–8].
However, longer contact times of steel-based materials with liquid aluminum cause rapid dissolution
of the steel and damage to the parts [2,4,9].
      The wettability of metals and their alloys can be studied using various methods [10,11]. The wetting
angle, which is measured between the molten metal and the substrate, is often used for the estimation
of corrosion behavior or adhesion [11–14]. The wetting angle depends on the surface characteristics
of the substrate, as well as on the composition and viscosity of the melt at a given temperature and
atmosphere [15–17]. The viscosity of Al-Si alloys at casting temperatures is very low and decreases
with the content of Si [16,18], entailing deep infiltration of the melt into the substrate and subsequent
corrosion phenomena. The chemical interactions cause serious problems in the determination of

Materials 2020, 13, 4737; doi:10.3390/ma13214737                                   www.mdpi.com/journal/materials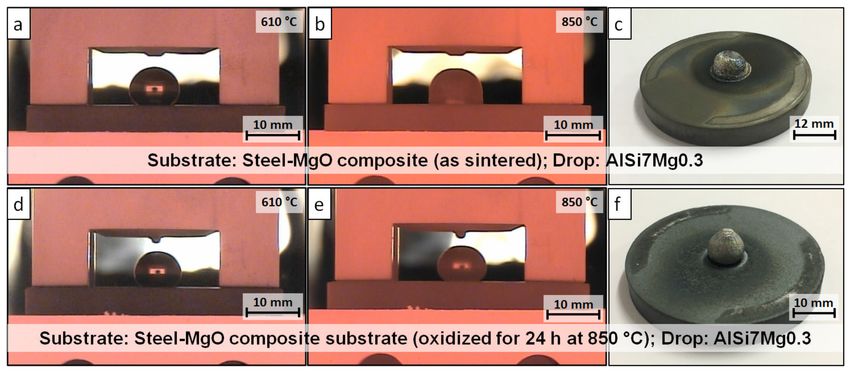
Materials 2020, 13, 4737                                                                                       2 of 22

aluminum wetting angles [13]. By means of sessile drop method with the capillary purification
technique, the melt drop comes into contact with the substrate after reaching the melting point and the
measurement is performed immediately after the deposition of the drop.
      For the investigation of long-term corrosion in melts, static crucible tests or dynamic finger
immersion tests are applied [19–21]. The immersion tests mostly take less than 12 h. The crucible
corrosion test is commonly used in the field of refractory oxide ceramics and is characterized by
significantly longer testing times [19,21,22]. For example, Sellers et al. [23] applied the crucible method
to study the corrosion of 316L stainless steel and Hastelloy-N superalloy in a molten LiF-NaF-KF
salt eutectic. No studies on the corrosion resistance of stainless steel against molten aluminum or
aluminum alloy using long-term crucible tests were found in the literature search.
      It is obvious that pure steel is unable to withstand even brief contact with molten aluminum [1,2,9].
Liquid aluminum alloy dissolves iron and forms complex phases in the ternary Al-Si-Fe system [3,24,25].
The dissolution of steel is continuously progressing as a function of time and does not omit other
steel elements such as chromium or nickel [4,26–29]. Aluminum alloys also reduce most oxides [4,
30,31]. Therefore, coatings applied on steel are sufficient only for a short period of contact with the
melt [1,13,31,32].
      Conventional refractory materials used for contact with molten aluminum and its alloys in different
kind of furnaces are based on coarse-grained alumina–mullite castables with antiwetting agents to
reduce the infiltration phenomena. The drying and prefiring processes used for the castables are very
time-consuming and can cause internal stresses, leading to cracking and subsequent failure of the
refractory product. Moreover, the thermal shock resistance of such castables is very often insufficient
for the demanding, continuously changing thermal conditions of metallurgical operations [33,34].
      Steel–ceramic composites benefit from the synergy between the steel and the refractory ceramics,
and are characterized by good machinability, higher ductility, and advantageous thermomechanical
properties, leading to better thermal shock resistance. The addition of ceramics to the steel can increase
the corrosion resistance against molten aluminum alloy [35]. Furthermore, multiple studies in the field
of steel–ceramic composites present their ability to be produced in a made-to-order fashion [36–38].
Additionally, their ability to form a reliable protective layer that can not be infiltrated and corroded by
aluminum alloys makes steel–ceramic composites favorable substitutes for conventional refractory
ceramics, especially for applications requiring refractory parts with sophisticated shapes, such as
stirrers and lances. According to Fabrichnaya [39], magnesium oxide in contact with iron oxides forms
complex MgO-FeO solid solutions or spinel structures based on MgFe2 O4 . This study focuses on the
development of steel matrix composites reinforced by MgO and on the investigation of their corrosion
resistance, particularly the contribution of an in situ formation of a passivated mixed oxide layer on
the surface of the steel–MgO composite due to the pre-oxidation.

2. Materials and Methods

2.1. Materials and Manufacturing
     The powder mixture used for manufacturing the composite samples consisted of 60 vol%
gas-atomized 316L-FeCr18Ni10Mo3 stainless steel powder (TLS Technik, Bitterfeld-Wolfen, Germany)
and 40 vol% electrofused MgO < 3 µm, 98% MgO (Refratechnik Steel, Duesseldorf, Germany).
The mixture is further described as “316L–40MgO”. The composition of the steel powder is listed in
Table 1. Table 2 contains the particle size percentiles and true densities of the raw materials.

                                Table 1. Composition of 316L stainless steel powder (in wt %).

           Steel           Fe         Cr       Ni       Si     Mo       Mn       Ti     Nb        S     Al
           316L       Balance         17.6     10.9     0.5    2.66     0.2     0.01    0.01     0.01   0.04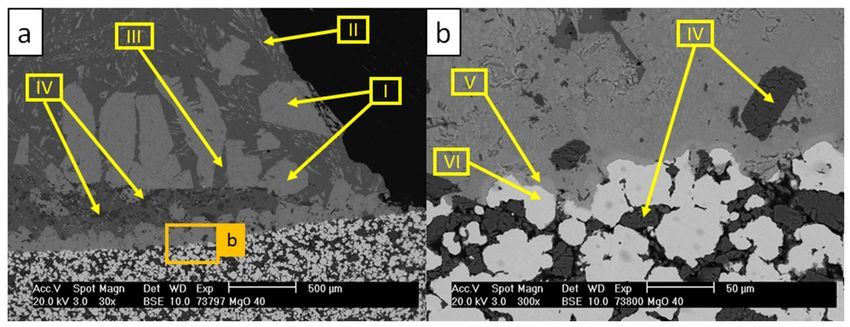
Materials 2020, 13, 4737                                                                                                  3 of 22

                                 Table 2. Particle sizes and densities of the raw materials.

                                                      Particle Size in µm
                 Raw Material                                                             Density in g·cm−3
                                             D10              D50            D90
                      316L                    4               30              53                   7.94
                      MgO                    0.7             14.5             67                   3.60

      Manufacturing of 316L–40MgO steel–ceramic composites requires a homogenous distribution of
both steel and ceramic particles. For this purpose, the powder mixture was dry mixed on a roller mill
for 120 min using 3 mm and 5 mm stainless steel mixing balls. The mass of the added balls was related
to the mass of the powder mixture, which was equal to 21% and 16% for the 5 mm and for the 3 mm
balls, respectively. After sieving out of the mixing balls, the Zusoplast WE52 liquid temporary additive
(Zschimmer and Schwarz, Lahnstein, Germany) and water were stepwisely added to the powder
mixture via granulation, ensuring a proper distribution of the binder and increasing the green body
strength of the samples. The granulation procedure was carried out in two steps, first at 1600 min−1
for 2 min and subsequently at 2500 min−1 for 3 min, with the aid of an Eirich EL1 laboratory mixer
(Maschinenfabrik Gustav Eirich, Hardheim, Germany).
      The prepared composite granulates were pressed into cylindrical samples with the aid of a uniaxial
press (Rucks, Glauchau, Germany). The pressing procedure had a consolidation pressure of 100 MPa
preceded by two air degassing steps (30 MPa and 60 MPa for 1 s). For wettability tests, the samples
with a diameter of 50 mm and height of 7 mm were used. The cylinders used for further preparation of
crucibles had a diameter of 50 mm and a height of 50 mm.
      After uniaxial pressing, all samples were dried in a convection drying oven. The samples used for
wettability tests were dried at 110 ◦ C for 24 h, whereas the cylinders used for preparation of crucibles
were dried in two steps at 40 and 110 ◦ C for 24 h each. After drying, a core bore with a diameter of
ca. 36 mm and a depth of ca. 42 mm was hand drilled to prepare cylindrical crucibles with a wall
thickness of 7–8 mm.
      The binder removal was carried out in a debinding furnace (Xerion, Berlin, Germany) with heating
rates of 2 K·min−1 to 200 ◦ C and 0.5 K·min−1 from 200 to 500 ◦ C, with a holding time of 30 min and
cooling rate of 0.5 K·min−1 . After debinding, the samples were sintered for 2 h at 1350 ◦ C using
a furnace with a graphite lining (Xerion, Berlin, Germany) under argon atmosphere, with heating
and cooling rates of 5 K·min−1 . The mean value of the linear sintering shrinkage was 4% and the
bulk density was 4.76 g·cm−3 . The measurement of the open porosity using an AutoPore V mercury
intrusion porosimeter (Micromeritics, Unterschleißheim, Germany) revealed an open porosity of about
21%.
      The wettability and corrosion resistance investigations were carried out using common
silicon pre-eutectic AlSi7Mg0.3 casting aluminum alloy (TRIMET Aluminum, Essen, Germany).
The as-delivered composition of this aluminum alloy is listed in Table 3.

                            Table 3. Composition of AlSi7Mg0.3 aluminum alloy (in wt %).

            Alloy           Al         Si          Mg      Fe        Cu     Mn       Zn       Ti           Cr      Ni
         AlSi7Mg0.3        92.30      7.17         0.27   0.081     0.002   0.002   0.007    0.12         0.001   0.003

2.2. Pre-Oxidation as a Surface Treatment
     Both the wettability tests and crucible corrosion tests were performed on samples with two
different surface treatments—as-sintered and pre-oxidized. The wettability substrate was pre-oxidized
at 850 ◦ C for 24 h. The steel–MgO composite crucibles for corrosion tests were pre-oxidized at 850 and
1000 ◦ C for 24 h.
     To evaluate suitable pre-oxidation conditions, thermal analyses of 316L–40MgO were performed
using a STA 409 PC calorimeter (Netzsch, Selb, Germany) and a DIL 402 C dilatometer (Netzsch, Selb,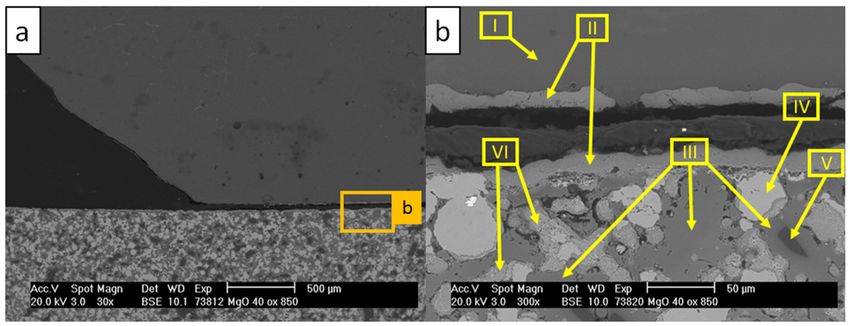
Materials 2020, 13, 4737                                                                                   4 of 22

Germany) under artificial air atmosphere conditions, with a heating rate of 10 K·min−1 up to 1100 ◦ C.
Moreover, to assess the oxidation kinetics, the thermogravimetric and dilatometric measurements were
carried out for 24 h at constant temperatures of 850 and 1000 ◦ C as functions of time.

2.3. Wettability Tests
     As a necessary precondition for the measurement of wetting angles, a defined substrate surface
is required. Therefore, the surfaces of the sintered substrates were stripped of the sintering oxide
layer and polished with sandpapers of different grain sizes down to 8 µm. After polishing, one of the
wettability substrates was pre-oxidized at 850 ◦ C.
     According to Wenzel [15], the equilibrium wetting angle ΘE depends on the roughness of the
substrate surface as follows:
                                                       cos ΘW

                                      ΘE = arccos                                                  (1)
                                                         Sr
where ΘW is the apparent (as-measured) wetting angle and Sr is the developed area ratio
(Sr = Sdr + 1) [40,41]. The linear or surficial roughness and the developed area ratio of the substrates
were determined using a VK/X-1000 laser scanning microscope with a multifile analyzer (Keyence,
Neu-Isenburg, Germany) according to ISO 25178-2-2020 and DIN EN ISO 4287 [40,42].
     Wettability tests were performed using the sessile drop method with a capillary purification
technique in a hot-stage microscope (HSM) (Raczek, Garbsen, Germany). For this purpose, a suitable
capillary purification system was developed (see Figure 1). The capillary system with a pressurizing
plunger was built from sintered, silica-free boron nitride with B2 O3 binder (Henze Boron Nitride
Products, Lauben, Germany). The capillary system was placed on top of the substrate. The aluminum
alloy disc with a height of 3.5 mm and a diameter of 12 mm was put into the capillary chamber.
The wettability tests were performed with a heating and cooling rate of 10 K·min−1 under argon
atmosphere, with an oxygen level below 0.5 ppm. The contact angle was measured 30 s after the drop
release at approximately 630 ◦ C. Afterwards, the wetting angle between the substrate and the sessile
drop was continuously recorded during heating up to 850 ◦ C, with a holding time of 30 min at 850 ◦ C,
followed by cooling. An exemplary drop release process is shown in Figure 1.

      Figure 1. Design of the developed capillary purification system used for wettability tests (left) with
      exemplary images of drop release (right).

    After the wettability tests, the cross-sections of the substrates with solidified aluminum alloy were
analyzed using energy-dispersive X-ray spectroscopy with the XL 30 scanning electron microscope
(SEM/EDS) (Philips, Eindhoven, Germany).

2.4. Crucible Corrosion Tests
     The static crucible corrosion tests were performed in a laboratory furnace (Nabertherm, Bremen,
Germany). For each crucible test, ca. 100 g of aluminum alloy AlSi7Mg0.3 was used. The crucibles with
aluminum were heated up at 10 K·min−1 to 850 ◦ C and held for 168 h (Figure 2). Subsequently,
the samples with aluminum subjected to the corrosion test were vertically cut to analyze the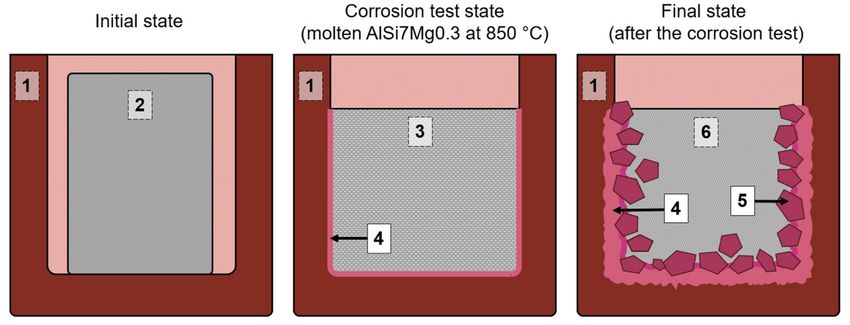
Materials 2020, 13, 4737                                                                                 5 of 22

cross-sections of the steel–ceramic composite, solidified aluminum, and particularly the interface
between the composite and the aluminum alloy.

      Figure 2. Schematic diagram of the crucible corrosion test: (1) crucible made from the steel–MgO
      composite, with an outer diameter of 50 mm; (2) solid aluminum alloy; (3) molten aluminum alloy;
      (4) crucible–aluminum alloy contact interface; (5) corrosion products; (6) solidified aluminum alloy
      after corrosion test.

      The microstructure analysis and the elemental mapping of the solidified aluminum alloy were
carried out by SEM/EDS using the XL 30 (Philips, Eindhoven, Germany) and the ASPEX PSEM eXpress
(FEI, Delmont, PA, USA) scanning electron microscopes.
      X-ray diffraction (XRD) experiments were performed on polished crucible cross-sections with
a Bragg–Brentano geometry and with Cu-Kα radiation between 25◦ and 100◦ 2Θ using the Empyrean
DY1946 XRD diffractometer (Malvern Panalytical, Kassel, Germany). By using a divergence slit
measuring 1/32◦ , only a very narrow area was irradiated (approximately 0.3 mm × 10 mm).
The irradiation area was placed parallel to the composite crucible–aluminum alloy interface. Multiple
scans at a distance of approximately 25 mm from the bottom of the crucible, with increments of 1 mm
starting from the crucible side towards the aluminum alloy, were performed to identify and investigate
the crucible–aluminum interface.
      Phase analysis of the composite crucible was done using Rietveld analysis by applying the
structure models listed in Table 4. For clarity, all XRD-detected phases were indicated based on their
crystal structure. For example, the MgO- and FeO-related solid solutions, which are based on the NaCl
structure, were named halite, instead of periclase and wustite.

      Table 4. Overview of used structure models for the Rietveld refinement of 316L–40MgO/AlSi7Mg0.3
      samples.

             Structure Name          Corresponding Phases             Crystal System          ICSD
                 steel-fcc                   γ-Fe                           cubic             53449
                 steel-bcc            α-Fe solid solution                   cubic             52258
                   halite         MgO, MgO-FeO solid solution               cubic             52026
                corundum                    Cr2 O3                        trigonal            25781
                  spinel             Fe3 O4 solid solution                  cubic             65341

     The phase analysis for the aluminum alloy was performed using electron backscatter diffraction
(EBSD) and SEM/EDS of the XL 30 (Philips, Eindhoven, Germany). Detected precipitations
resulting from the reaction of aluminum alloy with the steel–MgO composite were indexed for
further investigations.
     The composition of the aluminum alloy and the assessment of which included the area fraction
of the precipitated phases, was investigated by the ASPEX PSEM eXpress (FEI, Delmont, PA, USA)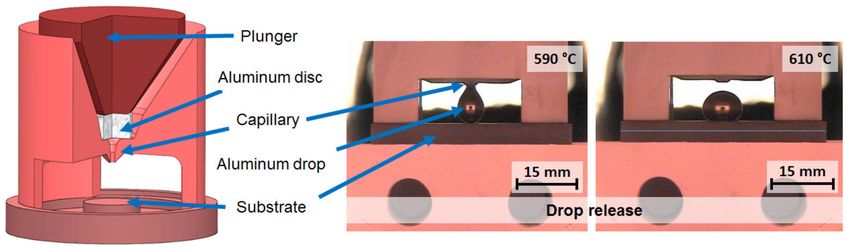
Materials 2020, 13, 4737                                                                                   6 of 22

using automatic feature analysis (AFA). On each sample, a rectangular section with an area of at least
34 mm2 for the aluminum alloy was scanned and automatically divided into square regions of interest
(ROIs) with edge lengths of ca. 111 µm. Corrosion phases were then identified by material contrast
using the ASPEX PSEM back-scatter electron contrast. The detected precipitations were automatically
analyzed by EDS and classified into indexed phases according to the restrictions of the elaborated rule
file presented in Table 5. The quantification of the area fractions of indexed precipitations was based on
the greyscale histogram analysis of 48 ASPEX PSEM/AFA ROIs. The positions of these ROIs within the
solidified aluminum alloy and an exemplary phase classification procedure are schematically shown in
Figure 3.

                      Table 5. Rule file for the classification of precipitations in the AlSi7Mg0.3.

                 Class                                            Restrictions in wt %
            AlSi7Mg0.3                                        Al > 70 AND Fe < 20
              τ6 -AlFeSi               Al > 20 AND Si > 1 AND Fe > 1 AND Cr < 1 AND Mg < 1 AND Ni < 5
           τ5 -Al(Fe,Cr)Si             Al > 20 AND Si > 1 AND Fe > 1 AND Cr > 1 AND Mg < 1 AND Ni < 5
            π-AlSiMgFe                       Al > 20 AND Si > 1 AND Fe > 1 AND Mg > 1 AND Ni < 5
           Ni-rich phases                                            Ni > 5
         Other precipitations                                       Balance

      Figure 3. Schematic layout of regions of interest (ROIs) analyzed with ASPEX PSEM/AFA (left),
      with exemplary classification of detected precipitations within the solidified aluminum alloy (right).

2.5. Sample Designation
     To distinguish between the samples, the investigated samples were designated according to the
type of test and temperature of the surface pre-oxidation. The designations W_0 and W_850 refer to the
wettability samples with as-sintered and 850 ◦ C pre-oxidized surfaces, respectively. The designations
C_0, C_850, and C_1000 refer to crucible samples with as-sintered and with 850 ◦ C and 1000 ◦ C
pre-oxidation surfaces, respectively.

3. Results and Discussion

3.1. Pre-Oxidation
     Pre-oxidation treatment was carried out to induce the formation of a passivation interface layer
with increased corrosion resistance against molten aluminum alloy. The kinetics of the process,
and hence the results of the pre-oxidation, are dependent on the temperature and duration of the
oxidation. During the pre-oxidation, the samples undergo mass, dimensional, and microstructural
changes. Figure 4 shows thermogravimetric and dilatometric results for the steel–MgO composite up
to 1100 ◦ C, with a heating rate of 10 K·min−1 under air atmosphere.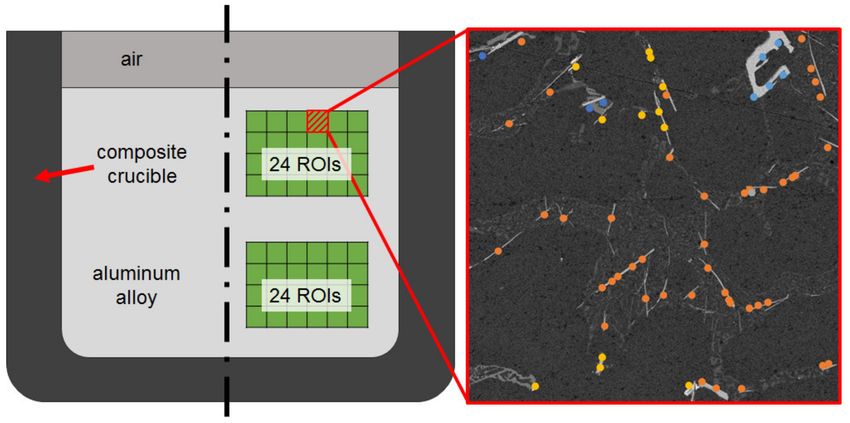
Materials 2020, 13, 4737                                                                              7 of 22

      Figure 4. Thermogravimetry (left) and dilatometry (right) analyses of 316L–40MgO composite under
      air atmosphere as a function of temperature up to 1100 ◦ C.

     The composite showed no mass change up to 700 ◦ C. The intersection point for the tangents
belonging to the two linear sections of the thermogravimetric curve is at 850 ◦ C. At 1000 ◦ C, the sample
already exhibited a mass increase of about 5%. Dilatometry analysis revealed constant thermal
expansion of the composite from 200 ◦ C to 1000 ◦ C, with a linear thermal expansion coefficient of
18 × 10−6 K−1 , i.e., similar to the thermal expansion coefficient of the 316L stainless steel specified in
BS EN 10088-1:2014 [43].
     The long-term oxidation behavior of the composite as a function of time is shown in Figure 5.

      Figure 5. Isothermal thermogravimetry (left) and dilatometry (right) analyses of 316L–40MgO under
      air atmosphere as a function of time up to 24 h.

      The thermogravimetry analysis of the sample held at 850 ◦ C proceeded as expected.
The thermogravimetric curve had a logarithmic shape with rapid mass gain up to the 3rd hour.
Until this time, the sample gained 7% of the initial mass. After 3 h, the mass gain significantly decreased
and over the next 21 h the sample gained an additional 1.5% of the initial mass. The initial oxidation
originated from the surface and continued through the open pores of the composite. Over the entire
time range, the sample gained 8.5% of the initial mass.
      The sample held at 1000 ◦ C performed as expected up to the 10th hour, with a gain of 7% of the
initial mass during the first 53 min of the experiment and exceeding 8.4% at the 10th hour. After this,
the measurement revealed a sudden change of the curve slope, with a higher mass gain of about 0.2%
per hour. This is probably related to the transformation of the surface structure of the composite,
which acquired more oxygen from the atmosphere.
      The dilatometry measurements revealed no unexpected thermal expansion behavior. After the
3rd hour of oxidation, both samples showed nearly linear expansion. The expansion rate of the sample
held at 850 ◦ C was ca. 3.5 × 10⁻³ % × h−1 and after 24 h the sample gained 1.64% of the initial length.
The expansion rate of the sample held at 1000 ◦ C was ca. 23.8 × 10⁻³ % × h−1 and after 24 h the sample
gained 2.63% of the initial length.
Materials 2020, 13, 4737 8 of 22
3.2. Wettability Tests
As substrates with modified surfaces cannot be polished, their roughness needs to be determined
experimentally. The linear and surficial characteristics and the developed area ratios for the W_850
and W_0 substrates are shown in Table 6.
Table 6. Roughness characteristics of 316L–40MgO composite substrates according to ISO 25178-2-2020
and DIN EN ISO 4287 [40,42].
Sample λc Ra Rz Sa Sz Sr
- - µm µm µm µm -
W_0 0.8 1.14 9.06 1.28 57.27 1.063
W_850 2.5 3.56 31.15 3.78 67.62 1.444
As expected, the pre-oxidation of the W_850 substrate resulted in increased roughness of the
surface. The Sr parameter, which is necessary for the calculation of the equilibrium wetting angle,
changed from 1.063 to 1.444. The wetting angles were measured 30 s after the drop release and after
30 min at a temperature of 850 ◦ C. The results of the measurement with the corresponding drop images
acquired during the experiments are shown in Figure 6 and Table 7.
Figure 6. AlSi7Mg0.3 sessile drops on the 316L–40MgO composite substrates: (a) W_0 at the point of
drop release; (b) W_0 after 30 min at 850 ◦ C; (c) W_0 after the test; (d) W_850 after the drop release;
(e) W_850 after 30 min at 850 ◦ C; (f) W_850 after the test.
Table 7. Wetting angles between AlSi7Mg0.3 and the 316L–40MgO composite substrate.
Sample Wetting Angle in ◦
- 30 s after Release after 30 min at 850 ◦ C
- θW θE θW θE
W_0 148.0 142.9 - -
W_850 143.0 123.6 142.0 123.1
The calculated equilibrium wetting angles of as-sintered and pre-oxidized samples show a clear
difference. The wetting angle for W_0 was equal to 142.9◦ , whereas for W_850 was smaller and equal
to 123.6◦ . It is assumed that a higher wetting angle results in reduced corrosion. However, the W_0
drop reacted with the substrate after 30 min at 850 ◦ C. Due to the corrosion reaction, the wetting
angle between the drop and the W_0 substrate could not be measured. The first visible reactions were
observed by the change of the drop shape at 767 ◦ C, i.e., approximately 14 min after the drop release.Materials 2020, 13, 4737 9 of 22
The W_850 sample showed a negligible change in the equilibrium wetting angle after 30 min at 850 ◦ C.
No visible reactions of the drop with the substrate could be observed.
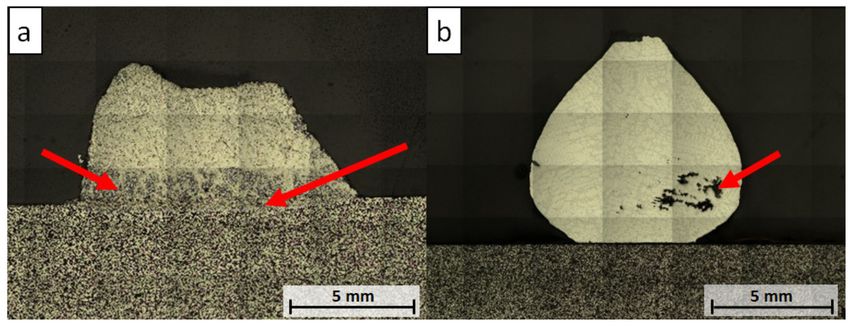
The overview of the samples’ cross-sections after the wettability tests was achieved using laser
scanning microscope (LSM) image assembly and is shown in Figure 7.
Figure 7. LSM image assembly micrographs of samples after wettability tests: (a) W_0; (b) W_850.
The collapsed drop of the W_0 sample revealed vast corrosion, with visible corrosion products
being observed on the polished cross-section with the bare eye. The aluminum melt diffused into the
substrate and dissolved the steel matrix, forming multiple corrosion precipitations (see red arrows,
Figure 7a). For the W_850 sample, no corrosion was detected using LSM. The drop porosity indicated
by the red arrow (Figure 7b) was caused by the proceeding solidification of the aluminum alloy,
which started from the surface of the drop and caused the formation of such cavities.
Figure 8 and Table 8 show the microstructure of the W_0 sample and the corresponding results of
EDS scans, respectively.
Figure 8. SEM micrographs of the W_0 sample after the corrosion test with AlSi7Mg0.3 at 850 ◦ C:
(a) image magnified to 30×; (b) image magnified to 300×.Materials 2020, 13, 4737 10 of 22
Table 8. Results of EDS scans indicated by arrows in Figure 8 (in at %).
Scan O Al Si Fe Cr Ni Mn Mo Mg
I 1.4 70.1 8.6 13.4 5.8 - 0.4 0.3 -
II - 79.9 6.7 8.6 - 4.8 - - -
III - 100 - - - - - - -
IV 53.3 1.0 - - - - - - 45.7
V - 76.4 5.2 13.9 2.7 1.6 0.2 - -
VI - - - 68.6 18.4 10.5 0.8 1.7 -
The micrographs in Figure 8 showed the corroded substrate with dissolved steel particles.
As a consequence of the dissolution of the matrix material, MgO particles diffused into the aluminum
alloy drop (scan IV). Multiple new formed phases were detected in the aluminum alloy. Precipitations
marked with scan I were detected as τ5 -Al(Fe,Cr)Si containing noticeable amounts of Cr [4,44]. A group
of flake-like precipitations from scan II was identified as τ6 -AlFeSi [3,4,45]. Scans V and VI represent
a steel matrix–aluminum alloy interface, where the continuous dissolution of the substrate material
was revealed.
SEM analysis with the corresponding EDS scans of the W_850 sample are shown in Figure 9
and Table 9.
Figure 9. SEM micrographs of W_850 sample after the test with AlSi7Mg0.3 at 850 ◦ C: (a) image
magnified to 30×; (b) image magnified to 300×.
Table 9. Results of EDS scans indicated by arrows in Figure 9 (in at %).
Scan O Al Si Fe Cr Ni Mn Mo Mg
I - 100 - - - - - - -
II 69.0 - - 26.4 - - - - 4.6
III 58.5 - - 11.4 0.2 - 0.6 - 29.3
IV - - - 68.9 18.5 10.2 0.8 1.6 -
V 58.1 - - - - - - - 41.9
VI 52.7 - 0.4 24.0 13.5 4.2 0.7 0.9 3.6
The micrographs revealed no corrosion of the substrate. Scans I and II represent the primary
aluminum from the drop with the oxide residuals from the substrate surface. Under oxidizing
atmosphere in contact with steel (scan IV), the MgO particles on the surface (scan V) transformed into
Mg-Fe-O mixed oxides (scan III). The steel matrix partially oxidized (scans IV and VI). No dissolution
of the oxide surface was observed during the wettability tests. Taking these observations into
consideration, the surface of the 316L–40MgO composite after the 850 ◦ C pre-oxidation can be
described as resistant against the corrosion caused by the brief contact (approximately 30 min) with
the liquid aluminum alloy.Materials 2020, 13, 4737 11 of 22
3.3. Crucible Corrosion Tests
The LSM image assemblies of the cross-sections of tested crucibles are presented in Figure 10.
Figure 10. LSM image assembly micrographs of tested crucibles after 168 h contact with AlSi7Mg0.3
liquid aluminum alloy at 850 ◦ C.
It was expected that the as-sintered composite crucible would dissolute over 168 h of contact with
the liquid AlSi7Mg0.3, as the equivalent wettability substrates corroded and dissolved noticeably after
30 min contact with the alloy drop. Large fractures of the solidified alloy–crucible reaction zone were
observed. During the dissolution of the matrix material, the MgO particles diffused into the melt and
agglomerated in clusters (dark grey area in the melt). It is expected that the melt completely reacted
with the steel and also reacted with the MgO particles, forming the Mg-Al spinel.
The C_850 crucible corroded, dissolving in the aluminum alloy. It is assumed that this proceeded
through both the dissolution and infiltration of the passivated oxide surface. The aluminum melt
infiltrating the crucible reacted with the steel particles, forming new phases under the oxide film.
The new formed phases caused cracking of the passivated surface and facilitated further dissolution of
the crucible.
The C_1000 crucible showed no damage after 168 h contact with the melt. Both the melt and the
crucible remained separated after solidification. A common pre-eutectic micro structure of AlSi7Mg0.3
was observed in the LSM image assembly.
3.4. SEM and XRD Analysis of Composite Crucibles after Corrosion Tests
The microstructure of the composite crucibles after the corrosion test with aluminum alloy
is presented below. The determination of the crucible structure by XRD was performed for the
C_1000 sample.
Figure 11, along with Table 10, present the SEM analysis of the crucible–aluminum alloy interface
of C_0, showing EDS scans of the most prominent phases.Materials 2020, 13, 4737 12 of 22
Figure 11. SEM micrographs of the C_0 composite crucible after the corrosion test with molten
AlSi7Mg0.3 aluminum alloy at 850 ◦ C: (a) image magnified to 30×; (b) image magnified to 300×.
Table 10. Results of EDS scans corresponding to areas indicated by arrows in Figure 11 (in at %).
Scan O Al Si Fe Cr Ni Mn Mo Mg Ti Na Ca
I - - 0.2 65.1 21.9 9.6 2.1 1.1 - - - -
II 35.9 - - 0.4 0.6 0.1 1.2 - 60.6 - 1.2 -
III 39.8 39.7 0.2 0.5 0.2 0.3 0.1 - 18.3 - 0.4 0.5
IV 1.2 60.9 4.1 20.7 6.8 4.8 0.7 0.2 0.5 0.1 - -
Extensive dissolution of the steel matrix into the aluminum alloy was observed in the C_0 sample.
The steel reacted with the aluminum alloy melt, forming large Al-Fe-Si solid solutions with a unified
composition and a relatively high amount of Fe (scan IV). MgO particles reacted with Al residuals and
formed an Al-Mg-O oxide mixture and MgAl2 O4 spinel (scans II and III).
Figure 12 and Table 11 present the SEM/EDS analysis of the C_850 crucible after the corrosion test
at 850 ◦ C.
Figure 12. SEM micrographs of the C_850 composite crucible after the corrosion test with molten
AlSi7Mg0.3 aluminum alloy at 850 ◦ C: (a) image magnified to 30×; (b) image magnified to 500×.Materials 2020, 13, 4737 13 of 22
Table 11. Results of EDS scans corresponding with areas indicated by arrows in Figure 12 (in at %).
Scan O Al Si Fe Cr Ni Mn Mo Mg Na Ca
I 39.0 41.9 0.6 0.1 0.1 0.3 0.1 - 17.4 0.4 0.1
II 53.5 - - - - - - - 46.5 - -
III - - 0.5 68.2 18.3 10.2 1.0 1.8 - - -
IV 65.0 - 0.4 8.2 15.1 1.1 2.7 0.7 7.0 - -
V - 76.1 3.3 16.5 2.2 1.9 - - - - -
VI - 77.7 7.0 12.1 2.3 0.9 - - - - -
Similar to the C_0 sample, the C_850 crucible corroded greatly and its steel particles dissolved in
the melt. The amounts of Fe and Cr in the compositions of the corrosion phases formed with aluminum
(scans V and VI) were lower in comparison to the C_0 crucible (cf. Figure 11, scan IV). The MgO
particles in contact with liquid aluminum underwent a transformation to Al-Mg-O mixed oxides (scans
I and II). As was assumed, the MgO–FeO passivation layer was pushed out from the crucible vicinity
during the corrosion process and was found in the upper part of the melt (Figure 13).
Figure 13. SEM micrograph of the C_850 sample with decomposition of the MgO-FeO solid solution to
MgAl2 O4 and Fe.
The residuals of the MgO-FeO crucible passivation layer reacted with aluminum and formed the
MgAl2 O4 spinel, reducing the Fe. The Fe precipitations could be found in the vicinity of the MgO-FeO
solid solution and MgAl2 O4 . This revealed that the passivation surface of 850 ◦ C pre-oxidized crucibles
did undergo dissolution in contact with the liquid aluminum alloy.
Figure 14 and Table 12 present the SEM/EDS analysis of C_1000 after 168 h contact with the
AlSi7Mg0.3 melt.Materials 2020, 13, 4737 14 of 22
Figure 14. SEM micrographs of the C_1000 composite crucible after the corrosion test with molten
AlSi7Mg0.3 aluminum alloy at 850 ◦ C: (a) image magnified to 30×; (b) image magnified to 300×.
Table 12. Results of EDS scans corresponding with areas indicated by arrows in Figure 14 (in at %).
Scan O Al Si Fe Cr Ni Mn Mo Mg
I 59.1 - - 24.9 - - 0.8 - 15.2
II 0.4 0.2 0.2 75.3 1.1 22.6 - 0.2 -
III 57.0 - - 23.9 0.6 0.8 0.7 - 17.0
IV 57.0 - - 12.7 0.6 0.3 0.3 - 29.1
V 61.5 - - 19.0 10.6 4.5 - - 4.4
No damage of the crucible passivation layer was revealed after 168 h contact with the melt.
Only minor dissolution of the surface was observed, which contributed to the formation of Al-Fe-Si
precipitations in the aluminum alloy in the vicinity of the crucible surface. The crucible revealed
cavities at the crucible–aluminum alloy interface. These cavities, however, were not infiltrated by the
aluminum alloy (scan I). Figure 15 and Table 13 show the diffraction pattern and results of XRD-phase
analysis from the surface of that crucible.Materials 2020, 13, 4737 15 of 22
Figure 15. XRD pattern of the C_1000 crucible surface at the contact interface with aluminum alloy
(detected phases designated based on their crystal structure).
Table 13. Phases detected at the surface of the C_1000 sample (designated based on their
crystal structure).
Sample Structure Name Corresponding Phases Density in g·cm−3 vol% Lattice Parameter
C_1d_1000 halite-1 MgO 3.56 21.1 a = 4.21923 Å
- halite-2 MgO-FeO solid solution 3.54 32.3 a = 4.22753 Å
- halite-3 MgO-FeO solid solution 3.49 15.0 a = 4.24678 Å
- steel-bcc γ-Fe 7.74 16.3 a = 2.88222 Å
- steel-fcc α-Fe solid solution 7.94 2.6 a = 3.60186 Å
- spinel Fe3 O4 solid solution 5.22 6.8 a = 8.38222 Å
- corundum Cr2 O3 5.21 5.9 a = 4.96854 Å
c = 13.59768 Å
Multiple MgO-FeO solid solutions with differing compositions (halite structure, cf. Table 4)
were found and are presented by scans I, III, and IV [46,47]. Three halite structures were found by
XRD. Halite-1 corresponds with the MgO crystals, whereas halite-2 and halite-3 were MgO-FeO solid
solutions with 11 and 25 vol% of FeO, respectively. It is assumed that halite-2 was caused by the
MgO-FeO crystals growing epitaxially from MgO particles (scan IV) and that halite-3 was the MgO-FeO
phase found near the aluminum alloy–crucible interface (scans I and III). The oxidized residuals of
steel particles revealed Cr2 O3 (corundum) and Fe3 O4 (spinel) phases with metallic Ni (scan V) [48,49].
Among oxides, metallic Fe-Ni steel residuals were found (scan II). Only ca. 2.6 vol% of γ-Fe steel was
found by XRD [50,51]. A detailed element mapping of aluminum–crucible contact surfaces collected
over 48 h via ASPEX PSEM is presented in Figure 16.Materials 2020, 13, 4737 16 of 22
Figure 16. Detailed EDS elemental mapping at the aluminum alloy–steel–MgO composite interface of
the C_1000 sample.
No dissolution of the MgO-FeO solid solution passivation layer was observed. The Ni remained
trapped in the Ni-Fe steel residuals and between the Cr2 O3 and Fe3 O4 mixture from oxidized steel
particles. The crucible did not exhibit any damage from the contact with the liquid AlSi7Mg0.3. MgO
particles reacting with steel during pre-oxidation at 1000 ◦ C form a stable, homogenous passivation
layer, which is resistant against long-term and high-temperature molten aluminum alloy corrosion.
3.5. Microstructure Analysis of AlSi7Mg0.3 after Crucible Corrosion Tests
The analysis of the aluminum alloy and the determination of the formed corrosion phases were
performed on the C_1000 sample using SEM/EDS/EBSD and ASPEX PSEM/AFA methods.
The structures of the precipitating corrosion phases differed greatly depending on the distance
from the crucible wall. Figures 17 and 18 and Tables 14 and 15 present the corrosion phases precipitated
in the aluminum alloy at the contact boundary with the crucible.
Figure 17. SEM micrographs revealing fishbone-like precipitations in AlSi7Mg0.3 close to the C_1000
interface: (a) image magnified to 30×; (b) image magnified to 100×.Materials 2020, 13, 4737 17 of 22
Figure 18. SEM micrographs revealing Si and Ni precipitations in AlSi7Mg0.3 in the vicinity of
fishbone-like phases of C_1000: (a) image magnified to 100×; (b) image magnified to 300×.
Table 14. Results of EDS scans corresponding with areas indicated by arrows in Figure 17 (in at %).
Scan Mg Al Si Cr Fe Ni
I - 75.9 10.8 3.5 9.8 -
II 0.4 68.9 12.1 0.3 17.8 0.5
Table 15. Results of EDS scans corresponding with areas indicated by arrows in Figure 18 (in at %).
Scan Mg Al Si Fe Ni
I - 4.5 95.5 - -
II 1.4 79.7 12.4 - 6.5
III 23.1 45.7 26.3 2.1 2.9
IV 6.5 57.6 15.7 - 20.2
At the vicinity of the crucible wall, the fishbone-like precipitations (Figure 17, scan I) were revealed.
These were indicated by EBSD as τ5 -Al(Fe,Cr)Si phases based on the Al-Fe-Si ternary system [44].
The τ6 -AlFeSi were found between the fishbone-like precipitations (Figure 17, scan II) [45]. In the
vicinity of τ5 , the Si- and Ni-rich precipitations (Figure 18, scans I and II, IV) and some π-AlSiMgFe
phases were found (Figure 18, scan III) [24,52,53]. The indicated EBSD patterns of the indicated τ5 , τ6 ,
and π phases are presented in Figure 19.
Figure 19. EBSD patterns of τ5 -Al(Fe,Cr)Si and τ6 -AlFeSi phases detected in the aluminum alloy of the
C_1000 sample.
Figure 20 and Table 16 present the SEM/EDS results of the internal structure of the aluminum
alloy collected at 1 mm distance from the interface of the C_1000 sample.Materials 2020, 13, 4737 18 of 22
Figure 20. SEM micrographs revealing the AlSi7Mg0.3 microstructure at 1 mm distance from the
C_1000 interface: (a) image magnified to 30×; (b) image magnified to 100×.
Table 16. Results of EDS scans corresponding with areas indicated by arrows in Figure 20 (in at %).
Scan Mg Al Si Fe
I 0.9 97.1 2.0 -
II - 69.1 17.9 13.0
EDS and EBSD scans revealed the presence of multiple long (over 500 µm) τ6 precipitations,
which were formed among the Al-Si eutectic (scan II). Scan I presents primary Al, which did not
undergo any composition change. Moreover, no τ5 or other corrosion phases with higher amounts of
Fe or Cr were found beyond 1 mm distance from the composite crucible.
The composition of the aluminum alloy of the C_1000 sample was analyzed by collective EDS
scanning of the solidified aluminum alloy. In Table 17, the results of the scan and the initial AlSi7Mg0.3
composition are listed.
Table 17. Composition of AlSi7Mg0.3 as delivered and after corrosion tests with C_1000 (in wt %).
Aluminum Alloy Al Si Mg Fe Cu Mn Zn Ti Cr Ni
as delivered 92.30 7.17 0.27 0.081 0.002 0.002 0.007 0.12 0.001 0.003
after corrosion test with C_1000 89.63 6.55 0.70 0.77 - 0.08 - 0.10 0.20 0.30
The amounts of steel- and MgO-related elements increased in relation to the total composition
of the aluminum alloy by 0.5 wt %. The Fe amount increased by 0.7 wt %. The Ni and Cr amounts
increased by 0.3 wt % and 0.2 wt %, respectively. It should be mentioned that the surface-area-to
volume ratio (sa/vol) plays an important role in aluminum alloy composition changes. In the presented
crucible corrosion tests, the aluminum–crucible contact surface area was roughly 51 cm2 , whereas
the volume of aluminum placed in the crucible was approximately 36 cm3 . This gives a very high
sa/vol ratio of about 1.42. In industrial environments, the casting furnaces are much larger, with an
exemplary sa/vol ratio for the 1 m3 aluminum alloy equal to 0.05, which is 28.4 times smaller than the
sa/vol ratio of the presented crucible corrosion experiment. It is obvious that the sa/vol ratio influences
the density of the precipitating corrosion-related phases. For crucibles with industrial dimensions,
the change of the alloy composition would be negligibly small.
The total number of corrosion-related phases precipitated in the aluminum alloy was calculated
using ASPEX PSEM/AFA and is shown in Table 18.Materials 2020, 13, 4737 19 of 22
Table 18. Area fraction and proportion of corrosion-related phases precipitated in AlSi7Mg0.3.
Area Fraction of Precipitated Corrosion-Related Phases (in %)
Sample
Precipitations (in %) τ6 -AlSiFe τ5 -Al(Fe,Cr)Fe π-AlSiMgFe Ni-rich others
C_1000 2.77 33.6 55.5 3.9 5.9 1.1
The C_1000 sample had a total precipitation area fraction of 2.77%, which consisted mostly of
fishbone-like τ5 -Al(Fe,Cr)Si phases precipitated in the vicinity of the melt–crucible interface and
τ6 -AlFeSi phases in the middle of the melt. The sample exhibited 55.5% of τ5 -Al(Fe,Cr)Si and 33.6% of
τ6 -AlFeSi phases. Additionally, 3.9% of π-AlSiMgFe and 5.9% of Ni-rich phases were found. Only 1.1%
of all detected corrosion-related phases remained unclassified. The τ5 phases contained Cr in their
structure. No Cr was found in the structures of the τ6 and π phases. The increased amounts of Cr
and Ni in the solidified aluminum alloy indicate that the corrosion of the C_1000 crucible proceeded
through dissolution of oxidized steel particles, which consisted of Cr2 O3 , Fe3 O4 , and metallic Ni-rich
steel residuals. The low content of Mg-related π-AlSiMgFe phases is correlated with the stability of
the MgO-FeO solid solution of that crucible, which did not dissolve over 168 h in contact with the
melt. It can be stated that the corrosion of the C_1000 crucible proceeds through the dissolution of
the oxidized residuals of steel particles from the vicinity of the composite–aluminum alloy interface.
The diffusion of these oxides with trapped metallic Ni forms cavities in the crucible at the contact
interface with the aluminum alloy (cf. Figure 14). No dissolution of the MgO-FeO solid solution at the
crucible surface was observed for this sample. It is reasonable to presume that after the dissolution
of the mentioned oxidized steel particles, the composite does not dissolve further and remains fully
resistant against liquid aluminum alloy.
4. Conclusions
A novel 316L stainless steel + 40 vol% MgO (316L–40MgO) metal matrix composite was successfully
developed and manufactured by means of powder metallurgy technology. The corrosion resistance of
the composite against molten AlSi7Mg0.3 aluminum alloy at a temperature of 850 ◦ C was evaluated.
The investigation of the composite surface preparation revealed the favorable influence of the surface
pre-oxidation on the corrosion resistance of the composite. The pre-oxidation causes the reaction
between iron and MgO, forming MgO-FeO solid solutions, which are stable in contact with the
AlSi7Mg0.3 melt.
It was revealed that the composites without surface oxidation were not corrosion-resistant in
contact with the aluminum alloy melt and corroded rapidly. The corrosion was already observed
after 814 min contact with the aluminum alloy drop during the wettability tests. The corrosion of the
316L–40MgO composite occurs mainly through the dissolution of steel particles forming corrosion
phases from ternary Al-(Fe,Cr)-Si and quaternary Al-Si-Mg-Fe systems. Additionally, the MgO
particles are not stable when in long-term contact with the liquid aluminum alloy and react to form
a MgAl2 O4 spinel.
The composite with its surface oxidized at 850 ◦ C for 24 h exhibited short-term corrosion resistance
against aluminum alloy, which could be observed during the wettability tests. Longer contact
time with the aluminum alloy melt causes infiltration and damage of the passivation layer of the
composite material.
Promising results were achieved for the composite with the surface pre-oxidized at 1000 ◦ C for
24 h. This composite material did not reveal any damage after 168 h contact with the aluminum
alloy melt. Partial dissolution of the oxidized steel particles at the interface with the liquid aluminum
alloy was detected. These oxides, consisting of Cr2 O3 , Fe3 O4 , and Ni-Fe steel residuals, caused the
precipitation of τ5 -Al(Fe,Cr)Si, τ6 -AlFeSi, π-AlSiMgFe, and local Ni-rich phases in the aluminum alloy.
Nevertheless, the aluminum alloy composition revealed only minor changes and the area fraction of
the precipitated phases was only 2.77%. Negligible dissolution of the MgO-FeO solid solution from
the composite–aluminum alloy contact interface resulted in the precipitation of π-AlSiMgFe phases.Materials 2020, 13, 4737 20 of 22
It can be assumed that after initial dissolution, the 316L–40MgO composite remains fully resistant to
the liquid aluminum alloy.
Author Contributions: Conceptualization, P.M., T.Z., and C.G.A.; methodology, P.M., T.Z., F.K., and C.W.;
validation, P.M., T.Z., F.K., and C.G.A.; investigation, P.M., T.Z., F.K., C.W., S.-O.S., and H.S.; resources, T.Z.,
C.W., S.-O.S., H.S., and C.G.A.; writing—original draft preparation, P.M.; writing—review and editing, P.M., F.K.,
and C.G.A.; supervision, C.G.A.; project administration, C.W.; funding acquisition, C.G.A. All authors have read
and agreed to the published version of the manuscript.
Funding: The authors gratefully acknowledge the financial support of the Federal Ministry for Economic Affairs
and Energy (BMWi) for funding the research project ALUVERBUND (project number: 03ET1393B), under which
the corrosion tests were carried out; and project HYMETAL (project number: 03EN2022B), under which the
SEM/EBSD and ASPEX investigations were performed. Moreover, the XRD analysis was financially supported by
the German Research Foundation (DFG) within the framework of the “Major Research Instrumentation” funding
program (reference number: INST 267/157-1 FUGG; project number: 395259190).
Acknowledgments: The authors would like to thank C. Ludewig for the sample preparation, G. Schmidt for
the SEM investigations, N. Brachhold for SEM/EBSD phase analysis, and J. Hubalkova for in-depth discussion
and review.
Conflicts of Interest: The authors declare no conflict of interest.
References
1. Zhang, X.-m.; Chen, W.-p. Review on corrosion-wear resistance performance of materials in molten aluminum
and its alloys. Trans. Nonferrous Met. Soc. China 2015, 25, 1715–1731. [CrossRef]
2. Balloy, D.; Tissier, J.C.; Giorgi, M.L.; Briant, M. Corrosion mechanisms of steel and cast iron by molten
aluminium. Metall Mater. Trans. A Phys. Met. Mater. Sci. 2010, 41, 2366–2376. [CrossRef]
3. Zienert, T.; Fabrichnaya, O. Experimental investigation and thermodynamic assessment of the Al-Fe system.
J. Alloy. Compd. 2018, 743, 795–811. [CrossRef]
4. Malczyk, P.; Weigelt, C.; Zienert, T.; Brachhold, N.; Sauke, S.-O.; Semrau, H.; Aneziris, C. Investigation of
interfacial phase formation during corrosion of stainless steel. Interceram Int. Ceram. Rev. 2020, 69, 42–51.
[CrossRef]
5. Barbier, F.; Manuelli, D.; Bouché, K. Characterization of aluminide coatings formed on 1.4914 and 316l steels
by hot-dipping in molten aluminium. Scr. Mater. 1997, 36, 425–431. [CrossRef]
6. Zhan, Z.; Liu, Z.; Liu, J.; Li, L.; Li, Z.; Liao, P. Microstructure and high temperature corrosion behaviors of
aluminide coatings by low-temperature pack aluminizing process. Appl. Surf. Sci. 2010, 256, 3874–3879.
[CrossRef]
7. Wang, D.; Shi, Z. Aluminizing and oxidation treatment of 1cr18ni9 stainless steel. Appl. Surf. Sci. 2004,
227, 255–260. [CrossRef]
8. Frutos, E.; González-Carrasco, J.; Capdevila, C.; Jiménez, J.; Houbaert, Y. Development of hard intermetallic
coatings on austenitic stainless steel by hot dipping in an Al-Si alloy. Surf. Coat. Technol. 2009, 203, 2916–2920.
[CrossRef]
9. Sundqvist, M.; Hogmark, S. Effects of liquid aluminium on hot-work tool steel. Tribol. Int. 1993, 26, 129–134.
[CrossRef]
10. Sobczak, N.; Singh, M.; Asthana, R. High-temperature wettability measurements in metal/ceramic systems –
some methodological issues. Curr. Opin. Solid State Mater. Sci. 2005, 9, 241–253. [CrossRef]
11. Shi, L.-X.; Shen, P.; Zhang, D.; Jiang, Q.-C. Wetting and evaporation behaviors of molten Mg-Al alloy drops
on partially oxidized α-SiC substrates. Mater. Chem. Phys. 2011, 130, 1125–1133. [CrossRef]
12. Sobczak, N.; Kudyba, A.; Siewiorek, A.; Homa, M.; Nowak, R.; Bruzda, G.; Sobczak, J.; Turalska, P.;
Tchorz, A.; Andrzej, G.; et al. Textile Reinforced Carbon Fibre/Aluminium Matrix Composites for Lightweight
Applications, Gude, M., Boczkowska, A., Eds.; Foundry Research Institute: Cracow, Poland, 2014; pp. 77–137.
ISBN 978-83-88770-97-5.
13. Shen, P.; Nose, M.; Fujii, H.; Nogi, K. Wettability of TiAlN fims by molten aluminium. Thin Solid Films 2006,
515, 2009–2014. [CrossRef]
14. Eustathopoulos, N.; Voytovych, R. The role of reactivity in wetting by liquid metals: A review. J. Mater. Sci.
2016, 51, 425–437. [CrossRef]
15. Wenzel, R.N. Resistance of solid surfaces to wetting by water. Ind. Eng. Chem. 1936, 28, 988–994. [CrossRef]Materials 2020, 13, 4737 21 of 22
16. Song, X.; Bian, X.; Zhang, J.; Zhang, J. Temperature-dependent viscosities of eutectic Al-Si alloys modified
with Sr and P. J. Alloy. Compd. 2009, 479, 670–673. [CrossRef]
17. Ferreira, I.; de Castro, J.; Garcia, A. Dependence of Surface Tension and Viscosity on Temperature in Multicomponent
Alloys, Wettability and Interfacial Phenomena–Implications for Material Processing. Khanna, R. Ed.; IntechOpen
Limited: London, UK, 2019; ISBN 978-1-83880-539-5. [CrossRef]
18. Battezzati, L.; Greer, A. The viscosity of liquid-metals and alloys. Acta Metall. 1989, 37, 1791–1802. [CrossRef]
19. Wang, Z.; Maotsela, T.; Toperesu, P.M.; Kale, G.M.; Daji, J.; Parkinson, D. Dynamic and static corrosion
of alpha-alumina bonded refractory in contact with molten soda-lime-silica (sls) glass. Ceram. Int. 2019,
45, 725–732. [CrossRef]
20. Chen, G.; Wang, J.; Fan, H.; Wang, D.; Li, X.; Dong, H. Combat molten aluminum corrosion of AISI H13 steel
by low-temperature liquid nitrocarburizing. J. Alloy. Compd. 2019, 776, 702–711. [CrossRef]
21. Aksel, C. The microstructural features of an alumina-mullite-zirconia refractory material corroded by molten
glass. Ceram. Int. 2003, 29, 305–309. [CrossRef]
22. Wang, W.; Xue, L.; Zhang, T.; Zhou, L.; Chen, J.; Pan, Z. Thermodynamic corrosion behavior of Al2 O3 ,
ZrO2 and MgO refractories in contact with high basicity refining slag. Ceram. Int. 2019, 45, 20664–20673.
[CrossRef]
23. Sellers, R.S.; Cheng, W.-J.; Kelleher, B.C.; Anderson, M.H.; Sridharan, K.; Wang, C.-J.; Allen, T.R. Corrosion of
316L stainless steel alloy and hastelloy-n superalloy in molten eutectic LiF-NaF-KF salt and interaction with
graphite. Nucl. Technol. 2014, 188, 192–199. [CrossRef]
24. Zienert, T.; Fabrichnaya, O. Phase relations in the A356 alloy: Experimental study and thermodynamic
calculations. Adv. Eng. Mater. 2013, 15, 1244–1250. [CrossRef]
25. Becker, H.; Bergh, T.; Vullum, P.E.; Leineweber, A.; Li, Y. β-and δ-Al-Fe-Si intermetallic phase, their intergrowth
and polytype formation. J. Alloy. Compd. 2019, 780, 917–929. [CrossRef]
26. Cheng, W.-J.; Wang, C.-J. EBSD study of crystallographic identification of Fe-Al-Si intermetallic phases in
Al-Si coating on Cr-Mo steel. Appl. Surf. Sci. 2011, 257, 4637–4642. [CrossRef]
27. Barmak, K.; Dybkov, V. Interaction of iron-chromium alloys containing 10 and 25 mass% chromium with
liquid aluminium, part I: Dissolution kinetics. J. Mater. Sci. 2003, 38, 3249–3255. [CrossRef]
28. Barmak, K.; Dybkov, V. Interaction of iron-chromium alloys containing 10 and 25 mass% chromium with
liquid aluminium, part II formation of intermetallic compounds. J. Mater. Sci. 2003, 39, 4219–4230. [CrossRef]
29. Dybkov, V. Interaction of 18Cr-10Ni stainless steel with liquid aluminium. J. Mater. Sci. 1990, 25, 3615–3633.
[CrossRef]
30. Stratton, P. Ellingham diagrams-their use and misuse. Int. Heat Treat. Surf. Eng. 2013, 7, 70–73. [CrossRef]
31. Molinari, A.; Pellizzari, M.; Straffelini, G.; Pirovano, M. Corrosion behaviour of a surface-treated AISI H11
hot work tool steel in molten aluminium alloy. Surf. Coat. Technol. 2000, 126, 31–38. [CrossRef]
32. Ramos-Masana, A.; Colominas, C. Evaluation of DC-MS and HiPIMS TiB2 and TaN coatings as diffusion
barriers against molten aluminum: An insight into the wetting mechanism. Surf. Coat. Technol. 2019,
375, 171–181. [CrossRef]
33. Aneziris, C.G.; Dudczig, S.; Gerlach, N.; Berek, H.; Veres, D. Thermal Shock Performance of Fine Grained
Al2 O3 Ceramics With TiO2 and ZrO2 Additions for Refractory Applications. Adv. Eng. Mater. 2010,
12, 478–485. [CrossRef]
34. Fruhstorfer, J.; Schafföner, S.; Werner, J.; Wetzig, T.; Schöttler, L.; Aneziris, C.G. Thermal Shock Performance
of Refractories for Application in Steel Ingot Casting. J. Ceram. Sci. Technol. 2016, 7, 173–182. [CrossRef]
35. Weigelt, C.; Brachhold, N.; Eckner, R.; Krüger, L.; Hauser, M.; Sauke, S.; Semrau, H.; Aneziris, C.G.
Metal-Matrix Materials for High-Temperature Applications with Liquid Aluminum. Adv. Eng. Mater. 2020,
22, 1–11. [CrossRef]
36. Chong, J.Y.; Wang, B.; Li, K. High performance stainless steel-ceramic composite hollow fibres for
microfiltration. J. Membr. Sci. 2017, 541, 425–433. [CrossRef]
37. Misra, D.; Barange, S.; Joardar, H.; Kumar, J.; Das, A.K.; Mukhopadhyay, S.; Chatterjee, S. Comparative study
on the tribological properties of laser post-treated and untreated AISI304 stainless steel matrix composite
reinforced with hard ceramic particles (TiB2 _TiN_SiC) and prepared by ex-situ p/m route. Ceram. Int. 2019,
45, 18852–18864. [CrossRef]Materials 2020, 13, 4737 22 of 22
38. Weigelt, C.; Schmidt, G.; Aneziris, C.; Eckner, R.; Ehinger, D.; Krüger, L.; Ullrich, C.; Rafaja, D. Compressive
and tensile deformation behaviour of trip steel-matrix composite materials with reinforcing additions of
zirconia and/or aluminium titanate. J. Alloy. Compd. 2017, 695, 9–20. [CrossRef]
39. Fabrichnaya, O. The assessment of thermodynamic parameters for solid phases in the Fe-Mg-O and
Fe-Mg-Si-O systems. Calphad 1998, 22, 85–125. [CrossRef]
40. ISO 25178-2-2020. Geometrical Product Specifications (GPS)–Surface Texture: Areal–Part 2: Terms, Definitions and
Surface Texture Parameters; Beuth Verlag: Berlin, Germany, 2020.
41. Zienert, T.; Dudczig, S.; Malczyk, P.; Brachhold, N.; Aneziris, C.G. Characterization of the In Situ-Formed
Oxide Layer at the Steel Melt/Carbon-Bonded Alumina Interface. Adv. Eng. Mater. 2020, 22, 1–11. [CrossRef]
42. DIN EN ISO 4287:2010-07. Geometrical Product Specifications (GPS)–Surface Texture: Profile Method–Terms,
Definitions and Surface Texture Parameters; Beuth Verlag: Berlin, Germany, 2010.
43. DIN EN 10088-1:2014-12. Stainless Steels–Part 1: List of Stainless Steels, Appendix, E; Beuth Verlag: Berlin,
Germany, 2014.
44. Roger, J.; Bosselet, F.; Viala, J.C. Structural chemistry and thermal stability of the ternary compound
alpha–AlFeSi. J. Solid State Chem. 2011, 184, 1120–1128. [CrossRef]
45. Hansen, V.; Hauback, B.C.; Sundberg, M.; Romming, C.; Gjonnes, J. β-Al4.5FeSi: A combined synchrotron
powder diffraction, electron diffraction, high resolution electron microscopy and single-crystal X-ray
diffraction study of a faulted structure. Acta Crystallogr. B 1998, 54, 351–357. [CrossRef]
46. Tsirelson, V.G.; Avilov, A.S.; Abramov, Y.A.; Belokoneva, E.L.; Kitaneh, R.; Feil, D. X-ray and electron
diffraction study of MgO. Acta Crystallogr. B 1998, 54, 8–17. [CrossRef]
47. Jette, E.R.; Foote, F. An x-ray study of the wüstite (feo) solid solutions. J. Chem. Phys. 1933, 1, 29–36.
[CrossRef]
48. Newnham, R.E.; de Haan, Y.M. Refinement of the α Al2 O3 , Ti2 O3 , V2 O3 and Cr2 O3 structures. Z. Kristallogr.
Cryst. Mater. 1962, 117, 235–237. [CrossRef]
49. Fleet, E. The structure of magnetite: Symmetry of cubic spinels. J. Solid State Chem. 1986, 1, 75–82. [CrossRef]
50. Straumanis, M.E.; Kim, D.C. Lattice constants, thermal expansion coefficients, densities, and perfection of
structure of pure iron and of iron loaded with hydrogen. Z. Met. 1969, 60, 272–277. [CrossRef]
51. Owen, E.A.; Yates, E.L. Precision measurements of crystal parameters. Philos. Mag. 1933, 15, 472–488.
[CrossRef]
52. Foss, S.; Olsen, A.; Simensen, C.J.; Tafto, J. Determination of the crystal structure of the π-(AlFeMgSi) phase
using symmetry- and site-sensitive electron microscope techniques. Acta Crystallogr. B 2003, 59, 36–42.
[CrossRef] [PubMed]
53. Raghavan, V. Al-Fe-Mg-Si (aluminum-iron-magnesium-silicon). J. Phase Equilibria Diffus. 2007, 28, 213–214.
[CrossRef]
Publisher’s Note: MDPI stays neutral with regard to jurisdictional claims in published maps and institutional
affiliations.
© 2020 by the authors. Licensee MDPI, Basel, Switzerland. This article is an open access
article distributed under the terms and conditions of the Creative Commons Attribution
(CC BY) license (http://creativecommons.org/licenses/by/4.0/).You can also read