Corporate Presentation April 2021 - Leucrotta ...
←
→
Page content transcription
If your browser does not render page correctly, please read the page content below
Corporate Presentation
 April 2021

TSXV:LXE
Investor Highlights
Pure-play Montney growth story with 10-
fold estimated growth over 5-year period
(
Production & Milestones
                                                      94 Montney wells drilled to meet production targets

                                                                                                               Concurrent Pad
                                                                                                                                                35,000
                                                                                                                development
                           300,000                                                                               and facility
                                                                                                                 expansions
                                                                                                                                                30,000

                           250,000                          Mica Oil Battery
                                                              constructed
                                                            with 60 mmcf/d                                                                      25,000
                                                             gas handling            Pads II and III
Raw Gas Capacity (mcf/d)

                           200,000                                                    onstream

                                                                                                                                                         Production (boe/d)
                                                                                                                                                20,000

                           150,000                First LXE Pad
                                                        on                                                                                      15,000
                                                   production

                           100,000
                                 $57 million                                                                                                    10,000
                                cash, no debt
                                                                                                                                LNG Canada
                                                                                                                                 projected
                            50,000                                                                                               on-stream      5,000
                                                                                                                                   date

                                0                                                                                                               0
                                                                                    5yr Development
                                      Project Start                                                                                    Year 5
                                                                           Oil & Liquids         Natural Gas

                                                                                                3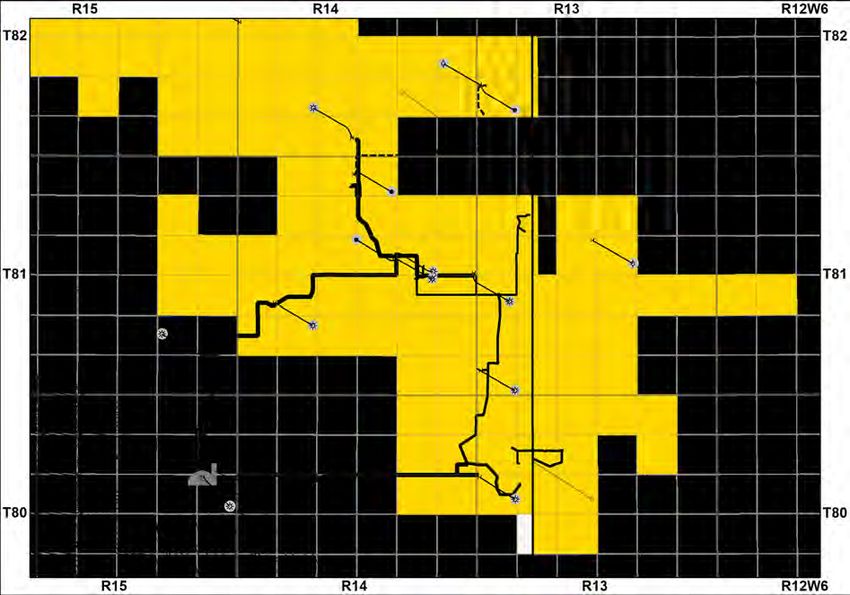
Mica Project
• Transition to Pads with longer
wells and increased frac
intensity
• Construction of Battery and
Gas Handling Facility
• Stacked Pad development
• 94 Montney wells drilled over
5-year period
Upper Stacked
30m
Montney Development
Middle Future
130m
Montney Potential
325m
Test Pad &
Lower
55m
Stacked
Montney
Development
2021 Test Pad 2022 Expected
Basal Stacked
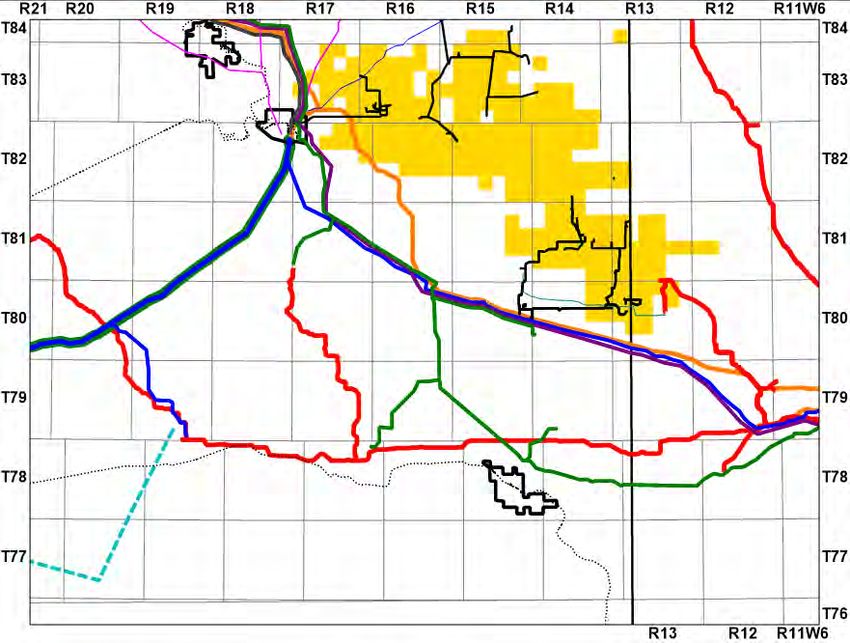
LXE Pipelines LXE Gas Plant NorthRiver Gas Plant
Montney Development
110m
4
Advanced Technology in Pad Development

       Mica Delineation (2014-18)

•   Focus on cost control & proving resource
•   1500 metre laterals
•   28-41 fracs
•   1.1 – 1.3 tonnes of sand/metre
                                               Mica Pad Development (2021+)

                                    •   Focus on maximizing production & returns
                                    •   2400 metre laterals
                                    •   130-200 fracs
                                    •   2.5 tonnes of sand/metre

                                            5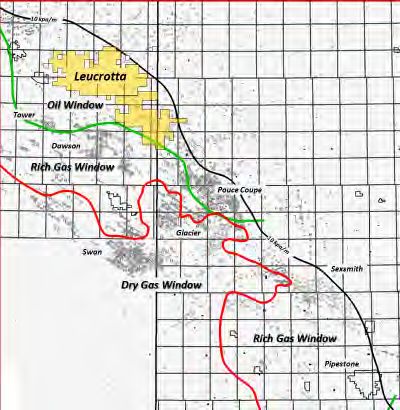
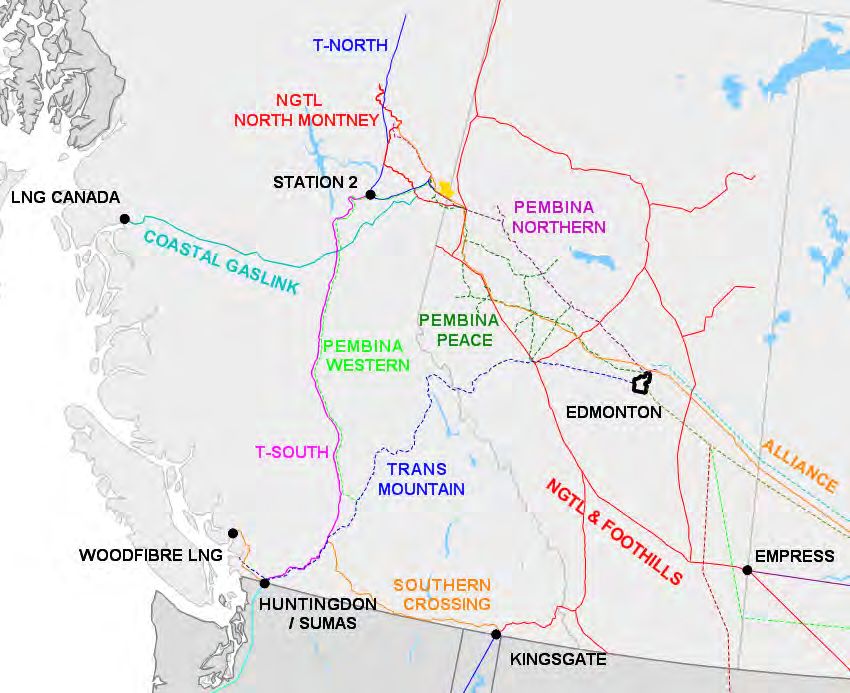
Multiple Takeaway Options
Access to multiple gas
pipelines (NGTL, Westcoast,
Alliance)
Access to Oil & NGL
pipelines (Pembina) or
Oil & NGL
trucked to other markets Pipeline
Access Multiple Gas
Pipelines
West
South
West East
East
LXE Pipelines LXE Gas Plant NGTL Alliance Westcoast
Pembina HVP Pembina LVP TransCanada Coastal GasLink
6
Commodities & Marketing
Current (shallow cut plant)                                   Future (deep cut plant)

                          NGL 3%
                                   Oil & Condensate                          NGL 18%
                                          25%
        Gas 72%                                                                 Oil & Condensate
                                                                 Gas 59%
                                                                                       23%

                                                      • Gas       Alliance   Chicago/ATP

• Gas      Alliance                Chicago            • Gas       NGTL       AECO/LNG/Dawn

• Oil   Truck & Pembina             Edmonton          • Gas      Westcoast   Station 2/Sumas

                                                      • Oil       Pembina     Edmonton
• NGL   Truck & Pembina            Edmonton
                                                      • NGL       Pembina    Edmonton

                                                      • NGL        Rail       Asia (via tidewater)

                                                          7
Capitalized for Growth

• Net Cash and Working Capital                         $57.5 million

• Basic Shares Outstanding(1)                          245.7 million

• Share Price                                          $0.70

• Market Capitalization(1)                             $172.0 million

• Enterprise Value                                     $114.5 million

(1) Options and warrants total 40.3 million with an average exercise price of $0.94 excluded from market capitalization

                                                                     8
2021 Spending Profile
   Capital expenditures will be focused primarily on drilling and completions.

                                                        Facilities & Pipelines
                                                               $3.3MM
                                                                        Equip & Tie $3.3MM

                   Drilling & Completions $23.4MM

$30.0 million in total capital expenditures will be spent primarily in Q3/Q4 2021.

                                                    9
ESG
Pure-play Montney Growth Company
Entrepreneurial Culture Director independence,
committed to safety and 78%; ESG Board
community; Employee Committee in place for
ownership & stakeholder Q2 2021
engagement
GHG emissions below Excellent safety track
reportable threshold of record, no lost time
10,000 tonnes per year; incidents; Works closely
Recent plant efficiencies with WorkSafeBC and BC
to reduce CO2 output; Oil and Gas to meet and
Water recovery and exceed best practices in
recycling program in place EH&S
10Why Leucrotta?
GROWTH
Multiple horizons delineated and major infrastructure in place to kick off the
development
RESOURCE
In excess of 17 billion bbls of oil and 17 TCF of liquids rich gas in place(1)
HIGH MARGIN
Low capital and operating costs combined with high value products
EGRESS & MARKETS
Multiple oil and gas takeaway options allow access to many markets including
Asia
(1) Original Oil in Place (OOIP) and Original Gas in Place (OGIP). Equivalent to TPIIP. See Advisories for details.
11APPENDIX
12Montney Well Type Curve
NR Shallow
Deep Cut (2)
Cut (1)
Near Term Long Term
Performance Indicator (2400m) (2400m)
Drill & Case ($K) 1,900 1,500
Complete ($K) 3,200 2,700
Tie-in ($K) 500 500
Total ($K) 5,600 4,700
Year 1 Avg Q (boe/d)
Oil/C5+ 188 (27%) 197 (25%)
C3/C4 19 131
Gas 478 457
2400m Total 685 785
1500m EUR (mboe)
Oil/C5+ 281 (24%) 299 (22%)
C3/C4 35 237
Gas 864 827
Total 1180 1362
NPV10 ($K) 4,701 8,700
PV10 ($K) 10,301 13,400
IRR (%) 49 135
Payout (yrs) 1.9 1.0
F&D ($/boe) 4.75 3.45
Cap. Eff. Q-12mo. ($/boe/d) 8,175 5,990
Economics based on a Jan 2021 start date using Flat price forecast ($US 50.00/bbl WTI; $2.25/GJ AECO; FX 1.28).
(1) Economics are half-cycle assuming near term development through the North River shallow cut gas plant (12 bbl/mmscf C3+ liquid recovery)
(2) Economics are half-cycle assuming large scale development through a deep cut gas plant (52 bbl/mmscf C3+ liquid recovery)
13Mica Development Cash Flow
Mica Montney Cumulative Cash (undiscounted) - Development Case
1,000
Program Cash Flow
$1.6 billion
800
Program Capex
$543 million for 94 wells
600
M$
400
200
0
Max Cash Deficit of $112 million (funded by $57
million cash on hand and $55 million debt)
-200
Jul-21
Jul-22
Jul-23
Jul-24
Jul-25
Jul-26
Jul-27
Jul-28
Jul-29
Jul-30
Jan-21
Jan-22
Jan-23
Jan-24
Jan-25
Jan-26
Jan-27
Jan-28
Jan-29
Jan-30
Cumulative Capex Cumulative Cash Flow Max Cash Deficit Cumulative Net Cash
Cash Flow based on $US 50 WTI and $CAD $2.25 AECO
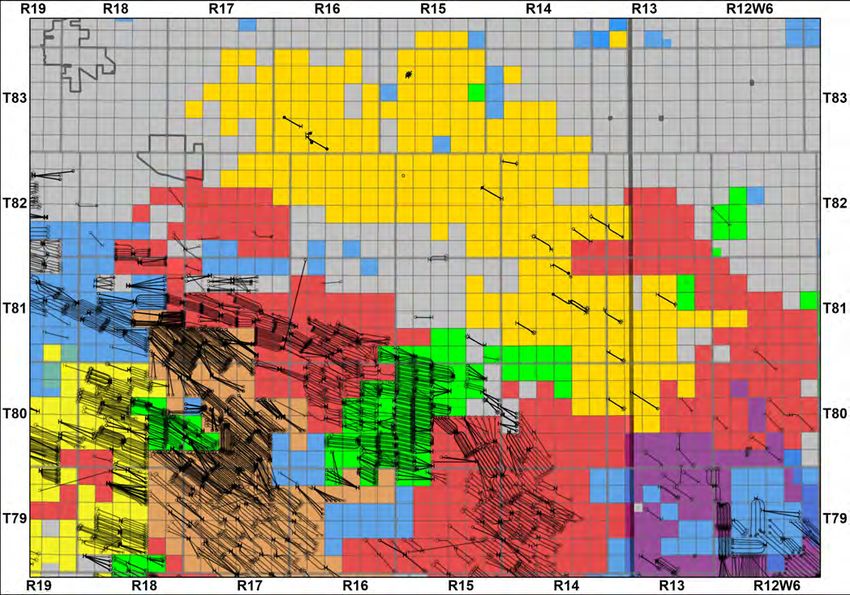
14Area Competitors
At over 240 net sections, Leucrotta is one of the largest land holders in the Montney Light Oil Window
Leucrotta Tourmaline Arc Ovintiv
Birchcliff CNRL Shell Crown & Other
15BC & Alberta Egress
16Management & Directors
Directors Management
Daryl H. Gilbert, P. Eng. (Chair) Robert J. Zakresky, CA - President and CEO
John A. Brussa, B.A., LL.B. Terry L. Trudeau, P. Eng. - VP Operations and COO
Donald Cowie Nolan Chicoine, MPAcc, CA - VP Finance & CFO
Brian Krausert, B.Sc. Rick Sereda, M.Sc., P. Geol. - Sr. VP Exploration
William Lancaster Helmut R. Eckert, P. Land - VP Land
Tom J. Medvedic, CA Peter Cochrane, P. Eng. - VP Engineering
Robert J. Zakresky, CA
17Advisories
Forward Looking Information
This document contains forward-looking statements and forward-looking information within the meaning of applicable securities laws. The use of any of the words “expect”,
“anticipate”, “continue”, “estimate”, “may”, “will”, “should”, “believe”, “intends”, “forecast”, “plans”, “guidance” and similar expressions are intended to identify forward-looking
statements or information.
More particularly and without limitation, this document contains forward looking statements and information relating to the Company’s risk management program, oil, NGLs and
natural gas production, capital programs, oil, NGLs, and natural gas commodity prices, and debt levels. The forward-looking statements and information are based on certain key
expectations and assumptions made by the Company, including expectations and assumptions relating to prevailing commodity prices and exchange rates, applicable royalty rates
and tax laws, future well production rates, the performance of existing wells, the success of drilling new wells, the availability of capital to undertake planned activities and the
availability and cost of labour and services.
Although the Company believes that the expectations reflected in such forward-looking statements and information are reasonable, it can give no assurance that such expectations
will prove to be correct. Since forward-looking statements and information address future events and conditions, by their very nature they involve inherent risks and uncertainties.
Actual results may differ materially from those currently anticipated due to a number of factors and risks. These include, but are not limited to, the risks associated with the oil and
gas industry in general such as operational risks in development, exploration and production, delays or changes in plans with respect to exploration or development projects or
capital expenditures, the uncertainty of estimates and projections relating to production rates, costs and expenses, commodity price and exchange rate fluctuations, marketing and
transportation, environmental risks, competition, the ability to access sufficient capital from internal and external sources and changes in tax, royalty and environmental legislation.
The forward-looking statements and information contained in this document are made as of the date hereof for the purpose of providing the readers with the Company’s
expectations for the coming year. The forward-looking statements and information may not be appropriate for other purposes. The Company undertakes no obligation to update
publicly or revise any forward-looking statements or information, whether as a result of new information, future events or otherwise, unless so required by applicable securities
laws.
Oil and Gas Metrics
OGIP - Original Gas in Place and OOIP - Original Oil in Place are equivalent to Total Petroleum Initially In Place (“TPIIP”) - see definition below. The OGIP and OOIP estimates quoted
in this presentation are internal estimates performed by a Qualified Reserves Evaluator (“QRE”) in accordance with the Canadian Oil and Gas Evaluations Handbook (“COGEH”). The
effective date of the estimates is April 1, 2021.
TPIIP - as defined in the Canadian Oil and Gas Evaluations Handbook (“COGEH”), is that quantity of petroleum that is estimated to exist originally in naturally occurring
accumulations. It includes that quantity of petroleum that is estimated, as of a given date, to be contained in known accumulations, prior to production, plus those estimated
quantities in accumulations yet to be discovered (equivalent to “total resources”). There is no certainty that any portion of the resources will be discovered. If discovered, there is
no certainty that it will be commercially viable to produce any portion of the resources.
EUR - Estimated Ultimate Recovery is defined as “those quantities of petroleum which are estimated, on a given date, to be potentially recoverable from an accumulation, plus
those quantities already produced therefrom.”
Boe - Barrel of Oil Equivalent. All boe conversions in the report are derived by converting gas to oil at the ratio of six thousand cubic feet of natural gas to one barrel of oil
equivalent. Boe may be misleading, particularly if used in isolation. A boe conversion rate of 1 Boe: 6 Mcf is based on an energy equivalency conversion method primarily applicable
at the burner tip and does not represent a value equivalency at the wellhead. Readers are cautioned that Boe may be misleading, particularly if used in isolation.
Page 18
18Advisories
This presentation contains metrics commonly used in the oil and gas industry, such as “NPV”, “PV”, “IRR”, “Payback”, “F&D” and “Capital Efficiency”. These terms do not have
standardized meanings or standardized methods of calculation and therefore may not be comparable to similar measures presented by other companies. Readers are cautioned
that the information provided by these metrics, or that can be derived from the metrics presented in this presentation should not be unduly relied upon. The following oil and gas
metrics have the following meanings as used in this presentation:
NPV - Net Present Value is defined as “the present value of future cash flows minus the initial capital.”
PV - Present Value is defined as “the present value of future cash flows.”
IRR - Internal Rate of Return. IRR is the discount rate required to arrive at a NPV equal to zero. Rates of return set forth in this presentation are for illustrative purposes. There is no
guarantee that such rates of return will be achieved in the future.
Mica Project
The "Mica Project" referenced in this document is a conceptual development study of Leucrotta's resources (Prospective and Contingent Resources) of tight oil and shale gas in the
Lower Montney formations on 30 net sections (30 gross) of land in the Mica Area. Leucrotta's average working interest in the lands is 100%. The evaluation is an unrisked full
development of the resource with multi-stage frac'ed horizontal wells using best-estimate type curves scheduled over a 5-year time period, effective January 2021. A total of $543
million of capital (undiscounted) is required for the project with an initial cash outlay of $112 million before payout is anticipated (5.5 years). The assumed commodity price is a flat
WTI USD$50.00/bbl; AECO CAD$2.25/GJ; FX 1.28 CAD/USD forecast. There is no assurance that the forecast price and cost assumptions used in the evaluation will be attained and
variances could be material. The actual scope of the project will be dependent upon the availability of funding, regulatory approvals, seasonal restrictions, oil and natural gas prices,
costs, actual drilling results, additional reservoir information that is obtained, and other factors. There is uncertainty that it will be commercially viable to produce any portion of
the resources. For the prospective resources there is no certainty that any portion of the resources will be discovered and if discovered, there is no certainty that it will be
commercially viable to produce any of those resources. The evaluation is an internal estimate prepared in accordance with the COGE handbook by a qualified reserves evaluator.
Page 19
19Advisories
Potential Drilling Locations
This presentation discloses drilling locations in four categories: (i) proved undeveloped locations; (ii) probable undeveloped locations; (iii) unbooked locations; and (iv) an aggregate
total of (i), (ii) and (iii).
Of the 94 total potential/possible locations referenced in page 3 and 4 of this presentation, only the following have been assigned reserves at December 31, 2019 as independently
evaluated by GLJ, in accordance with National Instrument 51-101 (“NI 51-101”):
6 Proved Undeveloped
16 Probable Undeveloped
The remaining 72 potential/possible locations are unbooked.
Unbooked locations are based on the Company's prospective acreage and internal estimates as to the number of wells that can be drilled per section. Unbooked locations do not
have attributed reserves or resources (including contingent and prospective). Unbooked locations have been identified by management as an estimation of the Company's multi-
year drilling activities based on evaluation of applicable geologic, seismic, engineering, production and reserves information. There is no certainty that the Company will drill all
unbooked drilling locations and if drilled there is no certainty that such locations will result in additional oil and gas reserves, resources or production. The drilling locations on
which the Company will actually drill wells, including the number and timing thereof is ultimately dependent upon the availability of funding, regulatory approvals, seasonal
restrictions, oil and natural gas prices, costs, actual drilling results, additional reservoir information that is obtained and other factors. While certain of the unbooked drilling
locations have been de-risked by drilling existing wells in relative close proximity to such unbooked drilling locations, the majority of other unbooked drilling locations are farther
away from existing wells where management has less information about the characteristics of the reservoir and therefore there is more uncertainty whether wells will be drilled in
such locations and if drilled there is more uncertainty that such wells will result in additional oil and gas reserves, resources or production.
Type Curves
This Presentation contains references to type well, or “type curve”, production and economics, which are derived, at least in part, from available information respecting the well
performance of other companies and , as such, may be considered “analogous information” as defined in NI 51-101. Production type curves are based on a methodology of analog,
empirical and theoretical assessments and workflow with consideration of the specific asset, and as depicted in this presentation, is representative of The Company’s current
program, including relative to current performance. Some of this data may not have been prepared by qualified reserves evaluators, may have been prepared based on internal
estimates, and the preparation of any estimates may not be in strict accordance with COGEH. Estimates by engineering and geo-technical practitioners may vary and the
differences may be significant. The Company believes that the provision of this analogous information is relevant to the Company’s oil and gas activities, given its acreage position
and operations (either ongoing or planned) in the areas in question, and such information has been updated as of the date hereof unless otherwise specified.
The Montney Type Curves presented on page 13 of this presentation are an internal estimate prepared by a Qualified Reserves Evaluator (“QRE”) and are based in part on the
proved plus probable type curves used by GLJ for booked undeveloped horizontal wells in the Montney formation as per the year-end 2019 corporate reserves evaluation effective
December 31 2019. The curves represent an internal “best-estimate” expectation.
Any references to peak rates, test rates, IP30 or initial production rates or declines are useful for confirming the presence of hydrocarbons, however, such rates and declines are
not determinative of the rates at which such wells will commence production and decline thereafter and are not indicative of long term performance or ultimate recovery. Readers
are cautioned not to place reliance on such rates in calculating aggregate production for the Corporation.
Page 20
20You can also read