Contrasted Chemical Weathering Rates in Cratonic Basins: The Ogooué and Mbei Rivers, Western Central Africa
←
→
Page content transcription
If your browser does not render page correctly, please read the page content below
ORIGINAL RESEARCH
                                                                                                                                        published: 03 February 2021
                                                                                                                                     doi: 10.3389/frwa.2020.589070

                                            Contrasted Chemical Weathering
                                            Rates in Cratonic Basins: The
                                            Ogooué and Mbei Rivers, Western
                                            Central Africa
                                            Jean-Sébastien Moquet 1,2*, Julien Bouchez 1 , Jean-Jacques Braun 3,4,5 , Sakaros Bogning 6 ,
                                            Auguste Paulin Mbonda 7 , Sébastien Carretier 3 , Vincent Regard 3 , Jean-Pierre Bricquet 8 ,
                                            Marie-Claire Paiz 9 , Emmanuel Mambela 9 and Jérôme Gaillardet 1
                                            1
                                             Université de Paris, Institut de physique du globe de Paris, CNRS, Paris, France, 2 UMR7327 Institut des Sciences de la
                                            Terre d’Orléans (ISTO), Université d’Orléans-CNRS/INSU-BRGM, Orléans, France, 3 UMR5563 Géosciences Environnement
                                            Toulouse (GET), Université de Toulouse/CNRS/IRD, Toulouse, France, 4 Institut de Recherches Géologiques et
                                            Minières/Centre de Recherches Hydrologiques, BP 4110, Yaoundé, Cameroon, 5 International Joint Laboratory DYCOFAC,
                                            IRGM-UY1-IRD, BP 1857, Yaoundé, Cameroon, 6 Departement of Earth Sciences, Faculty of Sciences, University of Douala,
                          Edited by:        Douala, Cameroon, 7 National Center for Scientific and Technical Research (CENAREST), Libreville, Gabon, 8 Hydrosciences
               Alexis Navarre-Sitchler,     Montpellier, Montpellier, France, 9 The Nature Conservancy, Libreville, Gabon
            Colorado School of Mines,
                        United States
                                            Despite the absence of tectonic activity, cratonic environments are characterized by
                         Reviewed by:
                       Alissa M. White,     strongly variable, and in places significant, rock weathering rates. This is shown here
   University of Arizona, United States     through an exploration of the weathering rates in two inter-tropical river basins from the
                     Bryan G. Moravec,
   University of Arizona, United States
                                            Atlantic Central Africa: the Ogooué and Mbei River basins, Gabon. We analyzed the
                        Richard Wanty,      elemental and strontium isotope composition of 24 water samples collected throughout
            Colorado School of Mines,       these basins. Based on the determination of the major element sources we estimate
                          United States
                                            that the Ogooué and Mbei rivers total dissolved solids (TDS) mainly derive from
                   *Correspondence:
               Jean-Sébastien Moquet        silicate chemical weathering. The chemical composition of the dissolved load and the
              jean-sebastien.moquet@        area-normalized solute fluxes at the outlet of the Ogooué are similar to those of other
                        cnrs-orleans.fr
                                            West African rivers (e.g., Niger, Nyong, or Congo). However, chemical weathering rates
                    Specialty section:      (TZ+ sil rate expressed as the release rate of the sum of cations by silicate chemical
          This article was submitted to     weathering) span the entire range of chemical weathering intensities hitherto recorded
               Water and Critical Zone,
                                            in worldwide cratonic environments. In the Ogooué-Mbei systems, three regions can
                a section of the journal
                       Frontiers in Water   be distinguished: (i) the Eastern sub-basins draining the Plateaux Batéké underlain
             Received: 30 July 2020         by quartz-rich sandstones exhibit the lowest TZ+     sil rates, (ii) the Northern sub-basins
       Accepted: 10 December 2020           and the Mbei sub-basins, which drain the southern edge of the tectonically quiescent
        Published: 03 February 2021
                                            South Cameroon Plateau, show intermediate TZ+    sil rates and (iii) the Southern sub-basins
                              Citation:
  Moquet J-S, Bouchez J, Braun J-J,
                                            characterized by steeper slopes record the highest TZ+        sil rates. In region (ii), higher
  Bogning S, Mbonda AP, Carretier S,        DOC concentrations are associated with enrichment of elements expected to form
    Regard V, Bricquet J-P, Paiz M-C,
                                            insoluble hydrolysates in natural waters (e.g., Fe, Al, Th, REEs) suggesting enhanced
   Mambela E and Gaillardet J (2021)
    Contrasted Chemical Weathering          transport of these elements in the colloidal phase. In region (iii), we suggest that a
Rates in Cratonic Basins: The Ogooué        combination of mantle-induced dynamic uplift and lithospheric destabilization affecting
    and Mbei Rivers, Western Central
        Africa. Front. Water 2:589070.
                                            the rim of the Congo Cuvette induces slow base level lowering thereby enhancing soil
      doi: 10.3389/frwa.2020.589070         erosion, exhumation of fresh primary minerals, and thus weathering rates. The study

Frontiers in Water | www.frontiersin.org                                          1                                        February 2021 | Volume 2 | Article 589070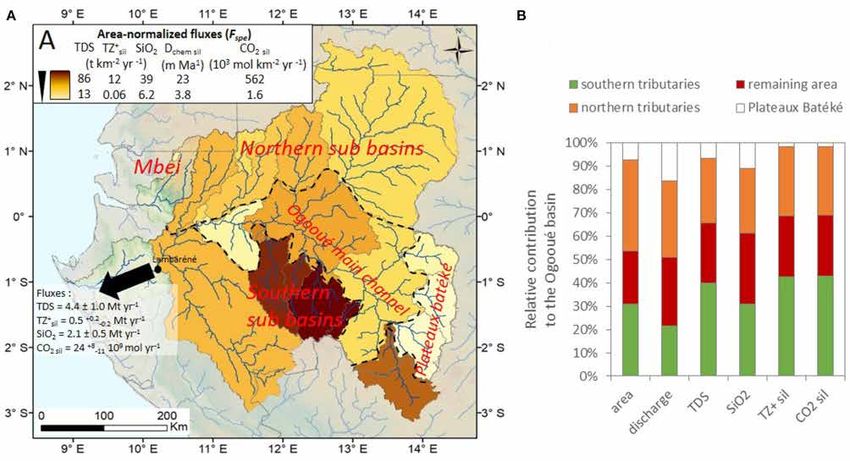
Moquet et al.                                                                                                    Chemical Weathering Western Central Africa

                                           points out that erosion of lateritic covers in cratonic areas can significantly enhance
                                           chemical weathering rates by bringing fresh minerals in contact with meteoric water. The
                                           heterogeneity of weathering rates amongst cratonic regions thus need to be considered
                                           for reconstructing the global, long-term carbon cycle and its control on Earth climate.

                                           Keywords: chemical weathering, river hydrochemistry, Congo craton, Western Central Africa, Ogooué River basin,
                                           regolith rejuvenation

INTRODUCTION                                                                     drainage-area normalized flux of the sum of cations released by
                                                                                 silicate chemical weathering, TZ+    sil rate) from those recorded
Over geological time scales, chemical weathering acts as a major                                                  +
                                                                                 under boreal conditions (TZsil rate < 1 t km−2 yr−1 ; Millot
player of the global biogeochemical cycles of elements in the                    et al., 2002; Zakharova et al., 2005, 2007; Pokrovsky et al.,
Earth’s Critical Zone. In particular, silicate weathering is known               2015) to those measured in India in the Kavery (Pattanaik
to consume CO2 through mineral hydrolysis and neutralization                     et al., 2013) and Nethravati (Gurumurthy et al., 2012) basins
of base cations hosted by silicate minerals, and therefore can                   (TZ+                     −2 yr−1 ). Various drivers can be invoked
                                                                                      sil rate > 15 t km
contribute to regulating the global climate (Berner et al., 1983).               to explain this spatial variability. For example, the Nsimi
Tectonic activity is thought to be a primary driver of chemical                  experimental watershed is located in a tectonically quiescent
weathering (Raymo and Ruddiman, 1992; Herman et al., 2013).                      area of the Nyong river basin (South Cameroon Plateau) where
Orogenic uplift associated with collision between tectonic plates                swamp environments are widespread. There, organic-rich waters
forms the major world mountain chains, favoring mechanical                       increase the mobilization and transfer of some elements generally
erosion, and the exposure of fresh primary mineral surfaces                      considered as immobile (e.g., Al, Fe, Th, Zr) through colloidal
to meteoric water and subsequent chemical weathering. This                       transport (Oliva et al., 1999; Viers et al., 2000; Braun et al.,
phenomenon has long been suggested to be responsible for                         2005, 2012). Such enhancement of weathering in the presence
the gradual cooling of the Earth over the Cenozoic under the                     of organic matter has also been reported for boreal Siberian
effect of global mountain uplift (Herman et al., 2013; Becker                    rivers rich in dissolved organic matter and poor in suspended
et al., 2018), although this hypothesis is strongly debated (e.g.,               matter (Zakharova et al., 2005, 2007; Pokrovsky et al., 2015,
Godderis, 2010; Willenbring and Von Blanckenburg, 2010; Von                      2016). Indeed, in this type of environment such environments,
Blanckenburg et al., 2015; Norton and Schlunegger, 2017; Caves                   organo-metal complexes form, leading to the solubilization of
Rugenstein et al., 2019; Hilton and West, 2020; Penman et al.,                   Al, Fe, Th, and Zr and thus to the breakdown of silicate minerals
2020). By contrast, tectonically quiescent cratonic areas, which                 (e.g., Oliva et al., 1999; Tamrat et al., 2019). The Kaveri and
represent almost 70% of the continents surface (Artyushkov et al.,               Nethravati basins drain the Indian craton and exhibit low annual
2018), have long been considered to be relatively inefficient in                 runoff (
Moquet et al.                                                                                           Chemical Weathering Western Central Africa

to lowering of the geomorphological base level that in turn                a bi-modal precipitation regime with wet periods from March to
can trigger physical erosion processes (Kusky et al., 2014) as             May and from October to December with a maximal monthly
observed for the Southern African Craton (Braun et al., 2014),             rainfall of ∼200 and ∼300 mm month−1 , respectively. The dry
North China Craton (Zhu et al., 2017) or Brazilian Shield                  period extends from June to August with a minimum monthly
(Rodríguez Tribaldos et al., 2017). Such slow, large-scale mantle          rainfall
Moquet et al.                                                                                                                  Chemical Weathering Western Central Africa

 FIGURE 1 | Study area and sampling locations. The regional map of the study area is modified from Guillocheau et al. (2015).

 FIGURE 2 | Photos of (A) Mbei river tributary 1, (B) Ivindo river at Loaloa (a Northern basin), (C) Lékoni river at Lakeni (Plateaux Batéké basin), (D) Lopé river at Lopé
 (a Southern basin), (E) Ogooué River at Ndjolé, and (F) Ogooué River at Lambaréné.

inhabitants km−2 , mostly concentrated along the river courses                           (Cutler et al., 2020). However, overall the contemporary
(UNEP, 2010). Uranium and manganese mining activity is                                   anthropogenic influence on the Ogooué River system can be
reported in the Southern Upper Ogooué area and future                                    assumed as insignificant in terms of chemistry, water flow, and
dam development may potentially affect river connectivity                                sediment fluxes.

Frontiers in Water | www.frontiersin.org                                             4                                           February 2021 | Volume 2 | Article 589070
Moquet et al.                                                                                                  Chemical Weathering Western Central Africa

                                                                               Analytical Methods
                                                                               All laboratory procedures and measurements were performed
                                                                               at the PARI (Plateau d’Analyse Haute Résolution) analytical
                                                                               platform of the IPGP (Institut Physique du Globe de Paris).
                                                                               Major cations (Ca2+ , Na+ , Mg2+ , K+ ) and major anions (Cl− ,
                                                                               SO2−             −
                                                                                   4 , and NO3 ) concentration were determined using ion
                                                                               chromatography (CS16 cationic colomn and AS9HC anionic
                                                                               column—IC5000+DIONEX THERMO). Trace elements were
                                                                               analyzed by Quadrupole-ICP-MS (ICP-QMS 7900 Agilent). For
                                                                               major element concentration, the analytical uncertainty is around
                                                                               5% (95% confidence interval), and for most trace elements,
                                                                               the analytical uncertainty is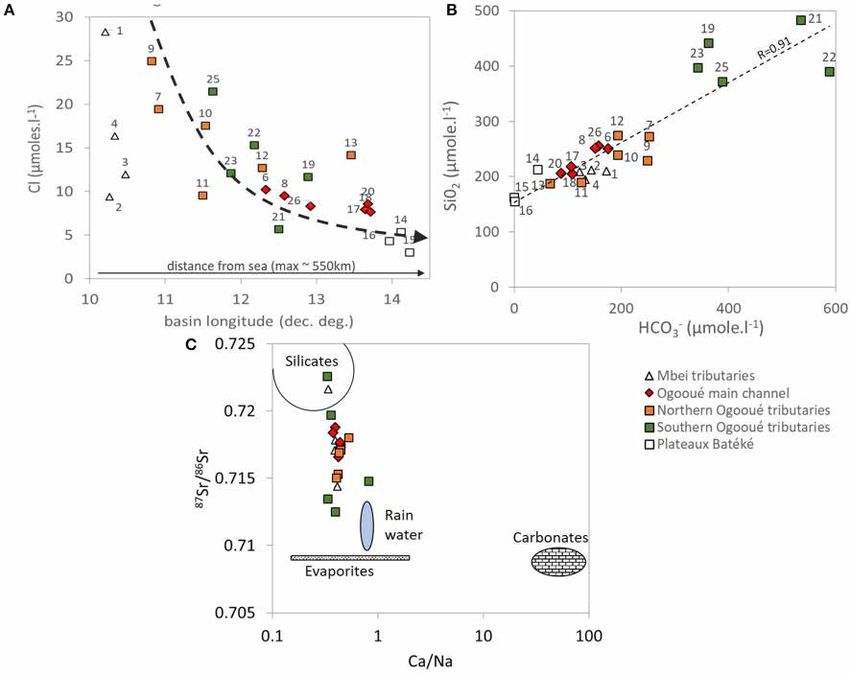
Frontiers in Water | www.frontiersin.org
Moquet et al.
TABLE 1 | Main characteristics of the Mbei and Ogooué rivers and their tributaries.
Group Sampling Sample River Location Sampling site characteristics Basin characteristics
date number
Latitude Longitude Sampled site Annual mean Basin Basin Mean basin Rainfall Specific
elevation discharge area elevation slope discharge
Decimal degree m.a.s.l. m3 s−1 km² m.a.s.l. % mm yr−1 mm yr−1
Mbei tributaries 05/09/2017 1 Mbei 0.5332 10.2148 139 ± 3 0.36 ± 0.06 13 448 7.9 2,244 890
tributary 1
05/09/2017 2 Mbei Akelayong 0.5874 10.2541 160 ± 9 0.14 ± 0.02 5 387 7.5 2,244 890
tributary 2
05/09/2017 3 Mwengue Akoga 0.8709 10.4961 534 ± 3 2.4 ± 0.68 135 639 1.0 1,957 567
05/09/2017 4 Binguili Assok 0.7110 10.3570 526 ± 3 0.36 ± 0.06 13 613 0.8 2,244 890
Ogooué R. main 10/09/2017 18 Ogooué Dam Poubara 2 −1.7728 13.5499 420 ± 3 454 ± 45 8,778 582 0.7 2,663 1,631
channel 10/09/2017 17 Ogooué Franceville −1.6355 13.5314 285 ± 5 781 ± 76 14,944 555 1.0 2,672 1,650
12/09/2017 20 Ogooué Lastourville −0.8096 12.7285 228 ± 3 1,928 ± 233 45,823 493 1.1 2,512 1,328
13/09/2017 26 Ogooué Ayem −0.1037 11.4153 88 ± 3 3,674 ± 726 142,373 502 0.9 2,186 814
07/09/2017 8 Ogooué Ndjolé −0.1827 10.7701 16 ± 3 3,933 ± 818 160,312 497 1.0 2,155 774
06/09/2017 6 Ogooué Lambaréné −0.7139 10.2221 3±3 4,341* 205,585 467 1.2 2,159 666*
(SEEG)
6
Northern Ogooué 07/09/2017 7 Abanga Bel_Abanga −0.2726 10.4847 16 ± 3 139 ± 42 8,265 448 1.3 1,915 531
tributaries
07/09/2017 9 Missanga Ndjolé −0.1800 10.7687 13 ± 3 8.3 ± 2.4 483 281 3.0 1,933 546
07/09/2017 10 Okano Alembé −0.0591 10.9782 46 ± 3 183 ± 56 11,135 494 1.1 1,902 521
07/09/2017 11 Lara Mindzi 0.6034 11.4966 313 ± 5 35 ± 10.4 2,049 590 0.8 1,935 547
08/09/2017 12 Mvoung Ovan 0.3136 12.1879 404 ± 3 160 ± 44 8,803 523 0.5 1,967 575
08/09/2017 13 Ivindo Loaloa 0.5215 12.8245 462 ± 3 892 ± 252 49,503 549 0.6 1,960 569
Southern Ogooué 12/09/2017 19 Leyou Ndoubi −1.3313 13.0989 293 ± 3 53 ± 5 1,161 592 1.5 2,579 1458
tributaries
12/09/2017 21 Lolo Lolo −0.6685 12.4929 213 ± 3 258 ± 38 7,582 531 1.6 2,368 1,077
Chemical Weathering Western Central Africa
12/09/2017 22 Ouagna Wagny −0.5988 12.3150 201 ± 4 56 ± 10 2,020 394 1.3 2,236 880
February 2021 | Volume 2 | Article 589070
12/09/2017 23 Offoué Entrance Lopé −0.3510 11.7627 183 ± 3 159 ± 36 7,057 493 1.8 2,103 713
park
13/09/2017 25 Lopé Lopé −0.1102 11.6019 118 ± 3 6.1 ± 1.9 379 322 2.0 1,890 512
Plateaux Batéké 09/09/2017 14 Sébé Okandja −0.6176 13.6812 295 ± 3 136 ± 23 4,513 458 0.8 2,287 952
09/09/2017 15 Lékoni Akieni −1.1852 13.8773 387 ± 3 263 ± 25 4,911 537 1.4 2,692 1694
10/09/2017 16 Passa Franceville −1.6294 13.6103 287 ± 3 312 ± 30 5,892 524 1.6 2,682 1,672
Drainage area and mean slope are based on the SRTM 90 digital elevation model (NASA). For annual discharge values, * represent the measured discharge at Lambaréné station (Bogning et al., 2018) and the other values are deduced
from rainfall (Qspe uncertainty = 161 mm yr−1 ; see section Hydrological and Climate Data for details).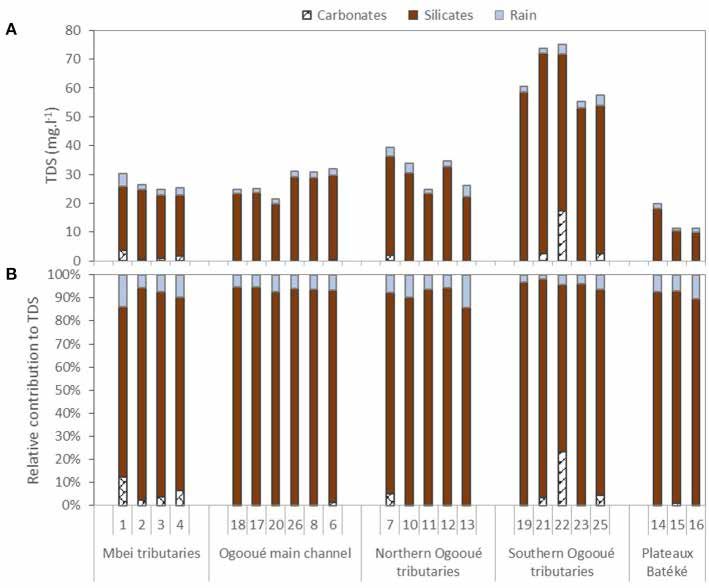
Frontiers in Water | www.frontiersin.org

                                                                                                                                                                                                                                                                                     Moquet et al.
                                            TABLE 2 | Physico-chemical parameters, major elements concentrations, DOC concentrations, and strontium isotopic ratios (87 Sr/86 Sr) measured in the river dissolved phase (i.e.,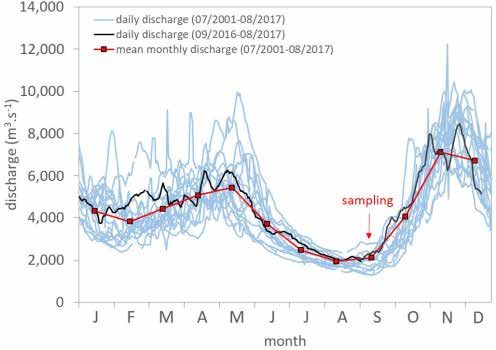
Frontiers in Water | www.frontiersin.org

                                                                                                                                                                                                                                                                  Moquet et al.
                                            TABLE 3 | Concentration (in ppb or µg.l−1 ) of trace elements in the dissolved phase (i.e.,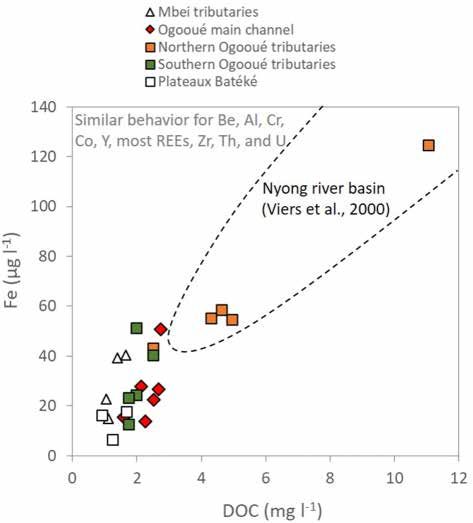
Frontiers in Water | www.frontiersin.org

                                                                                                                                                                                                                                                     Moquet et al.
                                            TABLE 3 | Continued

                                            Group                             Sample number            La      Ce       Pr       Nd       Sm       Eu       Gd       Tb        Dy      Ho        Er      Tm       Yb       Lu       Th        U
                                                                                                                                                                     ppb (µg.l−1 )

                                            Mbei tributaries                          1              0.101    0.113    0.0187   0.0719   0.0126   0.0061   0.0128   0.0018   0.0101   0.0021   0.0062   0.0011   0.0055   0.0006   0.0063   0.0036
                                                                                      2              0.0183   0.0352   0.0039   0.0168   0.0036   0.0049   0.0030   0.0004   0.0024   0.0005   0.0014   0.0002   0.0014   0.0002   0.0018   0.0019
                                                                                      3              0.0221   0.0467   0.0050   0.0221   0.0039   0.0048   0.0041   0.0004   0.0031   0.0006   0.0019   0.0002   0.0021   0.0001   0.0048   0.0027
                                                                                      4              0.0351   0.0692   0.0083   0.0342   0.0066   0.0046   0.0064   0.0008   0.0049   0.0010   0.0036   0.0004   0.0032   0.0003   0.0059   0.0035
                                            Ogooué R. main channel                    18             0.0124   0.0222   0.0025   0.0100   0.0019   0.0023   0.0018   0.0002   0.0012   0.0002   0.0007   0.0001   0.0003   0.0001   0.0012   0.0026
                                                                                      17            0.00925   0.0191   0.0021   0.0092   0.0018   0.0026   0.0016   0.0002   0.0012   0.0002   0.0008   0.0001   0.0005   0.0001   0.0021   0.0036
                                                                                      20             0.0127   0.0224   0.0023   0.0098   0.0018   0.0020   0.0013   0.0002   0.0010   0.0002   0.0005   0.0000   0.0006   0.0000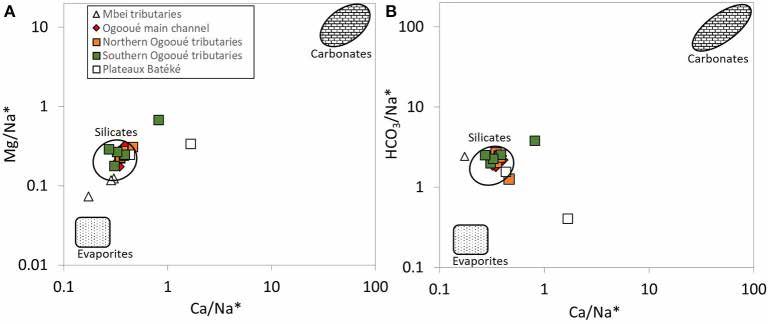
Moquet et al.                                                                                                          Chemical Weathering Western Central Africa

Therefore, for all water samples, we can apply the following                         draining only the corresponding rock types, and not the rocks
formula to estimate the atmospheric contribution of each solute                      themselves, such that this method does not rely on any particular
(X) concentration ([Xrain ] in µmoles l−1 ):                                         assumption regarding the congruent or incongruent character of
                                                                                     weathering reactions.
                                                                                      Without alternative proton sources such as pyrite oxidation
                                                    X                                (e.g., Calmels et al., 2007; Yu et al., 2020), the main proton sources
                 [Xrain ] = [Cl− riv ] ×                                  (1)
                                                   Cl−       seawater                for mineral hydrolysis is atmospheric / soil CO2 dissolution
                                                                                     in water. Therefore, the estimation of the CO2 consumption
with X= SO2−         +   2+     2+  +
              4 , Na , Ca , Mg , K , and
                                               2+      −
                                         Sr , [Clriv ] the total                    associated with silicate weathering (CO2 sil in µmoles l−1 ) can
Cl− concentration in the river, and ClX− seawater the X/Cl− molar                    be calculated following the equation:
ratio of seawater, considered here as the sole source of ions to
the rain (Berner and Berner, 1987). Then the concentration of
the element X corrected from the atmospheric inputs (annotated                                     [CO2sil ] = [HCO−
                                                                                                                   3 sil ]                                    (8)
[X∗ ]) is calculated as:                                                                         [HCO−             [Na+          +           2+
                                                                                                     3 sil ]   =      sil ] + [Ksil ] + 2×[Casil ]
                                                                                                                            2+
                                                                                                               +   2×[Mgsil    ]                              (9)
                         [X ∗ ] = [X riv ] − [X rain ]                    (2)
                                                                                     After estimating the contribution of silicate weathering to the
Thereafter, the “∗ ” symbol stands for concentrations corrected                      river dissolved load, the remaining dissolved Ca2+ and Mg2+ is
from atmospheric inputs.                                                             attributed to carbonate weathering, the result in terms of total
                                                                                     concentration ([TZ+               −1
                                                                                                         carb ] in mg l ) being therefore:
Contribution of Silicate and Carbonate Weathering
After correction from rainfall inputs, the dissolved load of the
                                                                                              +
rivers is considered to be the result of weathering of silicate and                        [TZcarb ] = [Ca∗ − Casil ]MCa + [Mg ∗ − Mgsil ]MMg               (10)
carbonate minerals. The quantitative estimation of the sum of the
cations concentrations delivered by silicate weathering ([TZ+ sil ] in
                                                                                     From the metrics mentioned above, we can finally calculate the
mg l−1 ) is:                                                                         three components of TDS concentration (mg l−1 ; Figure 5):

   +
[TZsil ] = [Nasil ]MNa + [Casil ]MCa + [Mgsil ]MMg + [Ksil ]MK(3)
                                                                                                            −
                                                                                            [TDSrain ] = [Clrain ]MCl + [SO2−
                                                                                                                           4 rain ]MSO4
                                                                                                       + [Ca2+             +
                                                                                                            rain ]MCa + [Narain ]MNa
with [Xsil ] the concentration of the cation X (with X =                Na+ ,                               2+            +
                                                                                                       + [Mgrain ]MMg + [Krain ]MK                          (11)
Ca2+ , Mg2+ and K+ ) derived from silicate weathering (here
                                                                                                              +
in µmoles l−1 ) and MC the molar mass of the corresponding                                   [TDSsil ] =   [TZsil ] + [SiO2 ] + [HCO−
                                                                                                                                    3 sil ]MHCO3−
cation C (in g mol−1 ).                                                                                                                                     (12)
   We consider that all the K+ and the Na+ remaining after                                                  +
                                                                                            [TDScarb ] = [TZcarb ] + 2[HCO−
                                                                                                                          3 carb ]MHCO3−                    (13)
correction from atmospheric inputs is derived from silicate
weathering only:
                                                                                     Where [SiO2 ] is the SiO2 concentration express in mg l−1 ,
                                                                                     MHCO3− is the HCO− 3 molar mass and

                              [Nasil ] = [Na∗ ]                           (4)
                                                   ∗
                                  [Ksil ] = [K ]                          (5)              [HCO−                −1
                                                                                               3 carb ](µmoles l ) = (2[Cacarb ] + 2[Mgcarb ])              (14)

The concentrations of Ca2+ and Mg2+ derived from silicate                            Note that [HCO−  3 sil ] is entirely derived from CO2 consumption
weathering can then be calculated as:                                                during silicate weathering while half of the [HCO−   3 carb ] derives
                                                                                     from CO2 consumption and the other half from the carbonate
                                                                                     mineral itself. Also, note that here all SiO2 is assumed to
                       [Casil ] = [Na∗ ]×(Ca/Na)sil                       (6)        derive from silicate weathering in these calculations. This set of
                                           ∗
                      [Mgsil ] = [Na ]×(Mg/Na)sil                         (7)        [TDSi ] and [TZ+ i ] (equations 11-13) parameters indicates the
                                                                                     concentration of TDS and TZ+ apportioned to each specific
As the Ogooué Basin drains silicate rocks similar to those of the                    source process i (atmospheric inputs, silicate weathering, and
Congo basin (cratonic plutonic and metamorphic lithology) to                         carbonate weathering).
estimate [Casil ] and [Mgsil ] and thus [TZ+
                                           sil ] we used the value of
                                                                                        The fluxes (F) and area-normalized fluxes (Fspe ) were
(Ca/Na)sil = 0.35 ± 0.15 and (Mg/Na)sil = 0.24 ± 0.12 (mol/mol)                      calculated by multiplying the concentrations of TDS, TZ+      sil , and
determined by Négrel et al. (1993) and used for the global                           CO2 sil by the discharge (Q) and the drainage area-normalized
scale by (Gaillardet et al., 1999b). Note that these values were                     discharge (Qspe also named specific discharge), respectively (see
previously determined based on water geochemistry of rivers                          the section Hydrological and Climate Data about the calculation

Frontiers in Water | www.frontiersin.org                                        10                                       February 2021 | Volume 2 | Article 589070
Moquet et al. Chemical Weathering Western Central Africa
of Q and Qspe ). For silicate weathering we also calculated the Second, we compiled a new database
chemical denudation (Dchem sil ) expressed in m Ma−1 using the (Supplementary Figure 2; Supplementary Table 3) for both
concentration of solutes (Casil , Mgsil , Ksil , Nasil , and SiO2 in mg specific discharge (Qspe ) and rainfall (P) for rivers of western
l−1 ), expressed as equivalent oxides (CaO, MgO, K2 O, Na2 O, Central Africa (Congo: Becker et al., 2018; Laraque et al.,
SiO2 in mg l−1 ) and using a rock density (d) of 2.7 g cm−3 (West 2020; Cameroun rivers: BVET observatory database/https://
et al., 2005; Bouchez and Gaillardet, 2014): mtropics.obs-mip.fr/catalog-m-tropics and Sighomnou,
2004); Atlantic African rivers: (Lienou et al., 2008; Conway
Qspe et al., 2009). We then fitted a second-order polynomial
Dchemsil = ([Casil ] (MCa + MO ) + [Mgsil ] (MMg + MO ) relationship to the P–Qspe data from rivers submitted to
d
+ [Ksil ] (2MK + MO ) + [Nasil ] (2MNa + MO ) + [SiO2 ]) (15) P between 1,500 mm.yr−1 and 3,000 mm yr−1 (n = 32),
corresponding to the conditions measured in the Ogooué
and Mbei rivers. The equation of the best fit second-order
with MO the molar mass of O. This Dchem sil parameter expresses polynomial is:
the rate at which silicate weathering processes result in a lowering
of the Earth surface.
Qspe = 0.00090P2 − 2.649P
Hydrological and Climate Data + 2304.03 (R = 0.95; RMSE = 161 mmyr−1 ) (17)
Drainage areas and mean slopes upstream of the sampling
points were extracted from the digital elevation model SRTM We then applied this relationship to the P-values estimated for
90 (Shuttle Radar Topography Mission; NASA) using ArgGis each sub-basin of the Ogooué and Mbei basins. We used the
10.3 (Esri) and QGis 2.18. The lithological composition for RMSE of the fit (161 mm yr−1 ) as a measure of the uncertainty
each sub-basin was also extracted from the lithological map of on these Qspe estimates (see Supplementary Figure 2), and
Gabon using ArcGis 10.3 (Esri) (Thiéblemont et al., 2009; see propagated this uncertainty in the solute flux calculations
Supplementary Table 1). (see section Solute Flux Calculation). Note that for the
The daily water discharge of the Ogooué River is available Ogooué River at Lambaréné station, for a rainfall of
only for the Lambaréné station from Bogning et al. (2018) for 2,159 mm yr−1 , the simulated Qspe is 780 mm yr−1 while
the period from July 2001 to August 2017 (Figure 3), meaning the measured Qspe was 666 mm yr−1 . The difference
that the sampling campaign was performed just after the end between simulated and measured value is therefore
of the precipitation record used here. Note that according to 113 mm yr−1 (12%) and is lower than the Qspe uncertainty
the discharge record, which does includes the period where considered (161 mm yr−1 ).
water sampling was carried out (September 2017), the discharge
pattern of the hydrological year October 2016–September 2017 Solute Flux Calculation
is very close to the mean pattern observed for the previous 16 The area-normalized fluxes (hereafter called Fspe and “rates”
years. Therefore, hydrological and precipitation conditions of when referring to weathering variables) of each solute was
the year of water sampling can be considered as representative estimated by multiplying the concentration of each solute
of the longer period used to constrain hydrological fluxes. We parameters values by the Qspe value estimated at each sampling
calculated an annual discharge over this period to assess an sites. To compute the area-normalized fluxes for each sub-
annual solute flux based on the discrete sampling performed in region of the study area, we substracted the upstream fluxes
this study. (F) where necessary (i.e., samples number 17, 20, 26, 8,
To calculate the annual discharge of other sampled sites we 6 along the Ogooué River and sample number 10 on the
apply a statistical approach based on a regional polynomial Okano River).
relationship between specific discharge (Qspe ) and rainfall (P) Our river hydrochemistry dataset features only one sampling
as performed by Scherler et al. (2017) to estimate Qspe in date. Therefore, the computed solute fluxes might be affected
ungauged Himalayan rivers. We first calculated the annual by significant uncertainty if solute concentrations were to vary
mean rainfall received by each studied sub-basin from the along the year. We first note that in other West African rivers
TRMM dataset (extracted for the Ogooué Basin over the period like the Nyong (Viers et al., 2000), the Niger (Picouet et al.,
1998–2015 according to the TRMM data–https://gpm.nasa.gov/). 2002) and the Congo (Laraque et al., 2009) rivers, the TDS
The calculated rainfall for these basins ranges from 1,890 to concentration varies only slightly with discharge throughout the
2,692 mm.yr−1 . At the Lambaréné station, P = 2,159 mm yr−1 year. This chemostatic behavior is observed in numerous rivers
and Qspe is calculated according to: in the world from small to large catchments (e.g., Godsey et al.,
2009), enabling first-order estimations of annual river dissolved
fluxes based on a limited sampling time resolution. Indeed,
Qspe = Q/S/1, 000 (16) under such conditions, solute fluxes are mainly controlled by
discharge variability rather than by concentration variability,
with Q the discharge (136 109 m3 yr−1 ) and S the basin area thereby providing confidence to our flux estimates based on
(205.9 103 km²). At Lambaréné, Qspe is therefore equal to 666 mm only one sampling campaign. However, a systematic bias might
yr−1 (Table 1). exist in our flux estimates since our sole sampling campaign was
Frontiers in Water | www.frontiersin.org 11 February 2021 | Volume 2 | Article 589070Moquet et al. Chemical Weathering Western Central Africa
performed during the dry season, when the highest river solute correspond to individual basins, as well as geomorphological and
concentrations are usually measured. Existing hydrochemical lithological units (Table 1; Figures 1, 2): The Mbei tributaries,
time series on the neighboring Congo River helps assessing the Northern Ogooué tributaries, the Plateaux Batéké Ogooué
this bias. Using only the hydrochemical data corresponding to tributaries, the Southern Ogooué tributaries and the Ogooué
the lowest monthly discharge (August) for the Congo River at River main channel. Note that the Ogooué River main channel
Brazzaville (HYBAM database, http://so-hybam.org/), TDS and exhibit intermediate values for all parameters (pH, conductivity,
cations fluxes are +10% and +20%, respectively, higher than flux solutes concentration) indicating that its composition simply
estimates based on monthly data covering the whole hydrological results from the mixing between the composition of the upstream
cycle. However, while informative for assessing the reliability tributaries inputs.
of our flux estimates for the Ogooué and Mbei rivers, we did
not consider that our data can be corrected for this bias using Physico-Chemical Parameters
constraints from the Congo River, as the specifics of solute The pH of the river water samples range between 4.63 and 7.62
concentration-discharge relationships in rivers can be influenced and the conductivity range between 5 and 78 µS cm−1 (Table 2).
by a variety of processes (Chorover et al., 2017). In particular Intermediate values of pH (6.62–7.10) and conductivity (16–27
these relationships can depend on reactive transport processes µS cm−1 ) were recorded in the Ogooué mainstream. The two
(e.g., Ameli et al., 2017; Kim et al., 2017), biological effects lowest values of pH ( 45 µS cm−1 ) were recorded in the Southern
2017). Therefore, we took the estimated bias from the Congo Ogooué tributaries. The other rivers exhibit intermediate values
River as a measure of uncertainty on the Ogooué and Mbei river (6.30 < pH < 7.18; 11 < conductivity < 34 µS cm−1 ).
solute fluxes associated with the sampling strategy, i.e., ±20% and Water temperature range between 21.6 and 28.1◦ C. The lowest
±10% for cation and TDS fluxes, respectively. temperature values were recorded in the Mbei tributaries (21.6–
We calculated the fluxes (F, in 103 t y−1 or 106 mol y−1 ) for the 22.9◦ C) whereas the Ogooué Basin samples exhibit a narrow
total dissolved solids (TDS), the total dissolved solids corrected temperature range (23.9–28.1◦ C). No direct relationship between
from atmospheric inputs (TDS∗ ), dissolved silica (express as temperature and elevation is observed. The instantaneous SPM
SiO2 ), the cations derived from silicate weathering (TZ+ sil ) and for
(Suspended Particulate Matter) concentration range between 6
CO2 consumption associated to silicate weathering (CO2 sil ). The and 70 mg l−1 (Table 2) and its distribution does not display any
corresponding fluxes are called F TDS, F TDS∗ , F SiO2 , F TZ+ sil ,
clear spatial distribution.
and F CO2 sil , respectively. The corresponding area-normalized
fluxes (also called “specific fluxes” or “rates,” equation 16, in t Major Elements and Dissolved Organic
km−2 y−1 or 103 mol km−2 y−1 ) are called Fspe TDS, Fspe TDS∗ , Carbon
Fspe SiO2 , Fspe TZ+
sil , and Fspe CO2 sil , respectively (Table 4).
The TDS concentration (and conductivity) are variable
throughout the basin and range between 11 and 75 mg l−1
Uncertainty Calculation (Table 2). The highest values (55–75 mg l−1 ) were recorded
The uncertainties associated to the calculated flux values in the Southern basins, the lowest values (11–23 mg l−1 ) are
(Tables 1, 4 and related figures) take into account the observed in the rivers draining the sandstone region of the
propagation of the uncertainty on the major element Plateaux Batéké, while the other groups (Northern basins, Mbei
concentration measurements (5%), a sensitivity test performed tributaries, and Ogooué main channel) exhibit intermediate
on the Ca/Nasil and Mg/Nasil ratios used in the Equations 6 and values (21–39 mg l−1 ).
7, the uncertainty on the discharge estimate at each sampling The total cationic charge (TZ+ , in meq l−1 ) is generally
location (RMSE = 161 mm yr−1 ), and the uncertainty associated dominated by Ca2+ , Mg2+ , and Na+ in almost equivalent
to our relatively loose sampling time resolution (20%). Note proportion, while the contribution of K+ to TZ+ is systematically
that the propagation of the uncertainty of Ca/Nasil and Mg/Nasil lower (7 to 12% of TZ+ ). The anionic charge (TZ− , in meq l−1 ) is
produces asymmetric values and only affects F TDSsil , F TZ+ generally dominated by HCO− −
3 (> 80% of TZ ). Concentrations
sil, F 2+ 2+ + + −
CO2 sil , and Dchem sil . In the text (sections Results and Discussion) of Ca , Mg , Na , K , HCO3 , and SiO2 are significantly
and in the Table 4, we thus report these fluxes values as “F+x correlated to the conductivity and to TDS concentration and
−y ”
thus followed the same spatial distribution (Table 2). The SiO2
where F is the central estimate, and F+x and F−y the upper and
contribution to TDS concentration range from 86% (Plateaux
lower bound of the range of estimates, respectively. According
Batéké) to 31% (Southern basins) and decrease in importance
to this method, the relative uncertainties on F TDS, F TDS∗ , F
as the TDS concentration increases. Interestingly, dissolved Si
TDSsil , F TZ+sil , F CO2 sil , and Dchem sil range between 11 and 84% concentration is correlated to HCO− 3 concentration (R = 0.91;
(Table 4).
n = 24; p < 0.01; Figure 4B), showing that the alkalinity
and, therefore, CO2 consumption associated with water-rock
RESULTS interactions were likely due to silicate weathering in the Ogooué
and Mbei basins. The concentrations of Cl− and SO2− 4 do
In order to ease the presentation of results and the discussion not follow the same spatial distribution. We did not identify
thereof, we divided the samples into five groups which any parameter controlling the SO2− 4 concentration distribution;
Frontiers in Water | www.frontiersin.org 12 February 2021 | Volume 2 | Article 589070Frontiers in Water | www.frontiersin.org
Moquet et al.
TABLE 4 | River fluxes and area-normalized fluxes of TDS (Total dissolved solids), TDS*(Total dissolved solids corrected from atmospheric inputs), TZ+
sil (cations derived from silicate weathering), SiO2 , and CO2 sil ( CO2
consumption associated to silicate weathering) in the Ogooué and Mbei Basin, and for the main domains of the Ogooué Basin.
Group Sample number Qspe basin Fluxes (F) area-normalized fluxes (Fspe) )
area
TDS TDS* TZ+
sil SiO2 CO2 sil TDS TDS* TZ+
sil SiO2 Dchem sil CO2 sil
mm yr−1 km² 103 t yr−1 106 mol yr−1 t km−2 yr−1 m Ma−1 103 mol
km−2 yr−1
Mbei tributaries 1 890 13 0.35 ± 0.08 0.3 ± 0.07 0.03+0.01
−0.01 0.15 ± 0.06 1.29+0.56
−0.56 26.9 ± 11.3 23.2 ± 9.8 2.17+0.93
−0.93 11.2 ± 4.7 6.07+2.61
−2.61 99+43
−43
2 890 5 0.12 ± 0.03 0.11 ± 0.02 0.01+0.01
−0.01 0.057 ± 0.024 0.60+0.26
−0.39 23.5 ± 9.9 22.2 ± 9.3 2.52+1.1
−1.33 11.4 ± 4.8 6.25+2.69
−2.83 119+52
−77
3 567 135 1.89 ± 0.64 1.75 ± 0.59 0.18+0.10
−0.10 0.96 ± 0.5 8.15+4.36
−5.21 14 ± 7.3 13 ± 6.7 1.34+0.72
−0.77 7.1 ± 3.7 3.93+2.10
−2.13 60+32
−39
4 890 13 0.3 ± 0.06 0.27 ± 0.06 0.03+0.01
−0.01 0.14 ± 0.06 1.24+0.53
−0.64 22.5 ± 9.5 20.4 ± 8.6 2.08+0.90
−0.99 10.4 ± 4.4 5.61+2.42
−2.47 95+41
−49
Ogooué main 18 1,631 8,778 333 ± 39 314 ± 37 43+15
−19 176 ± 61 1,928+672
−1,008 37.9 ± 13 35.8 ± 12.3 4.86+1.69
−2.14 20.1 ± 6.9 10.4+3.63
−3.84 220+77
−115
channel 17 1,650 14,944 585 ± 68 553 ± 64 69+24
−30 323 ± 111 3,148+1,094
−1,651 39.2 ± 13.4 37 ± 12.7 4.59+1.60
−2.01 21.6 ± 7.4 10.71+3.72
−3.93 211+73
−110
20 1,328 45,823 1,306 ± 188 1,209 ± 174 116+45
−56 752 ± 275 5,412+2,102
−3,225 28.5 ± 10.4 26.4 ± 9.6 2.52+0.99
−1.21 16.4 ± 6 7.64+2.84
−2.98 118+46
−70
26 814 142,373 3,551 ± 834 3,337 ± 784 419+225
−227 1,777 ± 778 19,469+10,487
−13,082 24.9 ± 10.9 23.4 ± 10.3 2.94+1.58
−1.60 12.5 ± 5.5 7.06+3.21
−3.32 137+74
−92
8 774 160,312 3,744 ± 925 3,502 ± 866 448+251
−247 1,876 ± 840 20,759+11,550
−14,146 23.4 ± 10.5 21.8 ± 9.8 2.79+1.56
−1.54 11.7 ± 5.2 6.74+3.14
−3.23 129+72
−88
13
6 666 205,585 4,358 ± 1,090 4,071 ± 1,018 512+171
−193 2,061 ± 515 23,675+8242
−11,186 21.2 ± 5.3 19.8 ± 5.0 2.49+0.83
−0.94 10 ± 2.5 5.72+1.46
−1.61 115+40
−54
Northern 7 531 8,265 173 ± 62 160 ± 58 20+11
−13 72 ± 39 960+544
−747 20.9 ± 11.3 19.3 ± 10.4 2.45+1.39
−1.55 8.7 ± 4.7 5.45+3.02
−3.13 116+66
−90
Ogooué 9 546 483 10.2 ± 3.6 8.9 ± 3.1 0.82+0.69
−0.52 3.6 ± 1.9 40+31
−31 21 ± 11.2 18.4 ± 9.7 1.70+1.43
−1.08 7.5 ± 4 4.35+2.47
−2.46 83+65
−65
tributaries 10 521 11,135 197 ± 72 178 ± 65 24+15
−15 84 ± 45 1,122+677
−875 17.7 ± 9.6 16 ± 8.7 2.20+1.33
−1.39 7.5 ± 4.1 4.77+2.69
−2.76 101+61
−79
11 547 2,049 26.7 ± 9.3 24.9 ± 8.7 3.4+1.9
−2.1 13 ± 7 161+87
−122 13 ± 6.9 12.2 ± 6.4 1.68+0.91
−1.04 6.2 ± 3.3 3.84+2.09
−2.17 78+43
−60
12 575 8,803 175 ± 58 165 ± 55 22+12
−13 84 ± 43 997+551
−749 19.9 ± 10.3 18.8 ± 9.7 2.46+1.38
−1.5 9.5 ± 4.9 5.77+3.07
−3.17 113+63
−85
13 569 49,503 633 ± 213 528 ± 177 82+58
−50 317 ± 165 3,707+2,505
−2,778 12.8 ± 6.6 10.7 ± 5.5 1.66+1.16
−1.01 6.4 ± 3.3 3.90+2.14
−2.15 75+51
−56
Southern 19 1,458 1,161 100 ± 13.1 96.6 ± 12.7 14.1+5.1
−6.2 45 ± 16 653+235
−337 86.1 ± 30.6 83.2 ± 29.5 12.12+4.37
−5.33 38.7 ± 13.7 22.51+8.11
−8.6 562+203
−290
Ogooué 21 1,077 7,582 601 ± 107 589 ± 105 86+38
−44 237 ± 93 4,064+1,773
−2,552 79.3 ± 31.1 77.7 ± 30.5 11.34+5.04
−5.75 31.3 ± 12.3 20.16+8.13
−8.71 536+234
−337
tributaries 22 880 2,020 133 ± 29 128 ± 28 14+10
−8 42 ± 18 660+434
−434 66 ± 28 63.1 ± 26.8 7.01+4.78
−3.73 20.6 ± 8.7 13.36+6.07
−6.16 327+215
−215
Chemical Weathering Western Central Africa
23 713 7,057 275 ± 74 264 ± 71 38+19
−21 120 ± 56 1,773+886
−1,214 39 ± 18.1 37.4 ± 17.4 5.39+2.67
−3.01 17 ± 7.9 11.03+5.27
−5.5 251+126
−172
February 2021 | Volume 2 | Article 589070
25 512 379 11.2 ± 4.2 10.5 ± 3.9 1.5+0.9
−0.9 4.3 ± 2.4 68+41
−50 29.4 ± 16.1 27.6 ± 15.1 3.86+2.33
−2.38 11.4 ± 6.3 7.77+4.42
−4.51 179+109
−132
Plateaux Batéké 14 952 4,513 79.9 ± 16 73.7 ± 14.8 5.9+3.0
−3.1 55 ± 23 281+138
−183 17.7 ± 7.3 16.3 ± 6.7 1.30+0.67
−0.68 12.2 ± 5 5.51+2.33
−2.38 62+31
−40
15 1,694 4,911 94.1 ± 10.6 87.4 ± 9.9 0.30+0.10
−0.10 81 ± 28 7.62+2.63
−2.63 19.2 ± 6.5 17.8 ± 6.1 0.06+0.02
−0.02 16.5 ± 5.6 5.6+1.93
−1.93 1.6+0.5
−0.5
16 1,672 5,892 108.5 ± 12.4 97.1 ± 11.1 1.8+0.9
−0.7 92 ± 31 68+34
−35 18.4 ± 6.3 16.5 ± 5.6 0.3+0.14
−0.12 15.6 ± 5.3 5.48+1.90
−1.91 12+6
−6
(Continued)Moquet et al. Chemical Weathering Western Central Africa
however, SO2− range from 3.7 to 21 µmoles l−1 which is
103 mol km−2 yr−1
4
small by comparison with the global riverine discharge-weighted
average (SO2−
160+100
−124
= 108 µmoles l−1 ; Burke et al., 2018). The
115+40
−54
133+78
−87
sil
87+55
−66
23+11
−14
4
CO2
Mbei tributaries, which are located relatively close to the coast
(∼150 km), exhibited variable Cl− concentrations (9–28 µmole
l−1 ). In the Ogooué Basin, the Cl− concentrations range between
3 and 25 µmole l−1 and depend on the basin distance from
area-normalized fluxes (Fspe) )
5.72+1.46
−1.61
4.39+2.41
−2.45
6.05+4.89
−5.24
5.53+2.04
−2.06
7.65+3.36
−3.45
Dchem sil
m Ma−1
the sea, as observed in the Congo Basin (Négrel et al., 1993;
Figure 4A). This observation confirms that Cl− concentration
was mainly controlled by the atmospheric inputs (Figure 4A).
10 ± 3
14 ± 5
13 ± 6
7±4
9±6
SiO2
The highest NO− −1
3 concentrations (5.4–10.9 µmole l ) were
recorded in all the Mbei tributaries and in one river draining
2.49+0.83
−0.94
3.44+1.98
−2.51
0.52+0.26
−0.26
2.86+1.62
−1.49
1.9+1.23
−1.17
a Northern basin (Missanga at Ndjolé), all corresponding to
sil
TZ+
basins draining the southern Cameroon plateau over catchment
−1
areas smaller than 500 km². The other rivers exhibited low NO−
yr
3
−2
19.8 ± 5
26 ± 15
23 ± 10
concentration (Moquet et al. Chemical Weathering Western Central Africa
FIGURE 4 | Main characteristics of the dissolved load of the tributaries of the Ogooué and Mbei basins (A) Cl− concentration as function of the centroid basin
87
location. The dotted line represents the decreasing Cl− concentration from the coast (B) SiO2 vs. HCO−
3 . (C) Sr/86 Sr ratio vs. Ca/Na (rock weathering end members
defined by Négrel et al., 1993).
of the rivers (Figure 5). Interestingly, according to this method, significantly contribute to TDS only in one Mbei tributary
the entirety of river SO2−
4 derive from atmospheric inputs. Again, and one Ogooué R. tributary (Ouagna at Wagny). Such low
this is consistent with the absence of known evaporite outcrops contribution of carbonate weathering to the solute load of the
in the region. The atmospheric contribution to the river budget study area is consistent with the lithological map, which displays
of other dissolved species is generally lower than 40% with a only sparse carbonate outcrops in the Ogooué and Mbei basins.
decreasing impact in the order: Mg2+ (40 ± 21%) > K+ (29 ±
16%) > Ca2+ (27 ± 12%) > Na+ (19 ± 21%) > Sr2+ (5 ± 3%).
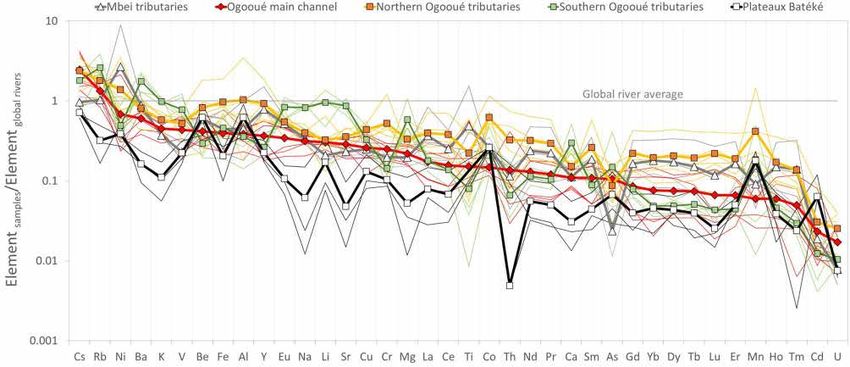
Given the low relative input of rain to the dissolved Sr budget, Trace Elements
no attempt was made to correct dissolved 87 Sr/86 Sr ratios from The concentrations of trace elements in the Ogooué and Mbei
the rain contribution. basins (Table 3; Figure 7), are generally lower than the global
The Mg/Na∗ , Ca/Na∗ , and HCO3 /Na∗ molar ratios of the average (Gaillardet et al., 2014). The concentrations of trace
sampled waters are consistent with the silicate end member alkali and alkaline earth metals (Rb, Cs, Sr, and Ba) in the
previously defined for the Congo Basin (Négrel et al., 1993) Ogooué Southern basins are higher than in the Ogooué main
and used at global scale by Gaillardet et al. (1999b) (Figure 6). channel, and are the lowest in the Plateaux Batéké region.
Together with the strong relationship between HCO− 3 and The Northern Ogooué basins and the Mbei tributaries exhibit
SiO2 (Figure 4B) and the overall relatively high 87 Sr/86 Sr concentrations similar to those of the Ogooué mainstream.
ratios (Figure 4C), this observation confirms that the major Conversely, transition metals and REE concentrations are
solutes in the Ogooué-Mbei basins are mainly sourced from generally higher in the Northern basins and in the Mbei
silicate weathering. More quantitatively, source discrimination tributaries than in Southern and Plateaux Batéké tributaries.
calculations show that silicate weathering largely dominate the For most trace elements, Plateaux Batéké tributaries exhibit the
TDS export (by up to 70%; Figure 5). Carbonate weathering lowest concentrations (exceptions: Al and Cd).
Frontiers in Water | www.frontiersin.org 15 February 2021 | Volume 2 | Article 589070Moquet et al. Chemical Weathering Western Central Africa FIGURE 5 | Absolute (A) and relative (B) contributions of rainfall, carbonate weathering, and silicate weathering to the river TDS for each sampling site of the Ogooué and Mbei basins. FIGURE 6 | Mixing diagrams indicating the source of solutes to the rivers of the Ogooué and Mbei basins (A) Mg/Na* vs. Ca/Na* and (B) HCO3 /Na* vs. Ca/Na*. The “*” symbol stands for concentrations corrected from atmospheric inputs (Equation 2). The silicate, carbonate and evaporite end members defined by Gaillardet et al., 1999b are shown for reference. Based on correlation analysis with other parameters (physico- particular, the higher DOC concentration measured in the chemical parameters and concentration of DOC and of major Northern Ogooué basins corresponds to higher concentration elements) across the sample set, two groups of trace elements for these elements. Second, other elements such as Li, V, can be distinguished. First, elements such as Be, Al, Cr, Fe, Co, Cu, As, Rb, Sr, Ba, and Eu correlate positively (R > 0.5; Y, most REEs, Zr, Th, and U correlate positively with DOC p < 0.01) with conductivity and the concentration of most concentration (R > 0.5; p < 0.01; Supplementary Figure 4; major elements, and are therefore reflective of release by rock see for example the Fe-DOC relationship in Figure 8). In weathering. These elements thus exhibit high concentration in Frontiers in Water | www.frontiersin.org 16 February 2021 | Volume 2 | Article 589070
Moquet et al.                                                                                                              Chemical Weathering Western Central Africa

 FIGURE 7 | Global average-normalized patterns for the river dissolved load of the Ogooué and Mbei rivers. Plain lines correspond to individual samples, whereas lines
 with a symbol correspond to average values for each domain defined in Table 1. Global river averages are from Gaillardet et al. (2014) for trace elements and from
 Meybeck (2003) for Na+ , K+ , Mg2+ , and Ca2+ . Elements are ordered along the y-axis from the highest to lowest values recorded in the Ogooué main channel.

the Southern basins, low concentration in the Plateaux Batéké
and intermediate concentration in the other basins. We note
that B concentration is strongly correlated to Cl− concentration
(which might point toward a dominantly atmospheric origin
of B in the Ogooué–MBei rivers), and that other elements (Ti,
Mn, Ni, Nb, Cd, Cs) do not show any significant correlation
with the parameters cited above. Interestingly, the elements
commonly considered as weakly soluble during weathering (e.g.,
Al, Fe, REEs+Y) or strongly insoluble (Th, Zr) are correlated to
DOC concentration in the Ogooué and Mbei basins, where they
exhibit low concentration both in comparison with global rivers
(Gaillardet et al., 2014; Figure 7) and with other African rivers
like the Nyong (Viers et al., 2000), Niger (Picouet et al., 2002),
and Congo (Gaillardet et al., 1995) rivers.

Silicate Weathering Fluxes and Associated
CO2 Consumption
Using estimates of Qspe values (specific discharge; see section
Hydrological and Climate Data), the TDS and silicate weathering
fluxes (F TDS and F TZ+   sil ) of the Ogooué and Mbei rivers and
their tributaries were calculated. As carbonate weathering is a
small contributor to the river dissolved load over the studied
area, no attempt was made to estimate the corresponding river
                                                                                        FIGURE 8 | Fe vs. DOC relationship in the Ogooué and Mbei basins. The
dissolved fluxes. At the Lambaréné station, the sampling location                       domain corresponding to the Nyong values (monthly sampling from October
closest to the Ogooué outlet, the Ogooué river export a F TDS                           1994 to January 1997; Viers et al., 2000) is added for reference.
of 4.4 ± 1.1 Mt yr−1 including 2.1 ± 0.5 Mt yr−1 of F SiO2
and 0.5+0.2
        −0.2 Mt yr
                    −1 of F TZ + . The corresponding F
                                  sil                        spe are 21
± 5.3, 10 ± 2.5 and 2.5+0.8
                          −0.9   t  km −2 yr−1 , respectively, and the
                                                                                       = 29 ± 16 to 86 ± 31 t km−2 yr−1 ; Fspe TZ+                 +2.3
                                                                                                                                          sil = 3.9−2.4 to
Dchem sil was 5.72+1.46
                    −1.61 m Ma
                                    −1 (Table 4). Values of the F
                                                                     spe               12.1+4.4
                                                                                            −5.3 t km
                                                                                                      −2 yr−1 ; D               +4.4         +8.1
                                                                                                                  chem sil = 7.8−4.5 to 22.5−8.6 m Ma )
                                                                                                                                                       −1
             +
TDS, Fspe TZsil , and Dchem sil parameters are particularly variable                   are recorded in the Southern basins, the lowest ones are observed
throughout the basin (Figure 9A). The highest values (Fspe TDS                         in the Plateaux Batéké tributaries (Fspe TDS = 18 ± 7 to 19 ± 7 t

Frontiers in Water | www.frontiersin.org                                          17                                         February 2021 | Volume 2 | Article 589070
Moquet et al. Chemical Weathering Western Central Africa
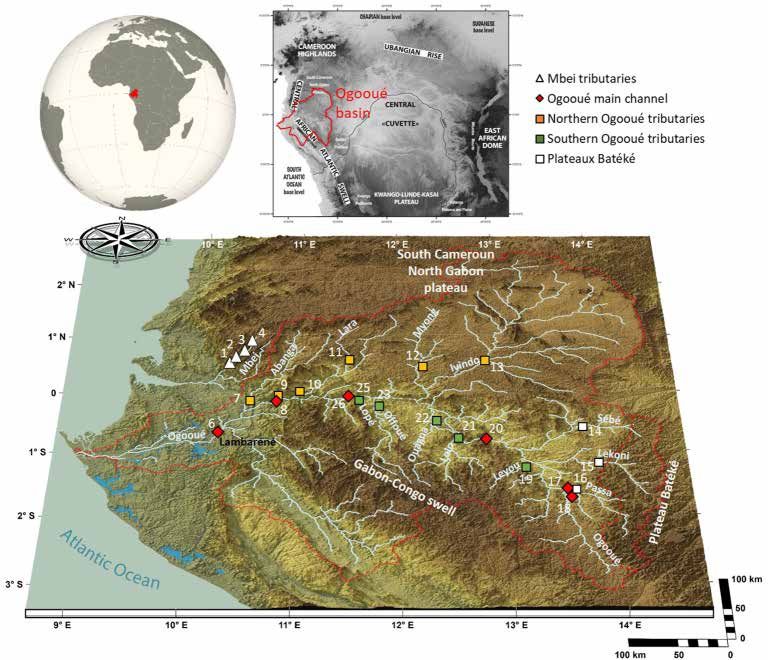
FIGURE 9 | Spatial distribution of weathering fluxes in the Ogooué Basin: (A) Color map showing the spatial distribution of specific fluxes (Fspe ) of TDS, TZ+ sil , SiO2 ,
and associated CO2 sil consumption Fspe distribution throughout the Ogooué Basin (the darkness of the color is proportional to these rates; the extreme values are
reported in the caption). Note that at this scale the basins of the Mbei tributaries are too small to be visible. (B) Relative contribution of each region in term of drainage
area, discharge and fluxes of TDS, TZ+ sil , SiO2 , and CO2 sil consumption. The uncertainties are reported in Table 4.
km−2 yr−1 ; Fspe TZ+ +0.02 +0.7
sil = 0.06−0.02 to 1.3−0.7 t km
−2 yr−1 ; D
chem of the discharge of Western Africa (according to Western Africa
sil = 5.5 +1.9
−1.9 to 5.6 +1.9
−1.9 m Ma −1 ), while the other basins exhibit TDS flux and discharge estimates of Milliman and Farnsworth,
intermediate values (Fspe TDS = 13 ± 7 to 39 ± 13 t km−2 yr−1 ; 2011). The Ogooué River area-normalized TDS flux (Fspe TDS
Fspe TZ+ +0.7 +1.7 −2 yr−1 ; D +2.8 = 21 ± 5 t km−2 yr−1 ) is lower than the global average (30–
sil = 1.3−0.7 –4.9−2.1 t km chem sil = 3.8−2.2 –
50 t km2 yr1 ; Meybeck, 1976, 2003; Milliman and Farnsworth,
11+5.3 −1
−5.5 m Ma ) (Table 4; Figure 9A). The CO2 consumption
9
2011), partly due to the fact that at the global scale, a large
flux associated with silicate weathering (CO2 sil ) is 24+8 −11 10 mol fraction of the river TDS flux is provided by the weathering
+0.5
yr for the Ogooué Basin, range between 1.6−0.5 10 mol km−2
−1 3
of carbonate and evaporite rocks, which are not present in the
yr−1 and 562+203 3 −2 yr−1 , scaling with F +
−290 10 mol km spe TZsil studied area. However, the area-normalized specific fluxes of
(Table 4). Spatially, the Northern basins, the Southern basins silicate-derived cationic charge and CO2 consumption for the
and the Plateaux Batéké tributaries contribute to around 28, whole Ogooué (Fspe TZ+ +0.8
sil = 2.5−0.9 t km
−2 yr−1 ; F
spe CO2 sil =
40, and 6% of the TDS export from the Ogooué at Lambaréné, +40 3 −2 −1
115−54 10 moles km yr ) are close to the global average (Fspe
respectively (for drainage areas representing 39, 31, and 7% of TZ+ −2 yr−1 and F −2
sil = 2.3 t km spe CO2 sil = 96–117 mol km
the total drainage area, respectively). The remaining part of −1
yr ; Gaillardet et al., 1999b; Moon et al., 2014). These numbers
the basin (the Ogooué mainstream and unsampled tributaries; challenges the paradigm of cratonic areas being rather inactive in
23% of the Ogooué area) contributes to 26% of the TDS flux terms of silicate weathering (e.g., Gaillardet et al., 1999b; West,
(Figure 9B). 2012; Moon et al., 2014).
These flux values estimated at the Ogooué outlet result from
DISCUSSION the mixing of waters derived from regions characterized by
a variety of heterogeneous weathering rates. Indeed, the river
Silicate Weathering Rates in the Ogooué TDS, TZ+ sil , SiO2 , associated CO2 consumption Fspe and the
and Mbei Basins, and Comparison With chemical silicate denudation (Dchem sil ) estimated throughout the
Regional and Global Rates Ogooué Basin are heterogenous. These estimates cover the whole
This study presents the first TDS flux estimates for the Ogooué range of values yet measured in cratonic environments under
River. With a TDS flux F TDS = 4.4 ± 1.1 106 t yr−1 , the Ogooué all latitudes (Figure 10). As throughout the Ogooué Basin the
River contributes to around 4% of the TDS flux for around 7% area-normalized fluxes of TDS, TZ+ sil , SiO2 (and associated CO2
Frontiers in Water | www.frontiersin.org 18 February 2021 | Volume 2 | Article 589070Moquet et al. Chemical Weathering Western Central Africa
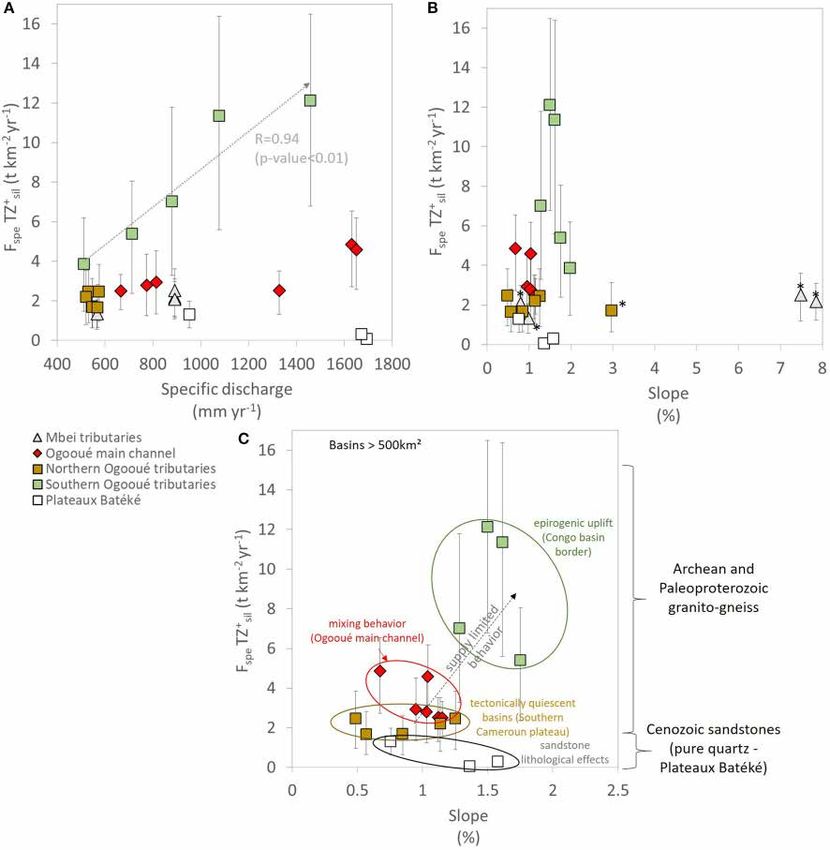
FIGURE 10 | Silicate weathering rate (Fspe TZ+ sil in t km
−2
yr−1 ) vs. specific discharge (Qspe ) for rivers of the Ogooué and Mbei basins, and of other rivers draining
cratons at the global scale. The HYBAM database provides major elements fluxes for the Upper Negro, Branco, Xingu, and Tapajos (Moquet et al., 2016), Oyapock
and Maroni (Sondag et al., 2010) and Congo (Laraque et al., 2009) for the period 2003–2019. Values of Fspe TZ+ sil for the HYBAM stations here correspond to the
cation fluxes corrected from the atmospheric inputs, according to the method used in the present study. The remaining cations rate were considered to be only
derived from silicate weathering. Error bars reflect uncertainties, the calculation of which is detailed in section Uncertainty Calculation.
consumption) as well as the Dchem sil are strongly correlated Moquet et al., 2016; note that these values were updated for the
to one another (R > 0.87; p < 0.01), here we discuss only period 2003–2019 from the HYBAM observatory database. These
controls on the values of Fspe TZ+ sil . At the global scale, cratonic TZ+ sil rates correspond to the cation fluxes corrected from the
environments exhibit a large variability in silicate weathering atmospheric inputs, according to the method performed in the
rates (Figure 10), ranging from 0.25 t km−2 yr−1 (Slave River, present study. The remaining cation amounts considered to be
Canada; West et al., 2002) to 16 t km−2 yr−1 (Kaveri River, only derived from silicate weathering because no carbonate and
India; Pattanaik et al., 2013). In the Ogooué Basin the lowest evaporite are present in the considered basins), the Congo (Fspe
values obtained for the Plateaux Batéké (Fspe TZ+ sil < 1.3+0.7 −0.7 TZ+ sil = 0.54–2.3 t km
−2 yr−1 ; Négrel et al., 1993; Gaillardet et al.,
t km−2 yr−1 ) are amongst the lowest silicate weathering rates 1995), the Nyong (Fspe TZ+ −2 yr−1 ; Viers et al., 2000;
sil = 0.49 t km
measured on Earth, lower than or similar to weathering rates Regard et al., 2016) or the Niger (Fspe TZ+ −2
sil = 0.58 to 2.2 t km
recorded in the Siberian craton (Zakharova et al., 2005, 2007; −1
yr ; Picouet et al., 2002) rivers.
Pokrovsky et al., 2015) and in the Canadian shields (Millot et al., Among cratonic environments, no direct relationship between
2002). The highest values obtained for the Southern Ogooué specific discharge and silicate weathering intensity is observed,
basins (Fspe TZ+ +2.3 +4.4
sil = 3.9−2.4 to 12.1−5.3 t km
−2 yr−1 ) are on the
neither at the global scale nor at the scale of the Ogooué Basin
order of those measured in the Kaveri Basin (India), a region (Figure 10). The present study shows that the silicate weathering
particularly active in terms of silicate weathering (Gurumurthy flux calculated at the outlet of the Ogooué Basin does not
et al., 2012; Pattanaik et al., 2013). Interestingly, by comparison reflect an intrinsic property of weathering in cratonic areas (i.e.,
with the silicate weathering rates measured in orogenic areas, low physical erosion rates associated to low weathering rates;
these values are in the lower range of those recorded in the e.g., West, 2012), but results from the mixing of solute fluxes
Andes (Fspe TZ+ sil = 9–104 t km
−2 yr−1 ; Moquet et al., 2011,
derived from contrasted environments in terms of weathering.
2018), in the New Zealand Alps (Fspe TZ+ sil = 2–187 t km
−2
In addition, our observations highlight that cratonic areas can
−1
yr ; Moore et al., 2013) but are commensurate to, or higher be particularly active in terms of weathering, as in the Southern
than those recorded in the Himalayas (mean Fspe TZ+ sil = 5.78 t Ogooué Basin, and that the absence of tectonic activity does not
km−2 yr−1 , West et al., 2002), in the European Alps (Fspe TZ+ sil necessarily imply slow weathering.
= 0.03–11 t km−2 yr−1 , Donnini et al., 2016) and in the Rocky
Mountains of Canada (Fspe TZ+ sil = 0.13 to 4.3 t km
−2 yr−1 , Millot Controlling Factors of Silicate Weathering
et al., 2002). The other basins (Northern basins, Mbei tributaries in the Ogooué Basin and Implications for
basins) exhibit Fspe TZ+ sil values similar to those measured in large the Long-Term Carbon Cycle
tropical rivers like the Amazon tributaries and French Guyana At the global scale, silicate weathering is controlled by a range of
rivers (Fspe TZ+ sil = 0.8–3.0 t km
−2 yr−1 ; Sondag et al., 2010;
variables like climate, lithology, geomorphology or the presence
Frontiers in Water | www.frontiersin.org 19 February 2021 | Volume 2 | Article 589070You can also read