Connecting the dots Climate change, migration and social protection - ReliefWeb
←
→
Page content transcription
If your browser does not render page correctly, please read the page content below
Connecting
the dots
Climate change, migration
and social protection
Ritu Bharadwaj, Somnath Hazra, Mohan Reddy,
Shouvik Das and Daljeet Kaur

 Working Paper                  Climate change

                                Keywords:
 October 2021                   Climate resilience, social protection,
                                climate-induced migration, risk governance,
                                money where it matters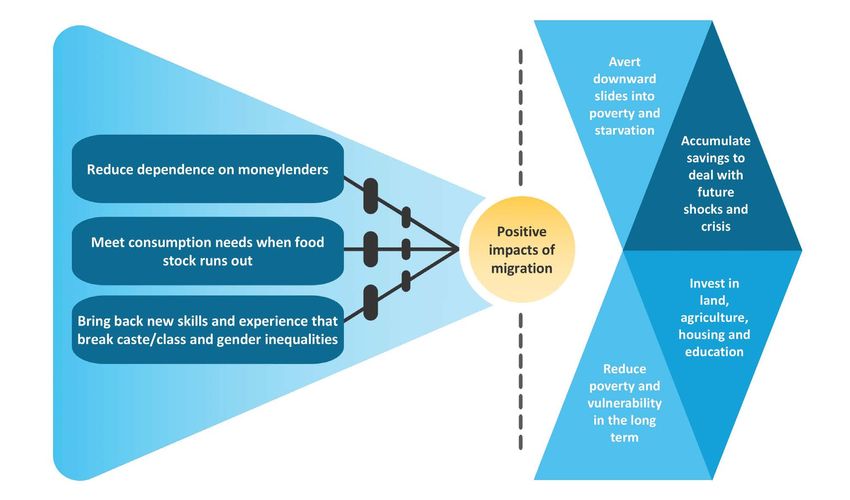
About the authors                                                           Produced by IIED’s Climate Change
Ritu Bharadwaj is a senior researcher in the Climate                        Group
Change Group, International Institute for Environment and
                                                                            The Climate Change Group works with partners to help
Development (IIED).
                                                                            secure fair and equitable solutions to climate change by
Dr Somnath Hazra is a consulting economist and visiting                     combining appropriate support for adaptation by the poor in
faculty, School of Oceanographic Studies, Jadavpur University,              low- and middle-income countries, with ambitious and practical
Kolkata, India.                                                             mitigation targets. The work of the Climate Change Group
                                                                            focuses on achieving the following objectives:
Mohan Reddy is a national consultant in the Climate
Change Group, International Institute for Environment and                   • Supporting public planning processes in delivering climate-
Development (IIED).                                                           resilient development outcomes for the poorest
Shouvik Das is a PhD researcher, School of Oceanographic                    • Supporting climate change negotiators from poor and
Studies, Jadavpur University, Kolkata, India.                                 vulnerable countries for equitable, balanced and multilateral
                                                                              solutions to climate change, and
Daljeet Kaur is a climate and environment advisor for the UK’s
Foreign Commonwealth and Development Office (FCDO).                         • Building capacity to act on the implications of changing
                                                                              ecology and economics for equitable and climate-resilient
Corresponding author: Ritu Bharadwaj, ritu.bharadwaj@iied.org
                                                                              development in the drylands.

Acknowledgements
We thank FCDO for funding this research under the
Infrastructure for Climate Resilient Growth (ICRG) programme.
We also thank Niti Aayog (Planning Commission), Government
of India, Ministry of Rural Development, Government of India
and FCDO India for their advice, support and guidance.
We would further like to thank Clare Shakya, IIED and Simon
Addison, IIED for their guidance and support; Dr Sam Barrett,
IIED and Dave Steinbach, consultant, for their input in research
methodology and Ally Renton, IIED, for coordination support.
Our special thanks to the peer reviewers of this paper,
Dr Ricardo Safra de Campos, lecturer in human geography,
Global Systems Institute, University of Exeter, Dr Tuhin Ghosh,
director, School of Oceanographic Studies, Jadavpur University
and Rajesh Ramakrishnan, climate change resilience expert.

Published by IIED, October 2021
Ritu Bharadwaj, Somnath Hazra, Mohan Reddy, Shouvik Das
and Daljeet Kaur (2021) Connecting the dots: climate change,
migration and social protection. IIED Working Paper, IIED,
London.
http://pubs.iied.org/20591IIED
ISBN: 978-1-78431-931-1
Printed on recycled paper with vegetable-based inks.
International Institute for Environment and Development
235 High Holborn, Holborn, London WC1V 7DN, UK
Tel: +44 (0)20 3463 7399
www.iied.org
  @iied
  www.facebook.com/theIIED
Download more publications at http://pubs.iied.org/
IIED is a charity registered in England, Charity No.800066
and in Scotland, OSCR Reg No.SC039864 and a company
limited by guarantee registered in England No.2188452.
                     IIED publications may be shared and republished in
                     accordance with the Creative Commons Attribution-
                     NonCommercial-NoDerivatives 4.0 International
Public License (CC BY-NC-ND 4.0). Under the terms of this licence,
anyone can copy, distribute and display the material, providing that they
credit the original source and don’t use it for commercial purposes
or make derivatives. Different licences may apply to some illustrative
elements, in which instance the licence will be displayed alongside.
IIED is happy to discuss any aspect of further usage. Get more
information via www.iied.org/Creative-Commons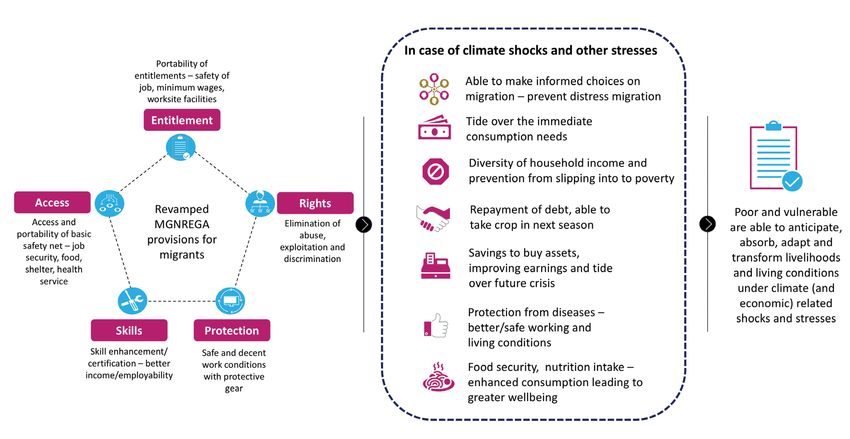
IIED Working paper

There are several aspects of climate-induced
short-term or circular migration, especially in
combination with other socioeconomic factors,
that are not fully understood. Without reliable data
on the pattern of circular migration, policymakers
can not recognise or address migrants’ needs,
issues and vulnerabilities. This paper provides
an understanding of what drives migration, the
patterns associated with it, and its issues and
consequences. It also gives broader policy
recommendations on how to use social protection
programmes to provide a safety net for migrants,
both at source for family members staying back and
at destination.

Contents
Summary                                        4   4 Strengthening climate resilience through
                                                    migration: conclusions and way forward             30
1 Context                                      8   4.1 Conclusions                                    30
1.1 What the statistics indicate, and the           4.2 Recommendations                                33
    problems with the numbers                 8
1.2 Social protection programmes: their role        References37
    in migration and climate resilience       10
                                                    Annexes                                      39
2 Research approach and methodology           12   Annex 1. T
                                                              ype of migration by the place of
                                                             residence39
3 Research findings                           14
                                                    Annex 2. Methodology                         41
3.1 Patterns of migration                     14
                                                    Annex 3. Binary logistic regression analysis 50
3.2 Perceived drivers of migration            18
                                                    Annex 4. M
                                                              igration attitudes and impacts in
3.3 Underlying drivers of migration           20            Uttar Pradesh, Madhya Pradesh and
3.4 Issues and consequences of migration      24            Rajasthan                           55
3.5 MGNREGA as an alternative to migration    26
3.6 MGNREGA to support or enable migration    28

                                                                                         www.iied.org    3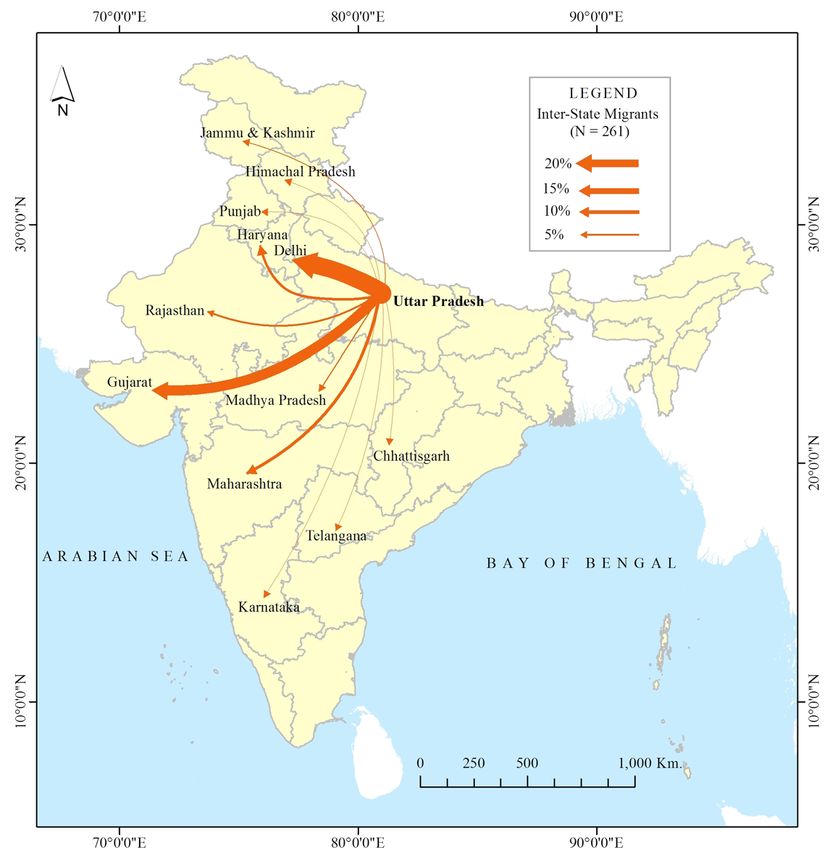
Connecting the dots | Climate change, migration and social protection

Summary
Background                                                  There are several aspects of climate-induced short-
                                                            term or circular migration, especially in combination
The agriculture-based seasonal nature of employment         with other socioeconomic factors, that are not fully
in rural areas in India means that communities may          understood. Without reliable data on the pattern of
not have year-round livelihood options. People are          circular migration, policymakers will not recognise
forced to migrate from rural to urban areas in search       migrants’ needs, issues and vulnerabilities, and these
of employment because they do not have enough               may not be addressed through social protection
savings to meet their consumption needs. ‘Migrarian’        programmes. It is also important to understand the
(migration and agriculture) livelihoods now form a          vulnerability of those left behind. Policymakers need
crucial part of India’s economy (Sharma et al., 2014),      to know whether MGNREGA is supporting rural
and migration has become a significant livelihood           households and their migrant members to cope with
option across rural India (Singh, 2019). The Economic       both economic and climate crises.
Survey of India (2016–17) estimated that at least nine

                                                            Research approach and
million people migrated between 2011 and 2016 within
the country, most of them in search of work. These

                                                            objective
internal migrants contribute 10% to the country’s GDP
(UNESCO, 2019).
To reduce ‘distress migration’ from rural communities,      To give policymakers better insights into these issues,
the Government of India has a long history of running       IIED has researched the underlying drivers of migration,
safety net and adaptive social protection programmes.       patterns associated with it, issues and consequences
These aim to provide wage employment through public         of migration, and how to support migration so that it
works programmes during agriculture’s lean periods          helps the community build their resilience. We examine
or during climate extremes like droughts and floods.        whether migration should be allotted more centrality in
The Mahatma Gandhi National Rural Employment                MGNREGA guidelines — not to prevent it but rather to
Guarantee Act (MGNREGA) that guarantees 100                 help communities use its opportunities.
days of employment to every rural household in a year
                                                            The relationship between climate change stress and
is one such programme. It also has provision for 50
                                                            its impact on migration is complex to understand. It
days’ additional wage employments in areas effected
                                                            is very difficult to distinguish individuals for whom
by climate hazards like floods, cyclones, droughts and
                                                            climatic factors are the sole motivation for migration
so on under its MGNREGA scheme. The intention is
                                                            because several economic and sociopolitical
to create climate resilience and help the vulnerable
                                                            factors interplay with climate drivers to increase the
households cope and recover from these climatic
                                                            vulnerability of a household. This study has used
events. However, actual results show that MGNREGA
                                                            migration intention and a binary logistic regression
has been far from successful for several reasons,
                                                            model to understand the extent to which climate
including operational and administrative issues.
                                                            change and socioeconomic factors impact intention
Effective social protection programmes can provide          to migrate. In the study, migration intention has been
people with a safety net against distress migration. This   used as a proxy to measure the likelihood of future
is especially important as distress migrants may be         out-migration from the study areas. To understand how
at a disadvantage in the urban labour market and can        the decision to migrate is affected by climate change
be exploited. But we also need to understand that, for      and socioeconomic factors, 12 independent variables
many, migration serves as an opportunity, where they        were selected, covering climate-related parameters
would have otherwise fallen deeper into poverty traps.      and the household’s socioeconomic characteristics.
Migrants can earn higher wages in urban destinations,       Climate variables covered slow as well as rapid onset
allowing them to accumulate cash and buy assets back        events like drought, flood, heatwave and hailstorm. The
home to secure longer-term livelihoods and exit from        severity of each event as scored by the household was
intergenerational poverty.                                  used in the regression model as the main independent

4   www.iied.org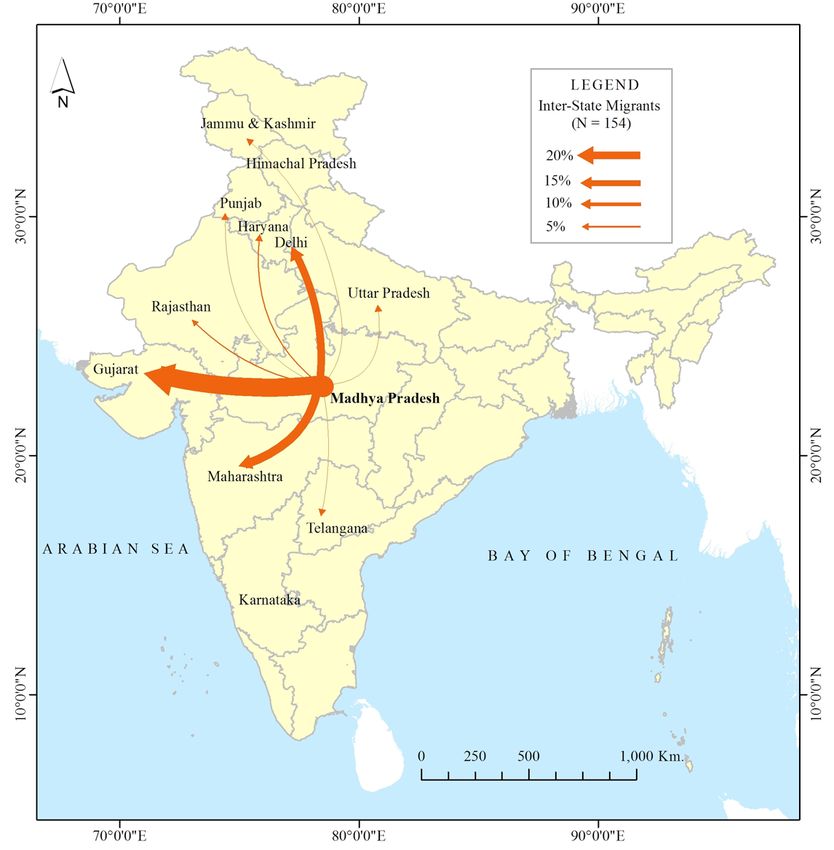
IIED Working paper

variable. Household size, household income, age,                           (i) Climate-related events
sex and level of education were covered under the
                                                                           Drought: The alarming increase in the frequency of
socioeconomic variables.
                                                                           droughts is a common trend in all the three drought-
Primary household surveys of 1046 households across                        prone states. More than 70% of the households in
three Indian states, Rajasthan, Uttar Pradesh and                          study regions said that the frequency of droughts had
Madhya Pradesh, and 48 focused group discussions                           increased significantly in the last 5–10 years. Results
were carried out across sample villages. Out of                            indicate that households exposed to drought are 1.157
surveyed households, 27.4% were Scheduled Caste                            times as likely as those who are not exposed to have the
(SC), 36.4% were Scheduled Tribe (ST) and 32.9%                            intention to migrate.
were from Other Backward Class (OBC).1 Three
                                                                           Flood: Uttar Pradesh had experienced significant
regression models were run for the study. The first
                                                                           flooding in the last 10–15 years. During monsoons,
model (Model 1) examined the relationship between
                                                                           heavy rains regularly flood villages on the riverbanks.
socioeconomic vulnerabilities and migration intention.
                                                                           Households that are exposed to flood are 1.419 times
The second model (Model 2) examined the relationship
                                                                           as likely as those who are not exposed to have the
between vulnerabilities due to climate change stress
                                                                           intention to migrate.
and migration intention. The third model (Model 3)
analysed the nexus between socioeconomic and
climatic factors on migration intention.
                                                                           (ii) Socioeconomic variables
                                                                           Household size: The size of the household also

Findings
                                                                           determines how a household is able to manage in times
                                                                           of climate-related events. The larger the household
                                                                           size, the more vulnerable they may be in times of a
Patterns of migration. Of households surveyed,
                                                                           climate crisis. On the other hand, larger households
37% have had at least one member migrate in the past.
                                                                           might be able to easily send one of their members on
The percentage is highest in Uttar Pradesh (50%),
                                                                           migration. The OR of 1.153 suggests that household
followed by Madhya Pradesh (34%) and Rajasthan
                                                                           size increases the intention to migrate by 15%. To
(28%). Migration from the three states is predominantly
                                                                           enhance climate resilience outcomes, social protection
seasonal (61.4%). Males mostly migrate to major cities
                                                                           programmes will need to tailor their provisions by
and different states once or twice a year, depending
                                                                           taking the current and future demographic trends into
on climate situation. Low returns or failure of existing
                                                                           consideration.
livelihoods of agriculture and fisheries trigger seasonal
migration. Seasonal migrants usually go to major cities                    Age of household head: Higher incidence of male
in Maharashtra or Gujarat, or to Delhi. They normally                      migration occurs in the age group of 21–30 compared
work in brick kiln, construction sites or cotton fields                    to other age categories. Results indicate that an
of neighbouring states like Maharashtra and Gujarat.                       increasing age of the household head decreases the
Migrants send remittances once every month or every                        intentions to migrate (OR = 0.981). Older populations
two to three months. Remittances have improved                             are less inclined to migrate. As the migration options
migrant households’ standard of living by enabling                         and mobility of older household members reduce, the
them to pay for daily consumption, healthcare and                          social protection programmes will need to consider
education bills.                                                           provisions that provide them with adequate coverage at
                                                                           village level during the climate crisis.
Drivers of migration — climate acting as a stress
multiplier to socioeconomic factors. Of the total                          Education: The educational level of the household
surveyed households (1046), more than two thirds                           head plays an important role in their welfare and
(70%) of the respondents indicated that drought/                           determines the level of information available and
irregular rainfall is a significant stressor. In addition, 23%             capacity to prepare for climate-related events. Male
of households mentioned flood as a significant stressor,                   migrants with primary and secondary education migrate
while 8.3% mentioned hailstorms.                                           more than those with higher education. Household
                                                                           heads with no education have more intention to migrate
Odds ratio (OR) in regression analysis is a measure of
                                                                           than those with secondary (OR = 0.654) and higher
association between exposure and an outcome. An OR
                                                                           secondary (OR = 0.542).
of one means that there are no higher or lower chances
of the outcome happening. An OR above one means
that there is a greater likelihood of the outcome and an
OR below one means that there is a lesser likelihood of
the outcome.

1
  Scheduled Castes (SCs), Scheduled Tribes (STs) and Other Backward Class (OBC) are among the most disadvantaged and marginalised socio-economic
groups in India. The terms are recognised in the Constitution of India and the groups are designated in one or other of the categories.

                                                                                                                                   www.iied.org    5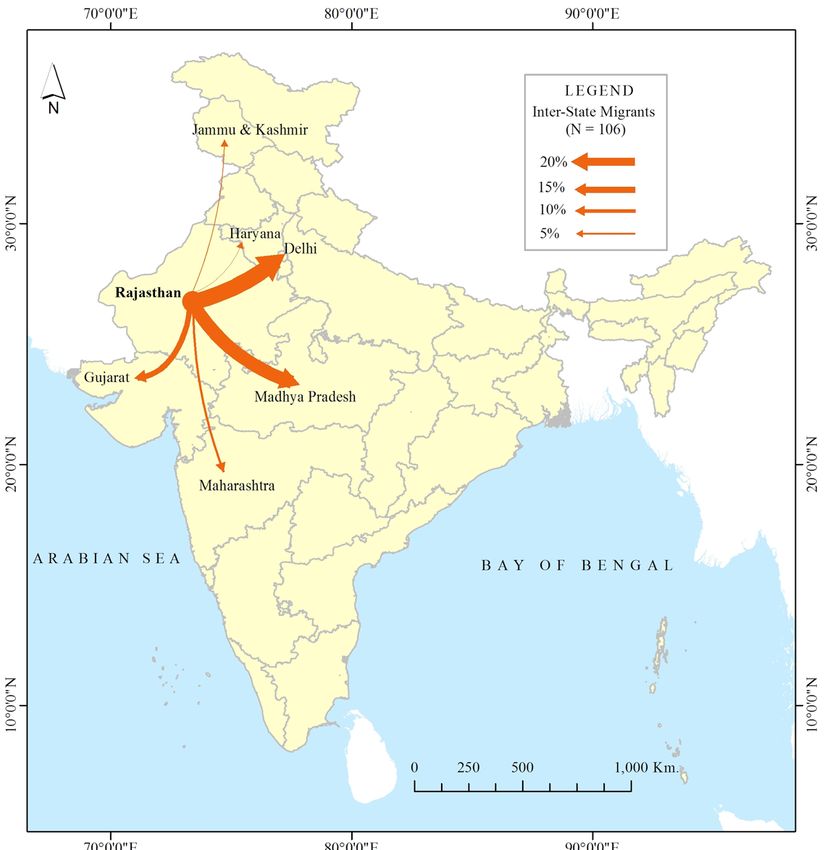
Connecting the dots | Climate change, migration and social protection

Migration networks: These are sets of interpersonal          (iv) The push and the pull factors
ties and links that a household or individual may have
                                                            Migration is becoming increasingly important for
with existing migrants, former migrants, and non-
                                                            climate resilience. Migration is becoming established
migrants in origin and destination sites, which makes
                                                            as a household adaptation strategy to cope with climate
migration easier. These networks provide information
                                                            and economic stresses in survey areas. During climate
and support on place of stay, employment and access
                                                            distress, when slow-onset events such as drought
to basic services at the destination site, encouraging
                                                            threaten natural resource-based livelihoods such as
people to migrate. Results reveal that migration
                                                            agriculture, livestock and fishery, people’s ability to earn
networks increase the intention to migrate by more than
                                                            a living is compromised. This motivates them to consider
50% (OR = 1.514).
                                                            migration in search of better economic opportunities.
Gender dynamics: In case of female migrants, the            Similarly, when rapid-onset hazards such as hailstorms
decision to migrate is dependent on the household           or floods damage crops, cultivable lands and property,
head. In 90% of the villages, there is no family migration, communities may have little or no options for adapting in
and it is mostly one or two adult members of the family     situ. Under such situations, migration is the only viable
who migrate. Migration of the whole family was mainly       option for survival. Overall, 69.74% households across
seen in Barwani district of Madhya Pradesh. The land/       all three states reported that they migrate immediately
house and livestock ownership of the family usually         after drought, flood, hailstorms or heatwaves occur.
restricts the entire family from migrating. Children’s
                                                            Migration has negative consequences as well as
education is also one of the reasons. Females have
                                                            benefits. Whilst migration can give rise to economic
to take on the additional responsibilities of managing
                                                            benefits, there are other social consequences, both
the household and livestock, and mostly work
                                                            for the migrants and the families (mostly women,
under MGNREGA.
                                                            children and elderly) that are left behind. Migration
(iii) State-wise results of the regression has                    many costs and risks associated with it that are
                                                            difficult for poor and vulnerable people to cope with.
model                                                       Migration leads to breaking up of families and affects
                                                            gender roles. The migrant-receiving areas are often
Rajasthan: The results explain 33% of the variation
                                                            inadequately prepared to accommodate migrants and
in the data. Household size, age of household
                                                            often lack basic shelter and sanitation facilities and
head, income and migration network are significant
                                                            can’t guarantee women’s safety. Where migrants live
socioeconomic variables that effect natural resource-
                                                            in unsanitary conditions they are exposed to more
based livelihoods and migration decision making. But
                                                            disease. Labour and workplace safety laws are widely
drought has a positive effect on intention to migrate
                                                            disregarded. Migrants are often forced to overwork,
(OR = 1.112). It can be said that both climate and
                                                            are paid less than non-migrants, and are exposed to
socioeconomic factors play a role in migration
                                                            polluting working conditions. Moreover, they do not have
decision making in Rajasthan.
                                                            any employment security.
Uttar Pradesh: The results explain 29.8% of the

                                                             Recommendations
variation in the data. While socioeconomic variables like
household size, age, education, income and migration
network are important, the model reveals that exposure
                                                            Results show that social protection programmes in
to drought (OR = 1.941), flood (OR = 1.001) and
                                                            their current form will not work unless they consider
hailstorm (OR = 2.115) act as ‘stressors’ and drive
                                                            climate stress in their design framework and include
individuals/households to consider migration as
                                                            climate resilience as one of its outcomes. Revamping
a survival strategy in Uttar Pradesh.
                                                            MGNREGA would help it achieve its full potential.
Madhya Pradesh: The results explain 11% of the              Underlying operational inefficiencies and challenges
variation in the data. The model shows that exposure to need to be addressed. It also needs to change to help
drought has a positive effect on intention to migration,    migrants deal with the challenges they face at migration
but socioeconomic factors play a more important             destination sites. Some recommendations to help
role in migration decision making in Madhya                 MGNREGA achieve this are:
Pradesh.
                                                            Breaking the rural–urban silos. MGNREGA needs
The model empirically and statistically proves              to reconsider the current limiting of benefits to people
that climate impacts act as stress multipliers,             who remain in their native village. Workers who undergo
particularly for those who are already                      climate-induced distress migration or displacement are
socioeconomically vulnerable, driving them                  left without social protection and often have to live and
towards distress migration.                                 work in sub-human conditions for survival; devoid of
                                                            any rights, benefits or entitlements. At the same time,

6   www.iied.org
IIED Working paper
not everyone is able to move out. Women, children Broadening the focus. There is a need to broaden
and people from marginalised communities may be the focus of MGNREGA from being a purely natural
left in straitened circumstances that exacerbate their resource management-based approach to one that
vulnerability. If the migrant worker cannot send back also emphasises human resource development. It must
money, they can be particularly hard hit. Government recognise the multi-locational nature of livelihoods and
policy response needs to extend rights and social safety provide communities with adequate means, resources
net provisions to migrant workers in the destination sites and information to enable them to make informed
through MGNREGA in convergence with other social choices. MGNREGA should not seek to limit people
protection schemes. to rural areas. The scheme needs to recognise that
migration is people’s own effort to access employment
Strengthening MGNREGA in migration source
and should explicitly recognise migration’s central
areas. MGNREGA needs to provide a steady source
role in protecting and promoting rural livelihoods.
of income and livelihood security for the poor and the
Policymakers should:
marginalised, so that it can act as an essential means
for coping with climate shocks. Our research shows that • Develop a clear comprehensive framework that
families and individuals undertook distress migration integrates migration into the MGNREGA’s operational
when they perceived that there was no other option to guidelines, so that it does not lose priority.
survive. For these people, MGNREGA did not act as a
• Give due emphasis to developing human capital
viable safety net. Administrative delays in sanctioning
through skill development, focusing on landless
work and lack of transparency and delays in wage
people or those with limited access to land and other
payments are some of the reasons that families do
natural resource-based livelihoods.
not consider MGNREGA as a fallback option during
crisis. Having only 100 days of work guaranteed per • Expand the scheme’s safety net to address the
year at most, and with comparatively lower pay than vulnerabilities of both migrants and those who stay
urban wage rates, does not help. Migrants feel they will behind. The entitlements for 100 days of work should
be able to sustain their families better if they migrate, not just lie with the household members who remain
even though it exposes them to hardship at destination in the village but should also cover the migrant
sites. Respondents in the research areas across the family member.
three states came up with many suggestions on how
• Develop effective strategies for convergence with
MGNREGA can be strengthened. While some of
other schemes/programmes on housing, health and
these pertained to improving the existing programme’s
education in order to provide comprehensive cover.
delivery in terms of timely work availability and wage
payments, others relate to revising the scheme, such • Increase the bargaining capacity of the rural workers
as by increasing the minimum guaranteed days of to demand decent working conditions and wage rates.
employment. These deserve careful consideration
by government.
Making workers migration ready and creating safe
pathways. Most migrants have little or no education
and fall broadly under the category of unskilled workers.
But with rising standards in industry (Make in India;
Zero Defect Zero Effect2) and large construction/
infrastructure projects, the demand for skilled jobs
has gone up, creating a mismatch between the skills
of labour supply and demand. There is a need to carry
out a national-level mapping of the skill requirement
in major destination sites and to develop a systematic
programme for skill enhancement matching those
requirements, complementing this with certification and
placement services.
2
“Zero Defect Zero Effect” policy is being promoted by the Government of India and it signifies two things: production mechanisms wherein products have no
defects and production processes which have zero adverse environmental and ecological effects.
www.iied.org 71
Connecting the dots | Climate change, migration and social protection
Context
Perhaps more than any other country, India needs The COVID-19 pandemic emerged as an eye-opener
to prepare for climate migration. With a population for the policymakers where migration populations go
of 1.3 billion, high dependence on agriculture, and unnoticed in climate change adaptation plans and other
270 million people living on less than US$1.90/day developmental planning (Cundill et al., 2021).
(Ahmed et al., 2021), India is probably one of the
1.1 What the statistics
countries most vulnerable to climate change. The
Global Climate Risk Index 2021 ranks India the seventh
most vulnerable country based on 2019 data (Eckstein
et al., 2020). A significant proportion of its poor, indicate, and the problems
including smallholder farmers and landless agricultural
workers with low adaptive capacity, will be hit hard by with the numbers
increasing climate variability, which will damage crops
The Economic Survey of India (2016–17) estimated that
and livelihoods.
at least nine million people migrated between states
Internal migration as a subsistence strategy is already within the country every year for either education or
on the rise. Around 200 million rural people already use work. That’s almost double the inter-state migration
short-term circular migration as a livelihood strategy: recorded in 2001–2011.
15.38% of India’s total population (Desai et al., 2015).
Internal migrants contribute 10% to the country’s
Rising rural distress and urban economic growth3
GDP (UNESCO, 2019). The National Sample Survey
makes migration from rural to urban areas inevitable.
Organisation (NSSO) data from 2007–08 revealed that
Climate change will further drive this migration.
about 28.3% of the workforce in India are migrants.
This trend and broad generalisation may not be true It counts short-term migrants as those who have not
in all circumstances. Not all rural areas will be a stayed in their “usual place of last residence” for
source of out-migration, and similarly not all cities will between one and six months, and so will miss some
be in-migration hotspots. Reverse migration during short-term migrations.
COVID-19 lockdowns and urban floods in the past
According to the decennial 2011 census, the data on
years demonstrate that Indian cities are vulnerable. Their
migration by place of last residence in India shows
unplanned and rampant expansion will make them more
that the total number of migrants is 454 million
susceptible to climate change’s effects.
(considering all durations of residence) of which 141
Nevertheless, rural–urban migration will increase in million (31.06%) are men and 313 million (68.94%) are
the future as agriculture-dependent livelihoods come women. Among women, marriage is the most important
under increasing climatic stress. Urban (and peri-urban) reason for migration (Census, 2011).4 This count is
areas will continue to support growing numbers of likely to miss a significant number of short-term ‘circular’
people via rapid urbanisation and infrastructure growth. migrants, because they have as much of a chance of
3
India’s urban population of 377 million in 2011 is projected to almost double to 820 million in 2050.
4
https://censusindia.gov.in/Data_Products/Data_Highlights/Data_Highlights
8 www.iied.orgIIED Working paper
being counted in their place of birth or last residence India. The state-wise migration patterns can be seen in
as they do at their new destination.5 This was a change Annex 1.
implemented since the 2001 census, which did not use
Overall, official statistics tend to underestimate
a minimum length of stay at the new residence to define
temporary migration, and the NSSO and the Census
a migrant. Even so, this number was 314.5 million in the
will need more robust definitions if they are to capture
2001 census. In other words, it increased by over 44%
short-term migration. The India Human Development
between 2001 and 2011.
Survey (IHDS) provides more accurate data on the
About 161 million people (over 35%) have migrated circular migrants. It estimated there were over 200
during the past decade (ie a duration of 0–9 years). million in 2011–2012. That is more than ten times
Among women, marriage is the most important reason the 15.2 million short-term migrants estimated by the
for migration. For men, the most important reason 2007–08 NSSO.
is work. More than 15 million out of over 56 million
Migrant workers are often employed in construction,
male migrants (27%) moved for better employment
brick kilns, stone quarries and carpet weaving, and as
opportunities during the decade (Census, 2011).
street vendors, waiters in hotels and so on. (Ashok and
Education is another important reason for both male and
Thomas, 2014). India’s brick kilns employ between ten
female migration in various parts of India. The data also
and 23 million workers (NSSO, 2009–10; Anti-Slavery,
shows that 15 million men/boys and 20 million women/
2017). These workers are vulnerable to exploitation
girls moved with their households in the last decade.
because they often take out a high upfront loan from a
This movement is mostly from rural to urban areas and
labour contractor. This ‘middleman’ then employs them,
from smaller towns and cities to larger urban areas in
taking repayments from their wages, which exposes
Table 1. Patterns of migration in India, as recorded by the 2011 census
In millions
Class of migrants Total Male Female
All durations of residence6 453.64 140.96 312.68
Duration of residence 0–9 years (2001–2011) 161.42 56.76 104.66
Reasons Work/employment 18.69 15.48 3.21
Business 1.31 0.96 0.36
Education 5.15 3.00 2.15
Marriage 60.18 1.49 58.68
Moved after birth 20.93 10.99 9.95
Moved with household 35.54 15.25 20.29
Others 19.62 9.59 10.03
Patterns Rural–rural 69.10 15.70 53.40
Urban–rural 11.46 4.71 6.74
Rural–urban 32.16 15.03 17.12
Urban–urban 32.95 15.05 17.90
Note: All durations of residence include ‘unspecified duration’.
Data source: Migrants by place of last residence, age, sex, reason for migration and duration of residence, Census of India, 2011
5
The definitions adopted by the NSSO and the census are unlikely to result in reliable estimates of short-term migration. The census defines a migrant as a
person residing in a place that is different from his or her place of birth or “usual place of last residence”, where the latter refers to place of residence for six
months or more. This is likely to miss a significant number of short-term migrants who have as much of a chance of being counted in their place of birth or last
residence as they do at their new destination. The 2007–08 National Sample Survey (NSS) counts short-term migrants as those who have not stayed in their
“usual place of last residence” for a period of between one month and six months.
6
Duration 20 years and above https://censusindia.gov.in/Data_Products/Data_Highlights/Data_Highlights_link/data_highlights_D1D2D3.pdf
www.iied.org 9Connecting the dots | Climate change, migration and social protection
them to exploitation and debt bondage (Anti-Slavery, gain skills and establish themselves, they may bring
2017). The top destination for migrants is Delhi, followed their family members, including their spouse, to their
by Mumbai, however the southern states have also workplace (CARIAA, 2019). So, for many, migration
become a major destination for migrants in recent serves as an opportunity, where they would have
years. The main source areas are Uttar Pradesh (UP), otherwise fallen deeper into poverty traps. But it is a
Bihar, Madhya Pradesh (MP), West Bengal and Assam. risky strategy, as although migration can bring more
Migrants to the southern-most state of Kerala travel money, migrants have no social security to protect their
more than 3,000 kilometres. incomes if they lose their jobs.
To reduce distress migration, the Government of India
1.2 Social protection has a long history of running ‘safety net’ and adaptive
social protection programmes. These aim to help rural
programmes: their role communities increase agriculture productivity, develop
alternative livelihoods and obtain wage employment
in migration and climate through public works programmes during agriculture’s
resilience
lean periods or during climate extremes like droughts
and floods. Some of the recent programmes are the
Mahatma Gandhi National Rural Employment Guarantee
The agricultural and seasonal nature of rural
Act (MGNREGA), Pradhan Mantri Awas Yojana Gramin
employment means that communities may not have year-
(PMAYG), the National Social Assistance Programme
round livelihood options. People’s limited savings force
(NSAP), the Integrated Watershed Management
them to migrate in search of employment. Migration
Programme (IWMP), Jal Jeevan Mission (JJM), and
has become a significant livelihood option across rural
National Rural Livelihoods Mission (NRLM). Their
India (Singh, 2019). With declining agricultural incomes
objectives are detailed in Table 2. But they do not
and rural households’ inability to sustain themselves
adequately address seasonal migration7 or distress
with farming alone, ‘migrarian’ livelihoods (migration
migration8 (Neupane et al., 2016).
and agriculture) form a crucial part of India’s economy
(Sharma et al., 2014). At household level, migration
acts as an adaptation strategy for the poor to cope with
climate, environmental and economic stresses. But Box 1. Circular migration
migration disrupts family units (Ratha et al., 2011), and
exploitation by middlemen can restrict or even nullify
is the dominant trend
migrants’ earnings. Disease and ill-health add to the for poorer groups
risks of migration. The death of a sole earning member
Permanent migration is more common in educated
can put the entire family in hardship (Deshingkar and
groups seeking better livelihood options. In contrast,
Start, 2003).
short-term seasonal migration is common among
Effective social protection programmes can mitigate the people with little or no education who take on
pressures of distress migration by providing people with unskilled jobs at destination sites. These migration
local livelihood options if they do not want to migrate. trips vary in length from two to six months and
This is especially important as ‘distress migrants’ may have become an integral livelihood option for
be most disadvantaged in the urban labour market and a large section of the rural poor, particularly in
may be exploited. agriculturally underdeveloped regions. People
migrate to urban destinations, industrial clusters/
We also need to understand that those who stay back
zones, into unorganised sectors such as stone
may not be better off compared to those who leave.
quarries, brick kilns, construction sites and so on,
Migrants may earn higher wages in urban destinations,
and to more productive agriculture areas. However,
allowing them to accumulate cash and buy assets back
migrants usually opt for non-farm employment as
home to secure longer-term livelihoods and exit from
this yields greater returns and remittances, which
intergenerational poverty, whereas if they stay back
play important roles in improving their overall
they may face food security issues and find it difficult
household budgets.
to make ends meet. Migrants are often initially unskilled
but develop their skills while at their jobs. Once they
7
A migrant worker whose work or migration for employment is, by its character, dependent on seasonal conditions and is performed only during part of the year
(Glossary on Migration, International Organization for Migration: https://publications.iom.int/system/files/pdf/iml_34_glossary.pdf).
8
All migratory movements made in conditions where the individual and/or the household perceive that the only viable livelihood option for moving out of poverty
is to migrate. Such distress is usually associated with lack of livelihood options, given the limited economic and employment opportunities, as well as drought,
crop failure and food insecurity (FAO’s definition cited in Avis, 2017: http://www.gsdrc.org/wp-content/uploads/2017/04/HDR1406.pdf , page 8)
10 www.iied.orgIIED Working paper
Table 2. Social protection programmes in India that provide local employment and help people develop alternative livelihoods
Schemes Objectives
Mahatma Gandhi National Rural Provides 100 days of guaranteed wage employment annually per
Employment Guarantee Scheme household in rural areas when demanded
(MGNREGA)
Pradhan Mantri Awas Yojana Provides houseless people and those living in dilapidated houses with
Gramin (PMAYG) financial assistance for constructing a durable house
Integrated Watershed Public works to conserve and develop degraded natural resources like soil,
Management Programme (IWMP) vegetative cover and water
Jal Jeevan Mission (JJM) Provides safe and adequate drinking water through individual household
tap connections
Pradhan Mantri Krishi Sinchayee Expands area under assured irrigation, improves on-farm water use
Yojana (PMKSY) efficiency, promotes water-saving technologies
National Mission for Sustainable Improves productivity, sustainability, profitability and climate resilience of
Agriculture (NMSA) agriculture by promoting location-specific integrated farming systems
National Rural Livelihoods Mission Creates efficient and effective institutional platforms for the rural poor,
(NRLM) enabling them to increase household income and improve access to
financial services.
Mahila Kisan Sashaktikaran Improves capacities of women in agriculture to access the resources of
Programme (MKSP) various institutions and government schemes
Prime Minister’s Employment Promotes employment opportunities through micro-enterprises in rural and
Generation Programme (PMEGP) urban areas
Earlier schemes like Sampoorna Gramin Rozgar Yojana climate hazards like floods, cyclones, droughts and so
(SGRY) and the National Food for Work Program on. The intention of creating MGNREGA was to create
(NFWP), which paid wages in the form of cash and climate resilience and help vulnerable households cope
as food grain, were welcomed by the rural poor, as and recover from such events.
they provided much-needed food security. But these
Policymakers saw MGNREGA as an answer to distress
schemes faced severe supply bottlenecks, struggled
migration and climate impacts. However, it has not lived
to keep food grains available when needed, suffered
up to expectations. Low wage rates, delayed payments,
leakages (corruption) and did not give local people
leakages, lack of assured work, and administrative
a role in planning what assets would be created
delays in declaring drought (and so delays in providing
through wage labour. At most, they generated 40 to
employment during critical times) have all undermined
50 days of wage employment per year. This was not
its success. A study across rural India revealed that
enough to alleviate distress migration. Then came
MGNREGA works still don’t overcome long-term
the Mahatma Gandhi National Rural Employment
employment losses or adequately address distress
Guarantee Act (MGNREGA). It guaranteed 100 days of
migration. Besides, migration has the allure of higher
employment to every rural household per year. Regular
urban pay (Neupane et al., 2016) compared with
agricultural operations usually provide 150–180 days
MGNREGA wages.
of employment, so MGNREGA is important in helping
to fill the shortfall. The programme can also provide 50
days additional wage employment in areas affected by
www.iied.org 112
Connecting the dots | Climate change, migration and social protection
Research approach
and methodology
There is mounting evidence that migration can reduce supporting its advantages with basic entitlements
poverty and inequality, and contribute to climate risk and rights such as a minimum wage, decent working
management — it is increasingly being recognised as an conditions, or work site facilities at preferred migrant
important development and resilience strategy (Kothari, destinations?
2002; Deshingkar, 2006; Skeldon, 2005; Deshingkar
The key research questions explored through this
and Akter, 2009; Hagen-Zanker et al., 2017; Bharadwaj
study are:
et al., 2021). In this, the efficacy of MGNREGA is
important in mitigating pressures of distress migration. 1. What are the patterns of migration?
However, there are several aspects of climate-
2. What are the underlying drivers of migration?
induced short-term or circular migration, especially in
combination with other economic factors, that are not 3. What are the issues and consequences of migration
fully understood. Without reliable data on the pattern faced by communities?
of circular migration, policymakers can not recognise
4. Does MGNREGA act as an alternative to migration
or address migrants’ needs, issues and vulnerabilities.
within the village?
Even where distress migration occurs, it is also
important to understand whether and how MGNREGA 5. How can MGNREGA be used to support or enable
or similar programmes help those left behind tackle migration?
economic or climate crises.
This study uses a household’s migration decision-
This research aims to understand what drives making methodology to explore patterns of migration.
migration, the patterns associated with it, and its In addition, it considers avoided losses from climate
issues and consequences, and provide broader policy hazards and gains from adaptive social protection
recommendations to the MGNREGA programme to schemes to understand households’ future migration
harness migration’s advantages to help the community intentions and past migration trends (Black et al., 2011;
build resilience. Adger et al., 2021).
The paper will help policymakers understand the For any household, the decision to migrate involves
complexity and diversity of migration — and so ensure weighing up risks from environmental degradation
that MGNREGA interventions are optimal, inclusive, and or resource scarcity as well as demographic and
fine-tuned to suit different communities and areas (both socioeconomic factors. Our migration decision model
destination and source sites of migration). therefore encompasses all perceptions relating to
the current situation, perceptions of future situations,
It also investigates whether migration should actually
and what migrants expect to achieve in potential
be encouraged within MGNREGA guidelines. Could
destinations. People’s expectations for the future
MGNREGA facilitate, rather than prevent, migration,
depend on the uncertainty of environmental quality and
12 www.iied.orgIIED Working paper
climate variability. Hence the environmental quality has We focused on perceptions of how environmental
also been integrated in the decision to migrate. changes affect households’ economic security because
these capture issues such as loss of income, assets or
The unit of analysis is the household in three Indian
livestock that bring about disruptive changes to land use
states, Madhya Pradesh, Rajasthan and Uttar Pradesh,
or livelihoods. We first asked the respondents to answer
which are some of the Infrastructure for Climate
if, over the past five years, they had experienced any
Resilient Growth (ICRG) programme focus states.
changes in rainfall, temperature, flooding and drought.
These states have witnessed a higher frequency of
We then asked the respondents about the impact
droughts and expansion of drought-affected areas since
of these environmental hazards on their household’s
1950. While climate models project an increase of mean
economic security (for example damage to crops,
monsoon rainfall in the future, they concurrently project
livestock, assets/equipment and loss of income). We
an increase in the occurrence, severity and area under
also considered various socioeconomic factors that
drought (Krishnan et al., 2020).
affect migration decisions. These were chosen based
Each surveyed household resides within a rural setting on a review of previous empirical research and were:
where the main livelihoods have multiple points of
• Household size
climate sensitivity, especially relating to agriculture and
livestock. We focused on the household as the unit of • Age of the head of the household
primary decision making for migration and considered
• Education level
a household as engaged in migration when at least one
member had moved to another place of residence in • Main livelihood occupation of the head of the
the last two years. We modelled the intention to migrate household
based on a sampling design of migration-engaged and
• Total household income
non-engaged households in the three focus states.
• Whether family members or friends had migrated
Our research explored: (1) how migration decisions
(ie did the household have information and a support
are made, (2) how different perceptions affect future
network to enable migration)
intentions, and (3) how climate and environmental
risks affect the decision. We examined how well • Loans taken
the intention to migrate in the future is explained by
• Dependency ratio: the number of children (aged
current perceptions of environmental degradation
0–14) or elderly people (dependents aged above 60).
and household insecurity associated with climate and
environmental risks. More details of the methodology, sampling profile and
analytical framework are provided in Annex 2 and 3.
The analysis used a binary logistic regression model
to explore how future migration intentions (measured
as yes/no answers to the question “Do you or
other household members intend to migrate in the
future?”) varied as a function of ‘perception variables’.
(De Jong et al., 1985, 1996, 2006; Mumuni et al.,2014;
Koubi et al., 2016).
www.iied.org 133
Connecting the dots | Climate change, migration and social protection
Research findings
3.1 Patterns of migration
indicates that it is mostly men who are migrating, and
that women are taking on additional responsibilities as
household heads.
A total of 1046 households were surveyed in the three
states, of which 37.0% have seen at least one member The dominant nature of migration from the three states is
migrate in the past. The percentage of such households seasonal10 (61.4%). Men mostly migrate to major cities
with migrants is highest in Uttar Pradesh (50.0%), and different states once or twice a year, depending on
followed by Madhya Pradesh (33.5%) and Rajasthan the season. Poor returns from agriculture and fisheries
(27.5%). trigger migration for alternative remunerative livelihoods.
More female-headed9 households were engaged Demographic factors are important in people’s decision
in migration than male-headed households, which making with regard to migration. More male migrants
Figure 1. Percentages of migrant households and non-migrant households in three states
80
72.46
66.47
70
60
Households (%)
50.00 50.00
50
40
33.53 27.54
30
20
10
0
Uttar Pradesh Madhya Pradesh Rajasthan
n Migrant household n Non-migrant household
9
The household head is the person who has the authority and responsibility for household affairs. If the usual household head has migrated, then the new head is
the person who has the most influence over household affairs in their absence, or who earns the most income.
10
Seasonal migration describes the movement of a household member(s) from the sending area based on seasonal conditions (adapted from World
Migration Report 2015). For the purposes of this survey, this movement is temporary (of less than six months’ duration) and carried out once or twice within a
12-month period.
14 www.iied.orgIIED Working paper
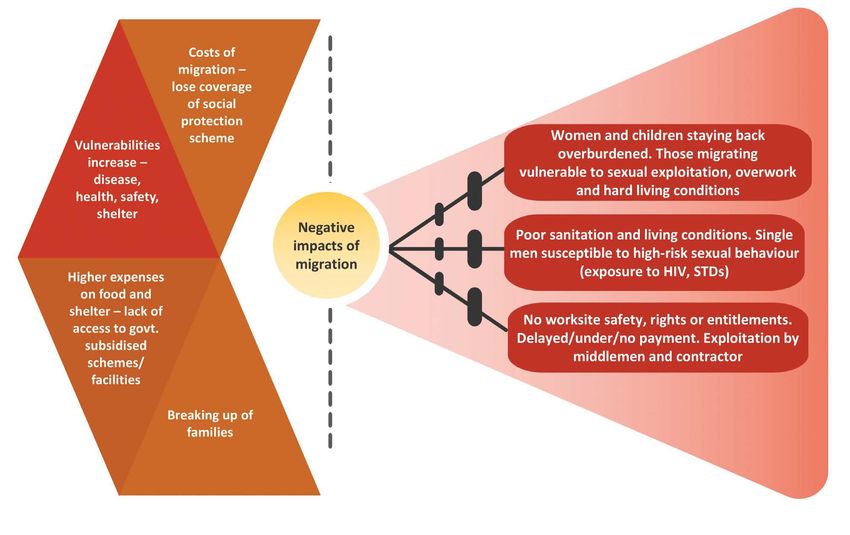
are aged 21–30 compared with other age groups. Migrants send remittances once every month or every
Furthermore, household heads with no education or two to three months. More than half of the remittances,
basic education have more intention to migrate than regardless of their frequency, are up to ₹5000. They
those with secondary and higher education. In the case are used in the village mainly to meet daily consumption
of female migrants, their intention is highly dependent on needs (food, daily necessities), and to some extent, for
the household decision. healthcare and education and to buy household goods
(household appliances, furniture and garments).
Most migrants move seasonally from the study areas to
major cities in Maharashtra, Gujarat and Delhi states
(see Figures 2, 3 and 4). Those migrating to other
rural areas usually work in brick kilns or cotton fields of
neighbouring states like Maharashtra and Gujarat.
Table 3. Patterns of migration from Uttar Pradesh, Madhya Pradesh and Rajasthan
Uttar Madhya
Pradesh Pradesh Rajasthan Total
Responses (% ) (%) (%) (%)
Type Seasonal migration 69.3 65.9 40.4 61.4
Frequency 1–2 times 95.5 91.3 97.2 94.7
Duration Less than 6 months 67.7 63.3 41.7 60.3
Scale Inter-state migration 37.6 23.1 32.2 32
Destinations District capital 22.8 27.9 51.7 31.1
State capital 2.2 3.9 10.6 4.7
Other state’s capital 37.6 23.1 32.2 32
Major city 37.3 45 5.6 32.2
Reasons First Seeking employment 94.4 95.2 90.6 93.8
Second Family obligations / problems 25.1 14 8.3 17.8
Third Drought 8.1 8.3 28.3 12.9
Remittances Type Money 67.7 59.4 47.8 60.5
Amount ₹5000 and below 51.4 46.3 61.6 51.8
Uses of Rank-1 Daily consumption (food, 94.7 97.1 82.6 93.1
remittances bills)
Rank-2 Healthcare 30.9 30.9 9.3 26.9
Rank-3 Household items (furniture, 14.8 29.4 18.6 19.8
TV, clothes etc)
www.iied.org 15Connecting the dots | Climate change, migration and social protection Figure 2. Inter-state migration from Uttar Pradesh Figure 3. Inter-state migration from Madhya Pradesh 16 www.iied.org
IIED Working paper

Figure 4. Inter-state migration from Rajasthan

Figure 5. Uses of remittances in the three states

                                                 Travel

                                         Saved money

                                     Loan repayments

    Equipment for livelihood (farm tools, fishing nets)

                                              Livestock

                         House construction or repair

                                            Healthcare

             Marriage, funerals and other ceremonies

                                             Education

          Household items (furniture, TV, clothes etc)

  Daily consumption (food, utility or other daily items)

                                                           0         20         40         60         80          100
                                                                                Households (%)
                                                           n Rajasthan  n Madhya Pradesh   n Uttar Pradesh

                                                                                                       www.iied.org   17
Connecting the dots | Climate change, migration and social protection
3.2 Perceived drivers of As many as 35% of respondents in Uttar Pradesh
reported that they were not working in their own villages
migration due to climate shocks. Lack of local livelihood options
and better income sources outside the village were
Almost 94% of households reported that the main the main reasons for people not working in their own
reason behind migration is economic, with most villages in Madhya Pradesh and Rajasthan.
migrants moving in search of better employment
The key information networks on employment
opportunities. The second most frequently mentioned
opportunities at destination sites are mainly family and
reason was family obligations (17.8%) (Table 4).
friends who migrate to these areas. Intermediaries
Female migrants mostly move to join their spouse or
setting up work and shelter are less prevalent.
for marriage.
Figure 6. Main reason for not working in villages
80
70
59.29
60 53.68
Households (%)
50 43.41
40 36.26 37.89
30 23.89
20.33
20 16.81
8.42
10
0
Climate shocks Lack of livelihood options Better income source
n Uttar Pradesh n Madhya Pradesh n Rajasthan
Figure 7. Reasons for preferring destination areas
80
70
61 63
60 55
Households (%)
50
40 33 33
30 27 25 27
20 17
12 10 14
10
2 3 0 1 1 0
0
Family members Friends live Middlemen are Better Better health Others
live there there there to help set employment services are
up work or opportunities available there
shelter are there
n Uttar Pradesh n Madhya Pradesh n Rajasthan
18 www.iied.orgIIED Working paper
Figure 8. Reasons for migration in three states
97 98
100 92
80
70
Households (%)
60
50
40 36
30 29
23
20 16
20
9
10 2 1 1
0
Economic Social Environmental Political
n Uttar Pradesh n Madhya Pradesh n Rajasthan
Although climate issues mostly act as a stress multiplier From the study on perceptions of environmental risks
to already existing socioeconomic and political factors, a as reasons for migration decision making, it emerged
small percentage of the respondents directly attributed that drought and land degradation act as ‘stressors’ and
the decision to migrate to an environmental stressor. motivate individuals/households directly to consider
migration as a survival strategy.
Table 4. Environmental reasons for migration
Percentage of households reporting
Uttar Madhya
Pradesh Pradesh Rajasthan Overall
Environmental reasons (%) (%) (%) (%)
Loss of income in one season 5.57 7.42 1.67 5.21
Loss of income in multiple seasons 1.11 5.24 2.22 2.60
Drought 8.08 8.30 28.33 12.89
Flood 0.00 0.44 0.00 0.13
Hailstorms/heatwaves/storms 0.00 0.87 0.00 0.26
Land degradation 1.67 0.44 3.33 1.69
Total 16.43 22.71 35.56 22.79
www.iied.org 19Connecting the dots | Climate change, migration and social protection
3.3 Underlying drivers of Migration intention is also driven by the respondents’
recollection of environmental changes (rainfall,
migration temperature) experienced within the most recent five
years, and the self-reported impact of environmental
Empirical literature suggests that household size, hazards (drought, flood, hailstorm, heatwave) on the
age, sex, the education of the household head and household’s economic security (loss of income, assets
household income all influence migration intention (De or livestock, bringing about disruptive changes to land
Jong et al., 2006; Mumuni et al., 2014; Tan, 2017). For use or livelihoods).
example, according to the literature, older individuals
More than 30% of the respondents reported that
are typically less likely to migrate and educated people
someone in their household intends to migrate in the
are more likely to do so. Social networks increase the
next two years. The average age of household heads
likelihood of migration to particular destination sites by
in the study areas combined is 44.59 years, which is
reducing the costs and risks associated with it.
younger than the national average age for rural India.
Table 5. Percentage distribution of variables known to influence the intention to migrate
Uttar Madhya
Variables Pradesh Pradesh Rajasthan Overall
Household member intends to migrate 40.90% 30.86% 20.87% 31.07%
Household size (mean) 4.91 5.05 5.02 4.99
Household head is male 78.00% 87.24% 76.20% 80.40%
Age of household head (mean) 44.7 44.89 44.18 44.59
Education of household head
No education 71.70% 62.90% 53.30% 62.80%
Primary education only 7.40% 8.60% 12.50% 9.50%
Secondary education 10.40% 15.10% 21.70% 15.70%
Higher education 10.40% 13.40% 12.50% 12.00%
Main livelihood of household head
Crop farmer 45.30% 83.70% 58.00% 61.90%
MGNREGA 35.70% 0.30% 22.30% 19.90%
Others 19.00% 16.00% 19.70% 18.30%
Household monthly income (₹)(mean) 5067.97 7902.78 5969.13 6278.52
Outstanding loan 21.70% 17.20% 18.80% 19.30%
Migration network 50.00% 33.50% 27.50% 37.30%
Drought 78.00% 49.30% 100.00% 76.00%
Flood 14.30% 56.10% 0.00% 23.00%
Hailstorm 21.40% 2.70% 0.00% 8.30%
Heatwave 0.30% 0.30% 0.30% 0.30%
20 www.iied.orgIIED Working paper
In all the states, male household heads (80%) are The results of the regression can be seen in Table A3.3,
more common than female household heads. This is Annex 3 and are interpreted in the next section.
consistent with national data where around 89% of
household heads are men. Survey data shows that the 3.3.1 Socioeconomic variables
education level is very low in the study areas. Almost
Household size: This influences how the household
70% of the respondents had no formal education with
will be able to cope in times of climate-related extreme
the remaining having attained only primary or lower
events. Large households are often considered more
education. These low levels of education will make
vulnerable than smaller households. However, larger
migrants less competitive in the economic sector,
households might be able to diversify their source of
making it harder to secure their household finances,
income more easily by sending one of their members
especially in times of climate-related hardship.
elsewhere. Household size increases the intentions to
Households have approximately five members on migrate by 1.15 times. It can be said that increasing
average. This is higher than the national average of 4.4. household size increases the intention to migrate.
Generally, the levels of income are low in Uttar Pradesh
Age of household head: This is also an important
and Rajasthan. Survey data shows that nearly half of the
factor in migration decision making. Older household
respondents had an annual income below the national
heads may be more attached to their home village
minimum wage (₹4,576 (US$62) per month). Across
than younger household heads. Results indicate that
the study areas, 37% of the households contain at least
households with older household heads have less
one member who has migrated in the past.
intention to migrate.
Climate-related extreme events are among the
Education: The educational level of the head of the
significant stressors mentioned by household heads
household influences the level of information available
in all the states. Of the 1046 households, 70% of the
to the rest of the household and their ability to prepare
respondents indicated that drought/irregular rainfall is a
for climate-related extreme events. Households
significant stressor. In addition, 23% mentioned flood as
where the household head has no education have
a significant stressor, while 8.3% mentioned hailstorms.
more intention to migrate than those who have
In our analysis of intention to migrate as influenced completed secondary and higher education.
by respondents’ perceptions of socioeconomic and
Livelihood: Crop farmers are affected more by hazard
environmental variables (using binary logistic regression
events and climate variability than other workers.
models), we find the following broad results:
Households associated with MGNREGA have less
• Household size, age of household head, education intention to migrate than those associated with
level and monthly household income are the most farming alone.
significant socioeconomic variables that can trigger
Migration network: This plays an important role in
migration responses at the household level.
migration decision making. The results indicate that the
• Climatic events like drought, flood and hailstorms presence of a network of family and friends who have
act as ‘stressors’ and drive individuals/households already migrated plays an important role in migration
to accept migration as a survival strategy. In the decision making.
regression model climate-related stressors explain
Household income: Households that have the
about 3% of the variations in the decision to migrate.
financial resources will be able to support members
• However, when socioeconomic factors are combined to embark on migration. In contrast, those who do
with climate stressors, these explain 13% of the not have the financial resources may opt for other
variation in the decision to migrate. This indicates coping methods.
that climate change acts as a stress multiplier
to socioeconomic issues already being faced
by households.
www.iied.org 21You can also read